1. Introduction
Paired data are very common in statistical and medicinal research. A typical example is a clinical trial where subjects are measured prior to a treatment, say for elevated systolic blood pressure, and then measured again after the treatment with a drug to lower the blood pressure. Another example is the use of matched cases and controls. One sample from the the case group and another matched sample from the control group may be used to form a paired sample by using additional variables that are measured in addition to the variable of interest. Paired data are often used to reduce variability and to make more precise comparisons with fewer subjects, and this has resulted in attracting many statisticians to develop more efficient tests and inferences for paired data.
Let  be
be  random samples from a bivariate distribution with continuous endpoints. The marginal distributions of X and Y follow
  and
and , respectively. The null hypothesis of interest is
 . This problem often occurs in applied research for testing the equality of the marginal distributions. For example, in a one-arm Oncolgy study, the tumor size of each patient is measured before and after treatment. If the cancer treatment is effective on patients, the tumor sizes in the majority of patients are expected to be smaller after the treatment than the baseline measurement. Therefore, an appropriate alternative hypothesis is given as
  with at least one point
  such that
 . One important typical case in the above problem is the location problem, that is,
  for all
 , where
 . The X distribution has a positive shift compared to that of the Y distribution.
The two sample paired t test is a commonly used parametric approach for comparing the means of two distributions. It computes the difference between the two measurements of each subject  , and then tests whether the average of these differences is significantly different from zero by using the test statistic
 (1.1)
(1.1)
where  and
and  are the sample mean and the standard deviation, respectively. The two sample t test makes certain assumptions, such as the normality of the sample difference which needs to be checked by normality tests [1] [2] before applying the paired t test. If one or more of these assumptions can’t reasonably be met, then the paired t test may be not appropriately applied.
An alternative to the two sample paired t test is the Wilcoxon signed rank (WSR) test [3] , which is a commonly used nonparametric test for paired data when at least one of the assumptions is not satisfied. The Wilcoxon rank sum test (also known as the Mann-Whitney test) [3] [4] is a nonparametric statistical test for assessing whether the two independent samples are from the same distribution. It may be not be suitable for testing paired data without some modification. Later, Lam and Longnecker [5] proposed a modification of the Wilcoxon rank sum (MWRS) test by introducing a consistent variance estimator for assessing the equality of the marginal distributions of a bivariate distribution. The MWRS test was compared to other tests based on Monte Carlo simulation with small sample sizes, and was shown to be as powerful as the two sample paired t test for the bivariate normal data, and more powerful than both the two sample paired t test and the WSR test for the Farlie-Gumbel-Morgenstern distribution with exponential marginals. We propose a new rank difference (RD) test for paired data based on the rank difference between the paired sample to capture the sample difference. We also introduce the modified Baumgartern, Weiβ, and Schindler (MBWS) test proposed by Shan et al. [6] for paired data. A discussion on choosing between the parametric and nonparametric tests may be found in Fay and Proschan [7] .
The remainder of this article is organized as follows. In Section 2, we briefly review the two existing nonparametric tests for paired data and introduce the two new nonparametric tests. In Section 3, we compare the performance of the competing tests, studying the simulated power of the tests under a wide range of bivariate distributions. A real example is given to illustrate the application of the parametric and nonparametric tests in Section 4. Section 5 is given to discussion.
2. Nonparametric Tests
A nonparametric counterpart to the two sample paired t test is the WSR test for paired samples. The WSR test begins by transforming each difference  into its absolute value
 , then the absolute differences are ranked from the lowest to the highest
 . For continuous endpoints, there is no tie between measurement, and all
 ’s are used in the ranking precess. The WSR test statistic is then expressed as
 (1.2)
(1.2)
The value of the WSR test statistic is a non-negative integer between 0 and . The upper bound would be reached when all signed values are either positive or negative. The standardized WSR test statistic
 asymptotically follows a standard normal distribution. The asymptotic distribution can be used to calculate the p-value and to find the threshold values. But, for small sample sizes, the exact distribution of the WSR test provides accurate and reliable results. The exact sampling distribution of the WSR test can be obtained by enumerating all possible combinations of the positive and negative signs. For example, if we have
  subjects in the study, then the absolute differences,
  produce the order of ranks
 . All possible combinations of plus and minus signs that could be distributed among these ranks are
 . Then, the exact p-value of a given data is the proportion the combinations whose WSR test statistic is as extreme as that of the given data.
Another nonparametric test considered is the MWRS test proposed by Lam and Longnecker [5] for assessing the equality of the marginal distributions of a bivariate distribution. Let  and
and  denote the rank for
  and
and  in the combined sample, and
  be the rank for
  in the
  sample and
  be the rank for
  in the
  sample. Then the MWRS test is defined as
 (1.3)
(1.3)
where ,
,  is the Spearman’s coefficient of rank correlation.
The asymptotic distribution of MWRS is a standard normal distribution due to the consistency of the variance estimator [5] . The MWRS test was shown to have comparable power to paired t test and the WSR test.
Two Proposed Nonparametric Tests
Two steps are implemented in the Wilcoxon signed rank test: calculation of the absolute difference followed by the ranking of these differences. The new proposed RD test calculates the test statistic by revising the order the the two steps in the WSR test: ranking the observations followed by the difference of the ranks. Specifically, the associated test statistic of the RD test is
 (1.4)
(1.4)
The value of the  test statistic is an integer between
  and
and , which includes the sample space of the WSR test. A larger sample space could potentially have a less discrete type I error rate in studies with small to medium sample sizes. The sign of
  is the same as that of
  in the WSR test. The new proposed RD test captures not only the difference within each subject, but also the rank of the observations within each subject.
Recently, Baumgartern, Weiß, and Schindler (BWS) [8] proposed a novel nonparametric test for two independent sample problem, which is based on the squared value of the difference between the two empirical distribution functions weighted by the respective variance. This weighting places more emphasize on the tails of the distribution functions. This new test is not suitable for a one sided problem due the nature of the construction of the test statistic. For this reason, Neuhauser [9] proposed a modified BWS test using the sign of the difference of the rank and the mean of the rank to enable the one sided problem. It was then further modified by Shan et al. [6] with the exact mean and variance estimates of ranks [10] for an one sided two independent sample problem. We consider this MBWS test [6] for paired data, and the test statistic is of the form
 (1.5)
(1.5)
where

and

Although the asymptotic distribution of the test statistic for the MBWS test may not be easily derived, an exact permutation test or a simulation based test can readily be performed in order to calculate the p-value for a given data set. It should be note that all the nonparametric procedures aforementioned can be used for data with or without ties; in the case of ties the ranks are defined to be the midranks.
3. Numerical Study
To evaluate the performance of the parametric and nonparametric test, sample size , significance level of
  and 20,000 simulated iterations were used in the Monte Carlo exact simulation. Five different tests were competed for each plot: 1) the RD test; 2) the MBWS test; 3) the MWRS test; 4) the WSR test; and 5) the two sample paired t test. The two sample paired t test is the only parametric test in this article, and all the other four tests are nonparametric approaches. Four difference bivariate distributions were examined: 1) the bivariate normal distribution; 2) the bivariate distribution with gamma marginal distributions; 3) the bivariate generalized exponential distribution; and 4) the bivariate distribution with a gamma and a exponential marginal distributions.
The first considered bivariate distribution is a bivariate distribution with mean  and variance covariance matrix
 , where
  is the correlation coefficient,
 . Figure 1 shows the power plots for the bivariate normal distribution of different means with a fixed covariance matrix. Equal variances are assumed
 , and four different
  values are considered in the figure: 0, 0.2, 0.4, and 0.7. The 95% threshold value was simulated from the bivariate normal distribution with
 , and a given
  for each plot in Figure 1. As seen, the simulated power of each test is an increasing function of
 . The two sample paired t test is the most powerful test as expected due to the fact that this is the uniform most powerful unbiased test for this problem when the data is from the bivariate normal distribution of different means for a given covariance matrix. The new proposed RD test and the MBWS test are compatible with regard to the power, and both are generally more powerful than the WSR test. The MBWS test has greater power than the MWRS test for a small to medium ρ, and the RD test is generally more powerful than the MWRS test. Given a large ρ, the MWRS could be more powerful than the proposed MBWS test, but less powerful than the RD test. Figure 2 shows the power plots of the correlation coefficient ρ given equal variances
  and the ratio of mean difference and variance
 . Similar results are observed as the results from Figure 1. It should be noted that the paired t test is only appropriate when the difference
  follows a normal distribution. The other four tests considered in this article are nonparametric approaches that are applicable to any continuous distributions with fewer assumptions.
We also compare the bivariate normal distribution with equal means but different variances given the same covariance . The power plots as a function of
  are shown in Figure 3. The threshold value is simulated from a bivariate normal distribution with equal variances. The paired t test, the WSR test, and the MWRS test appear to have less power than the two new proposed tests. The MBWS test is clearly more powerful than the other proposed RD test. The two new proposed tests are able to detect the variance change in the distribution, while others do not.
In addition to the bivariate normal distribution, we also consider other bivariate distributions. One example is the bivariate distribution with gamma marginal distributions , where
  and
and  are the shape and scale parameters, respectively. The data may be generated from the function
  in the R package
 . The two marginal gamma distributions with the same scale parameter but different shape parameters are considered, i.e.,
  and
and . Figure 4 shows the power plot as a function of the ratio of the shape parameters
 . The two proposed tests have the highest power, followed by the MWRS test, the WSR test, and the paired t test. The two new proposed tests dominate other tests and the power gains are substantial.


Figure 1. Power study for a bivariate normal distribution with difference mean given four different covariance matrices.

Figure 2. Power study for a bivariate normal distribution with the same equal variances and the ratio of mean difference and variance but different ρ.

Figure 3. Power study for a bivariate normal distribution with the same mean but different variances σ1, σ2 given the covariance 0.6.

Figure 4. Power study for a bivariate distribution with gamma marginal distributions,  and
and .
.
Another bivariate distribution examined here is the bivariate generalized exponential distribution [11] with the joint cumulative distribution function

where , and
, and  are the three parameters in the distribution. The marginal distributions for
  and
and  are generalized exponential distributions with parameters
  and
and , respectively. The third parameter in the generalized exponential distribution is given as
  in the simulation study. The null distribution is simulated with equal
  and
and , i.e.,
 . The power plot is drawn as a function of
 , see Figure 5. The signed rank test is very lower in power as compared to other procedures; the two new proposed tests are not as powerful as the paired t test and the MWRS test.
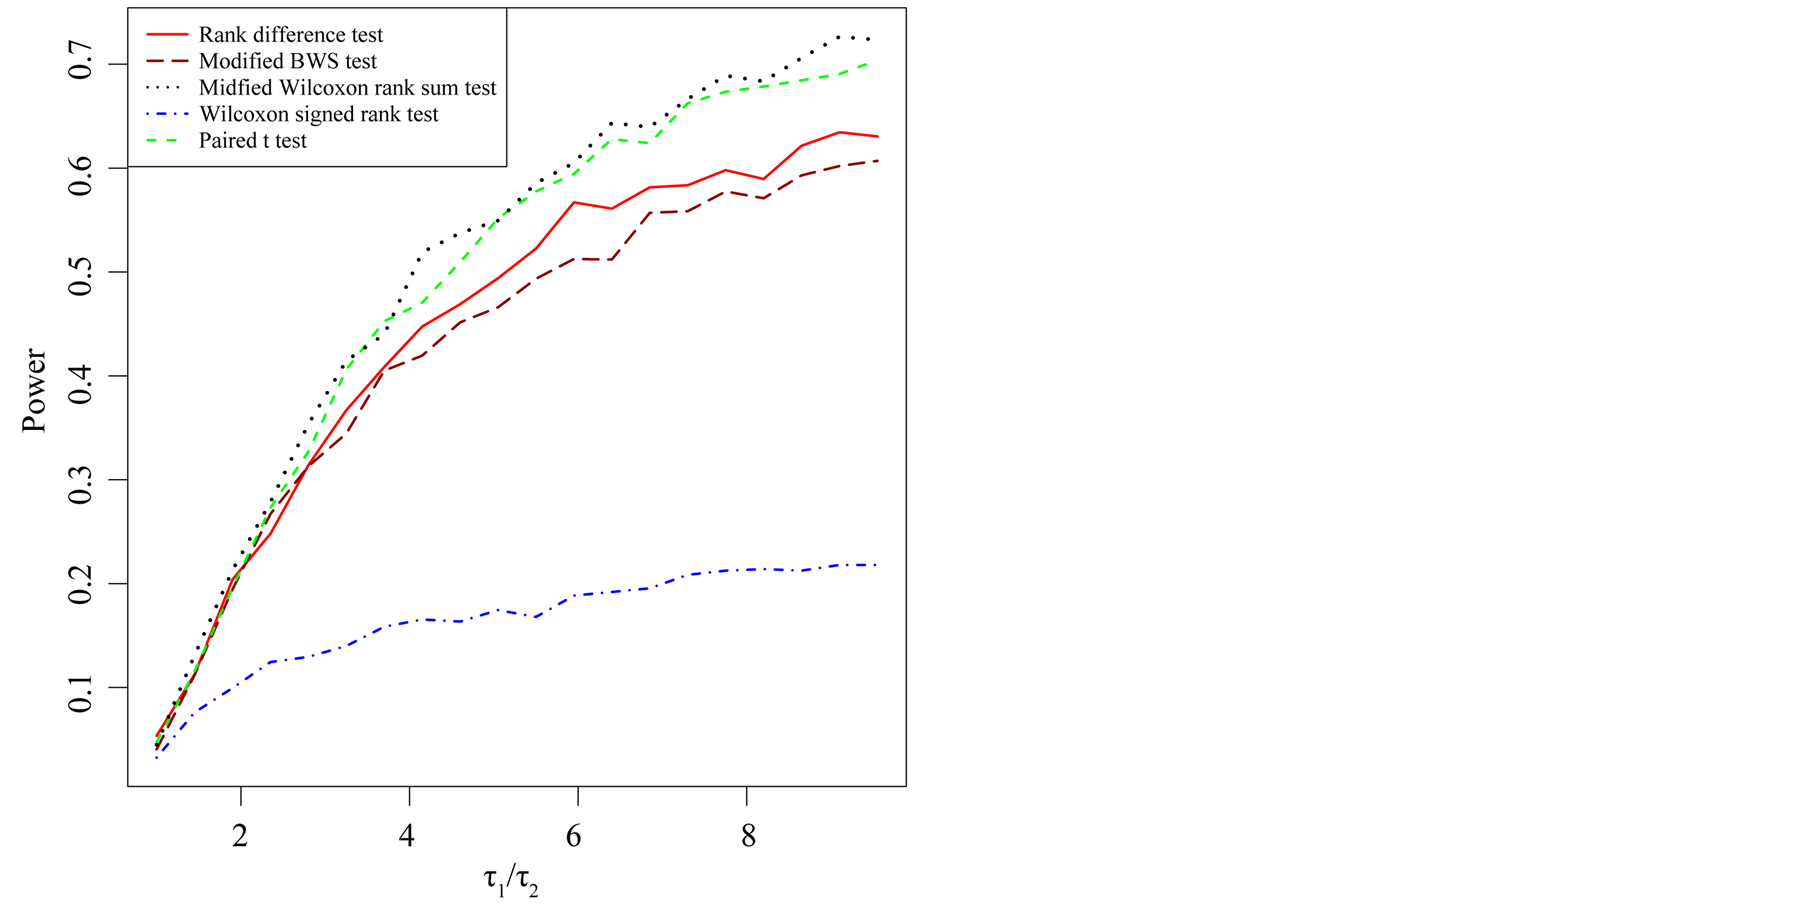
Figure 5. Power study for a bivariate generalized exponential distribution with parameters .
.
For further comparison, we examined the bivariate distribution with different types of marginal distributions, for example, one marginal distribution follows a gamma distribution  and the other is an exponential distribution
 . Equal mean is assumed under the null hypothesis with
  in the gamma distribution. The power plots as a function of
  are displayed in Figure 6. The paired t test and the WSR test are less powerful than the other three tests. The proposed MBWS test is generally more powerful than the MWRS test under large
  alternatives.
4. Example
We consider an example and apply the five different tests discussed in this article: 1) the paired t test; 2) the WSR test; 3) the MWRS test; 4) the RD test; and 5) the MBWS test. Suppose a pharmaceutical company wants to assess the efficacy of a drug in lowering systolic blood pressure. The systolic blood pressure reading in mmHg for 10 subjects were measured before and after the administration of the drug, and the associated data can be found in Antonisamy et al. [12] . The systolic blood pressure is expected to be lower after the drug treatment, therefore a one sided alternative is appropriate for this study. The p-value of the WSR test was calculated based on the exact permutation approach, the p-value of the paired t test was computed using the asymptotic approach, and the p-values of all the other three nonparametric tests were calculated based on the 100,000 Monte Carlo exact simulation. The p-values are reported in Table1 All five tests conclude that the drug is effective in lowering the systolic blood pressure at the significance level of 0.05.
5. Conclusion
In this article, we introduce two new nonparametric tests for testing whether paired samples come from the same population. The two new proposed nonparametric tests are comparable to the paired t test for testing the mean difference for the bivariate normal distribution given a covariance matrix, and much more powerful than the paired t test and another two nonparametric tests for the difference in variances for the bivariate normal distribution. Extensive numerical power comparison was conducted for various other important bivariate distributions. The proposed RD test and the MBWS test have greater power than other tests in several important scenarios, and the power gains are substantial. These two proposed tests are recommended for use in practice due the power gains as compared to other competitors. One limitation of the MBWS test is the difficulty to find the asymptotic distribution. However, permutation-based or simulation-based tests can always be used for the p-value calculation. We consider exact testing procedures as future work [13] -[20] . The extension of the RD test

Figure 6. Power study for a bivariate distribution with  and Exp(1) as marginal distributions.

Table 1. p-values for the example from the systolic blood pressure study.
and the MBWS test to the k-sample independent and dependent problems [21] -[24] is currently underway.
Acknowledgements
The author’s research is partially supported by a Faculty Opportunity Awards from UNLV.