A Game Theoretic Approach for Analyzing the System of Incentives and Restraints Present in Chinese Financial Systems ()
1. Introduction
One of the shortcomings of the Chinese financial systems is that its development has not kept up with the banking needs of the 21st century. Despite attempted reforms to the system, it is still dominated by a moribund administration that does not adapt to the current free market economy system. For instance, many of the recent financial innovations to price and hedge risk are not adopted in China which leads to low liquidity in the system. One of the reasons for this is the basic salary structure of these institutions in which the managers and their direct reports make very similar wages despite the vast difference in their responsibilities. This salary structure disincentives excellence in individuals because working hard to get ahead has little or no rewards.
Currently the only incentive system that has been instituted is the system of promotion. Currently, the system consists of one way promotions in which managers cannot be demoted due to poor performance. However, while they have greater administrative power, their wage level does not increase greatly. This system is problematic because oftentimes the promotions are temporally divorced from the accomplishments of individuals. This disconnect oftentimes makes it less effective in motivating individuals to do their best. Furthermore, in systems such as this, once an individual has been passed over for promotion, they are usually excluded from future promotions. This leads to the fact that for many individuals in a firm, there are no effective ways of motivating the workforce.
An alternative incentive system utilizes financial incentives in which employees can be rewarded with changes to their salary, at-risk bonuses as well as being provided equity within the company. In this system salary and benefits are usually fixed, whereas at-risk bonuses are evaluated and paid over a certain interval of time. Finally equity is provided as long term incentives to keep top performers as well as aligning the incentives of these individuals with the future performance of the company. This system has proven to be the most effective in driving innovation, especially in the financial industry [1] . However, the system can lead to the emergence of perverse incentives in which individuals pursue short-term individual gain via excessive risk taking at the cost of long term sustainable growth. In order to better understand this system, a static game model can be utilized to assess the relative contribution of each individual aspect.
2. Methods
2.1. Quantification of Long Term and Short Term Incentives
The first step is to quantify the sum of the long term and short term incentives. This can be well modeled via Equation (1.1)
 (1.1)
(1.1)
In Equation (1.1), Ss is the coefficient that denotes the short term performance of the firms due to behavior of the managers. Ls represents the short term cost imposed by long term behavior, at represents the general behavior during day to day operation of financial institute, at,s represents the short term behavior that will benefit the short term gain but damage the long term gain, at,l is the long term behavior that will increase the income of financial institutes in long term while increasing the management cost in short term. Finally, two boundary conditions exist Ss > 0, Ls > 0.
This equation can be extended as in Equation (1.2) through the incorporation of terms that reflect short term behavior that leads to negative effects in the long term and long term behaviors that lead to short term losses. This is done by subtracting the product of Sl which represents the coefficient of the manager’s short term behavior and Ls which represents long term loses due to long term behavior.
 (1.2)
(1.2)
Additional boundary conditions of  means that under managers’ short term behavior, the long term negative effect is greater than the improved short term performance. Ls is the coefficient of long term effect led by long term behavior of managers,
  means that under the long term behavior of managers, the long term effect is greater than the short term cost.
2.2. Optimal Selection and Equilibrium
Assuming the pay of individuals is ω. The revenue function of owners equals the long term revenue of financial institutes minus cost, . Revenue attributed to the individual equals to the income of individual minus the individual cost caused by individual’s behavior,
  , where the cost function c is consist of functions at, at,s, and at,l which represent short term, day to day, and long term behaviors [2] .
To find the equilibrium behavior of the owners of the financial institution, the owners are assumed to mean risk neutral. Thus, it is possible to find the equilibrium behavior utilizing Equation (2.1)
 (2.1)
(2.1)
Risk-neutral means that expectations of income utility equals to the expected income, i.e. , where x denotes income. Since owners are risk-neutral, the utility function is a monotonically decreasing linear function. Maximization of expected utility can be achieved through the maximization of expected income.
2.3. The Optimal Behavior of Managers
Managers attempt to maximize the utility derived from their income under existing constraints brought be regulation. Assuming that the marginal utility of income is modeled via , risk aversion can be modeled via:
 , to model an individual’s appetite for risk, Ra(x) < 0. Risk neutrality is modeled by Ra(x) =
0, and consequently risk aversion is modeled by setting Ra(x) > 0. Assuming that the income of an individual follows a normal distribution, the following equation can be solved analytically to yield Equation (2.2).
 (2.2)
(2.2)
However, in this model, it is also important to define behavior under less than certain conditions which are denoted CE. The certainty equivalent of managers’ income under uncertain condition is CE. , so the overall relationship is given as the following:
 (2.3)
(2.3)
An individual’s goal is to maximize their expected utility which exists when , therefore, the maximization of expected utility can be solved by mathematically maximizing u(CE). Since
  and r > 0,
 . Hence, to maximize u(CE), individuals only need to take action to maximize their CE, which is allows the following to be simplified to:
 (2.4)
(2.4)
2.4. Nash Equilibrium in Financial Systems
To reach the Nash Equilibrium, which is the solution reached when both sides are non-cooperative, the following conditions must be met. Both the individual employee and the employer seek to maximize the utility associated with their income, and it must reach a point in which these utilities are equal. In this system, the owner of the financial firm has the first mover advantage since they dictate the original salary. The individual then must weigh the benefit of this salary vs. the cost of moving. The interplay between these two factors can be expressed as the following series of Equations (2.5).
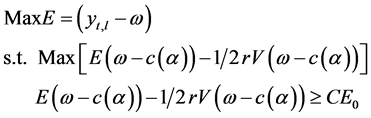 (2.5)
(2.5)
Based upon this system, it becomes possible to assess the behavior of individuals under different incentive programs i.e. those that balance short term vs. different types of long term compensation schemes.
3. Analysis of Compensation Schemes
3.1. Fixed Income System
Under a fixed income system, an individual’s income is independent of performance [3] . Therefore, their income is represented as (3.1)
 (3.1)
(3.1)
Their revenue is then defined as:
 (3.2)
(3.2)
The certainty equivalent of an individual’s income is,
 (3.3)
(3.3)
Assuming the cost of individuals is , to maximize CE the following conditions in Equation (3.4) must be satisfied:
 (3.4)
(3.4)
Under the fixed income system, an individual’s hard work will increase their personal cost. Therefore working hard will reduce the personal revenue of individuals while the income is fixed. No matter the rational choice of individuals is short term or long term behavior, there will not be any observable incentive.
3.2. Contract Responsibility System
Under the contract responsibility system, the owner establishes a performance threshold. If the standard was surpassed, then individuals receive a percentage of the surplus, if the threshold was not achieved, individuals will be penalized. Under this case, the overall income is represented as:
 (3.5)
(3.5)
where s is the fixed income of individuals, βα is the reward commission percentage for surpassing the threshold, βb is the penalty for missing the target, F is the maximum penalty, and y0 is the pre-determined operating standard.
When yt,s ≥ y0, individuals’ income is given in Equation (4.6) and their consequent revenue is defined in Equation (3.7)
 (3.6)
(3.6)
 (3.7)
(3.7)
The certainty equivalent of the individual’s income is,
 (3.8)
(3.8)
This leads to the following constraints being placed upon the optimal choice
 (3.9)
(3.9)
when yt,s < y0 and , the individuals’ income is,
 (3.10)
Then the optimal choice of the individuals is,
 (3.11)
when yt,s < y0 and , an individual’s income is
 , These lead to the following insight that the individuals’ optimal choice is,
 (3.12)
Under this system, an individual’s revenue is positively correlated to the effort which they must expend. However, there are some drawbacks in this system: if the target is set too low, then individuals will take short term behavior and reduce activities like long term R & D and systematic investment in order to obtain short term gains; if the target is set too high, individuals will put down less effort on work since the target is too hard to reach.
3.3. Salary + Bonus
This system consists of an annual salary with a performance based bonus. In this system, an individuals’ income can be expressed as:
 (3.13)
In this system, s is the fixed income of individuals, β is the ratio of benefit based on annual benefit, and α is the ratio of bonus based on risk level of income. From this, it is possible to define an Individuals’ revenue as:
 (3.14)
with the associated certainty equivalent:
 (3.15)
From this, the optimal strategy can be defined as the following:
 (3.16)
When ,
,  , individuals will focus upon maximizing short term results.
When ,
,  , individuals will be ambivalent towards short term results.
When ,
,  , individuals will focus upon long term performance.
When ,
,  , individuals will be ambivalent towards long term performance.
From this it becomes clear that utilizing this framework, one cannot dis-incentivize bad behavior, nor prioritizes long term growth over that of short term results.
3.4. Stock Option
Under this system, the revenue of individuals consists of a fixed income component and stock option component.This allows the income stream to be defined as the following:
 (3.17)
In this framework s is the fixed income, β is the ratio of vesting of stock options to total stocks, E is the strike price of the stock options, λ is the correlation coefficient of stock price and long term gains of financial institutes, and λ > 0.
When , the income of individuals is ω = s. Under this condition the optimal behavior is defined as:
 (3.18)
When , the individuals’ income is,
 (3.19)
Individuals’ revenue is,
 (3.20)
The certainty equivalent of individuals’ income is,
 (3.21)
Therefore, under this condition, the best options for action is,
 (3.22)
Under this system, individuals will be incentivized naturally to optimize long term and near term behavior while avoiding short term payoffs that may have long term negative consequences.
4. Summary
Based upon the numerical analysis, it becomes clear that stock options are the most effective method in motivating consistent behavior in the near term, but also to take long term performance of the firm into account. This is because it aligns the interests of the employee with the long term interests of the firm. This allows capital markets instead of easily manipulated regulatory system to provide oversight to the individual. This is because the stock price of the firm, which is a major component of one’s compensation, reflects an evaluation of whether activities taken are beneficial to the company. In summary, the stock options system is an effective way to enhance the incentive effect and operational efficiency, and should play a key part in reforming the Chinese financial industry to be more innovative and forward looking.
NOTES
*Corresponding author.