A Novel Model of Intelligent Electrical Load Management by Goal Programming for Smart Houses, Respecting Consumer Preferences ()
1. Introduction
Many experts believe that a major development in the electric power system is required. Some of the main objectives of this development are a new generation of green electricity production networks, reliability and using smart systems, which is generally known as the smart grids and smart homes. In the smart grid, advanced technologies improve network efficiency and mass transfer. Information and Communication Technologies (ICT) are widely served in the network to increase productivity, confidence and flexibility [1]. Finally, consumers can benefit low cost bills by actively managing energy consumption. Now the smart grid has become an interesting research topic. The main research considerations are applied ICT infrastructure and energy management applications, including distributed resource management, load management and demand response techniques (DR) [2]. In the field of energy efficiency, DR is known as a main program of distribution systems. Consumers traditionally get the habit to pay a fixed rate for the electrical energy, but now they are able to manage their energy usage, mainly due to variable tariffs [3,4].
Pyrko proposed a model of energy consumption management based on energy tariffs [5], where prices vary with time. This model is presented particularly for reduction of peak load; however, the balances between home appliances and consumers are possible only in the case that consumers are both able and willing to take advantage of the tariff information. The paper concentrates on time of use (ToU) tariffs as incentive DSM programs. With these ToU tariffs, consumers can pay varied expenditure for electricity during different hours. Recently, attention to the ToU tariffs has been increased. For instance, the neural network algorithm is used for load shifting at a petrochemical plant in [6], and fuzzy logic is applied for load shifting within a cylinder of hot-water [7].
The first concerns about behaviors of the energy management system for the residential sector are introduced in early 1990 [8]. A classification of household appliances is proposed by Tompros et al., Where network architecture with the ability to implement more general programs for energy-saving in the Home Area Network (HAN) is described [9]. Zhu et al. proposed a DSM method using integer linear programming technique, which is able to minimize the peak hourly load and satisfy both the consumer preference and specific requirements of all individual appliances [10].
The paper also considers the problem of residential appliances scheduling for Minimizing Electricity Cost; however, unlike [11], the proposed mechanism is deterministic and the electricity cost planning is based on the tariff, typically known for 24 hours ahead of time [12]. In general, the approach allows meeting consumer preferences, while showing the possibility of load shifting for energy efficiency, but cannot be used in a real time plan because the user must arrange a list with the appliances to be executed within the next 24 hours.
The remaining parts of this paper are organized as follows. In Section 2, the formulation of the household loads is represented. Then, modification in the model is applied to Minimizing Electricity Cost. In Section 3, a list of preferences and load specifications is provided by a voluntary consumer. This list includes consumer preferences regarding the time of using household loads. Then, the obtained results from simulations on the list are shown. In Section 4, numerical investigations using the Mixed Integer Linear Programming (MILP) framework are presented and comparisons of different scenarios are executed.
2. Residential Load Management System
The overall system structure is depicted in Figure 1. The predominant component is the Smart Home Controller (SHC), which is responsible for managing the loads inside the house in order to achieve the objectives such as Minimizing Peak Energy Consumption and Minimizing Electricity Cost, based on ToU tariffs, Load specifications, and the information collected from the consumer preferences. The SHC can monitor and control loads by means of communication networks (e.g. GPRS, WiFi or LTE).
2.1. Residential Load Classification
The paper divides household loads into three categories
including:
1) Time Changeable Loads (TCLs)
TCLs can be shifted in time, such as washing machines. SHC generates scheduled starting commands to turn them on. These loads consume electric power based on their power consumption pattern which is given by its specifications.
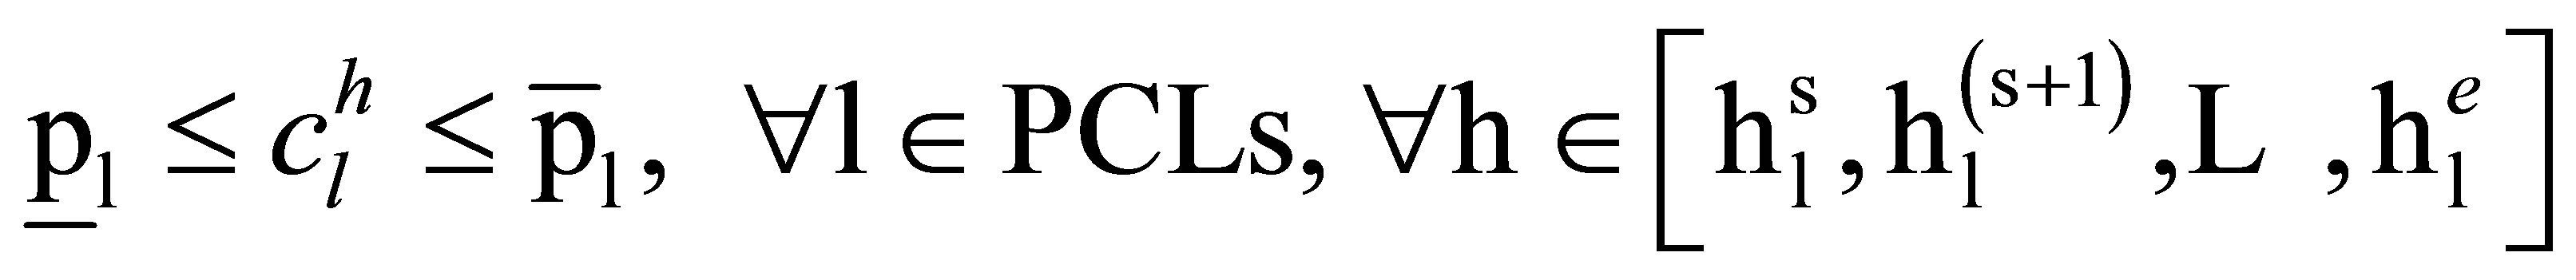
2) Power Changeable Loads (PCLs)
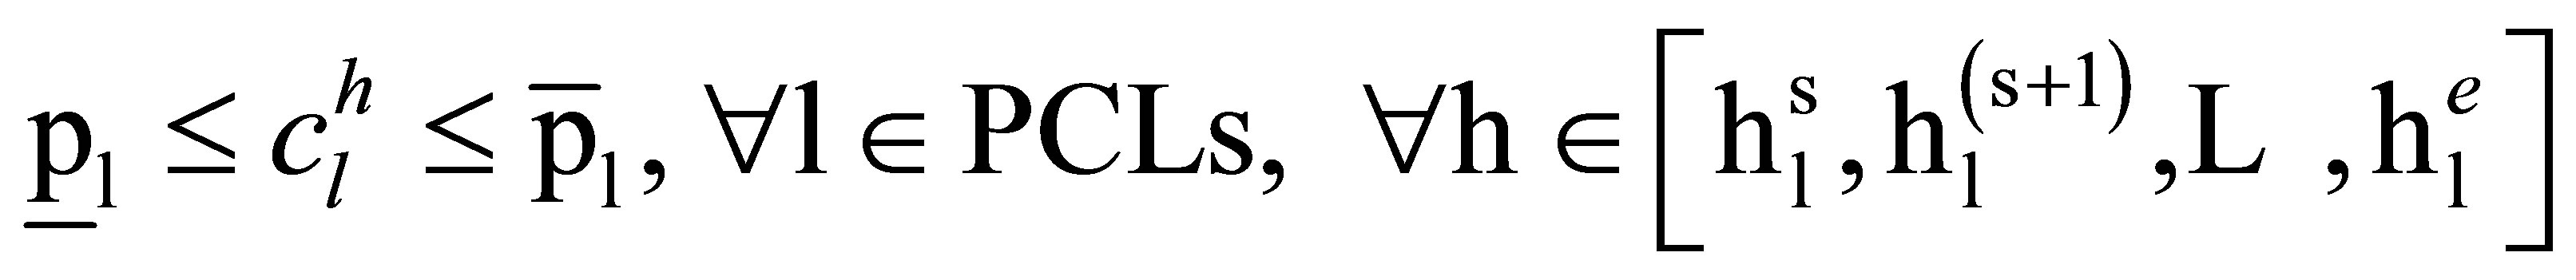
PCLs consume electric energy in the range of minimum power consumption, and maximum power consumption. SHC decides how much energy these loads consume in their working period.
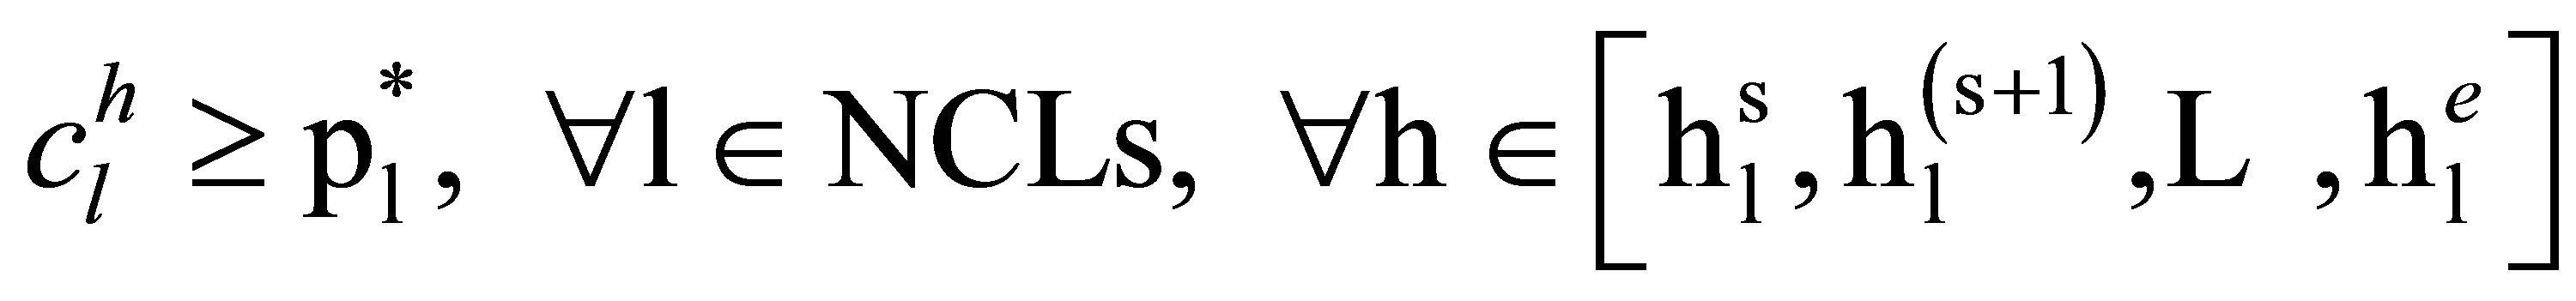
3) Non Changeable Loads (NCLs)
For NCLs such as TV which have fixed power consumption requirement  and working period, SHC considers the power consumption according to the consumer preferences.
2.2. Optimization Models
In this section, parameters, constants and variables, used in the models reviewed in this section, are listed in Tables 1 and 2, respectively. Then the two models, which are commonly applied in the literature for optimization of peak load and electricity costs, are formulized. At the end, the goal programming approach applied for combination of the two models is introduced.
Although many studies in the literature consider minimizing energy costs as an original objective function, this paper first tries to minimize peak power consumption. This model is shown by (1)-(9). It is worthy to mention that the electric power is assumed to remain constant in a pre-determined time interval, so that “power consumption” in this model is replaced for “energy consumption” at the same time interval, where the load is peaking.
 (1)
(1)
 (2)
(2)
 (3)
(3)
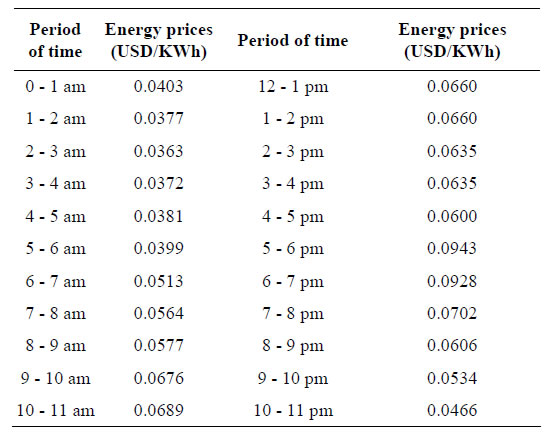
Table 2. Electricity tariff (spot price). Data taken from NYISO, www.nyiso.com, February 15th, 2011.
 (4)
(4)
 (5)
(5)
 (6)
(6)
 (7)
(7)
 (8)
(8)
 (9)
(9)
As mentioned above, this paper is based on time varying prices of electricity. Table 2 shows dynamic electricity tariffs, which are also referred to briefly by the RealTime Pricing (RTP).
In addition, the time of use tariffs based on Table 3
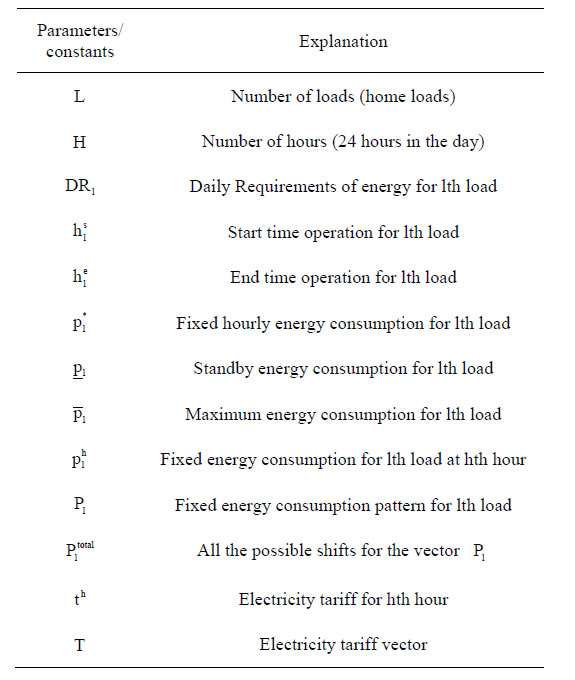
Table 3. Model parameters and constants list.
are used to minimize electricity cost and the terms (10)-(19) show the model for minimizing electricity cost.
 (10)
(10)
 (11)
(11)
 (12)
(12)
 (13)
(13)
 (14)
(14)
 (15)
(15)
 (16)
(16)
 (17)
(17)
 (18)
(18)
 (19)
(19)
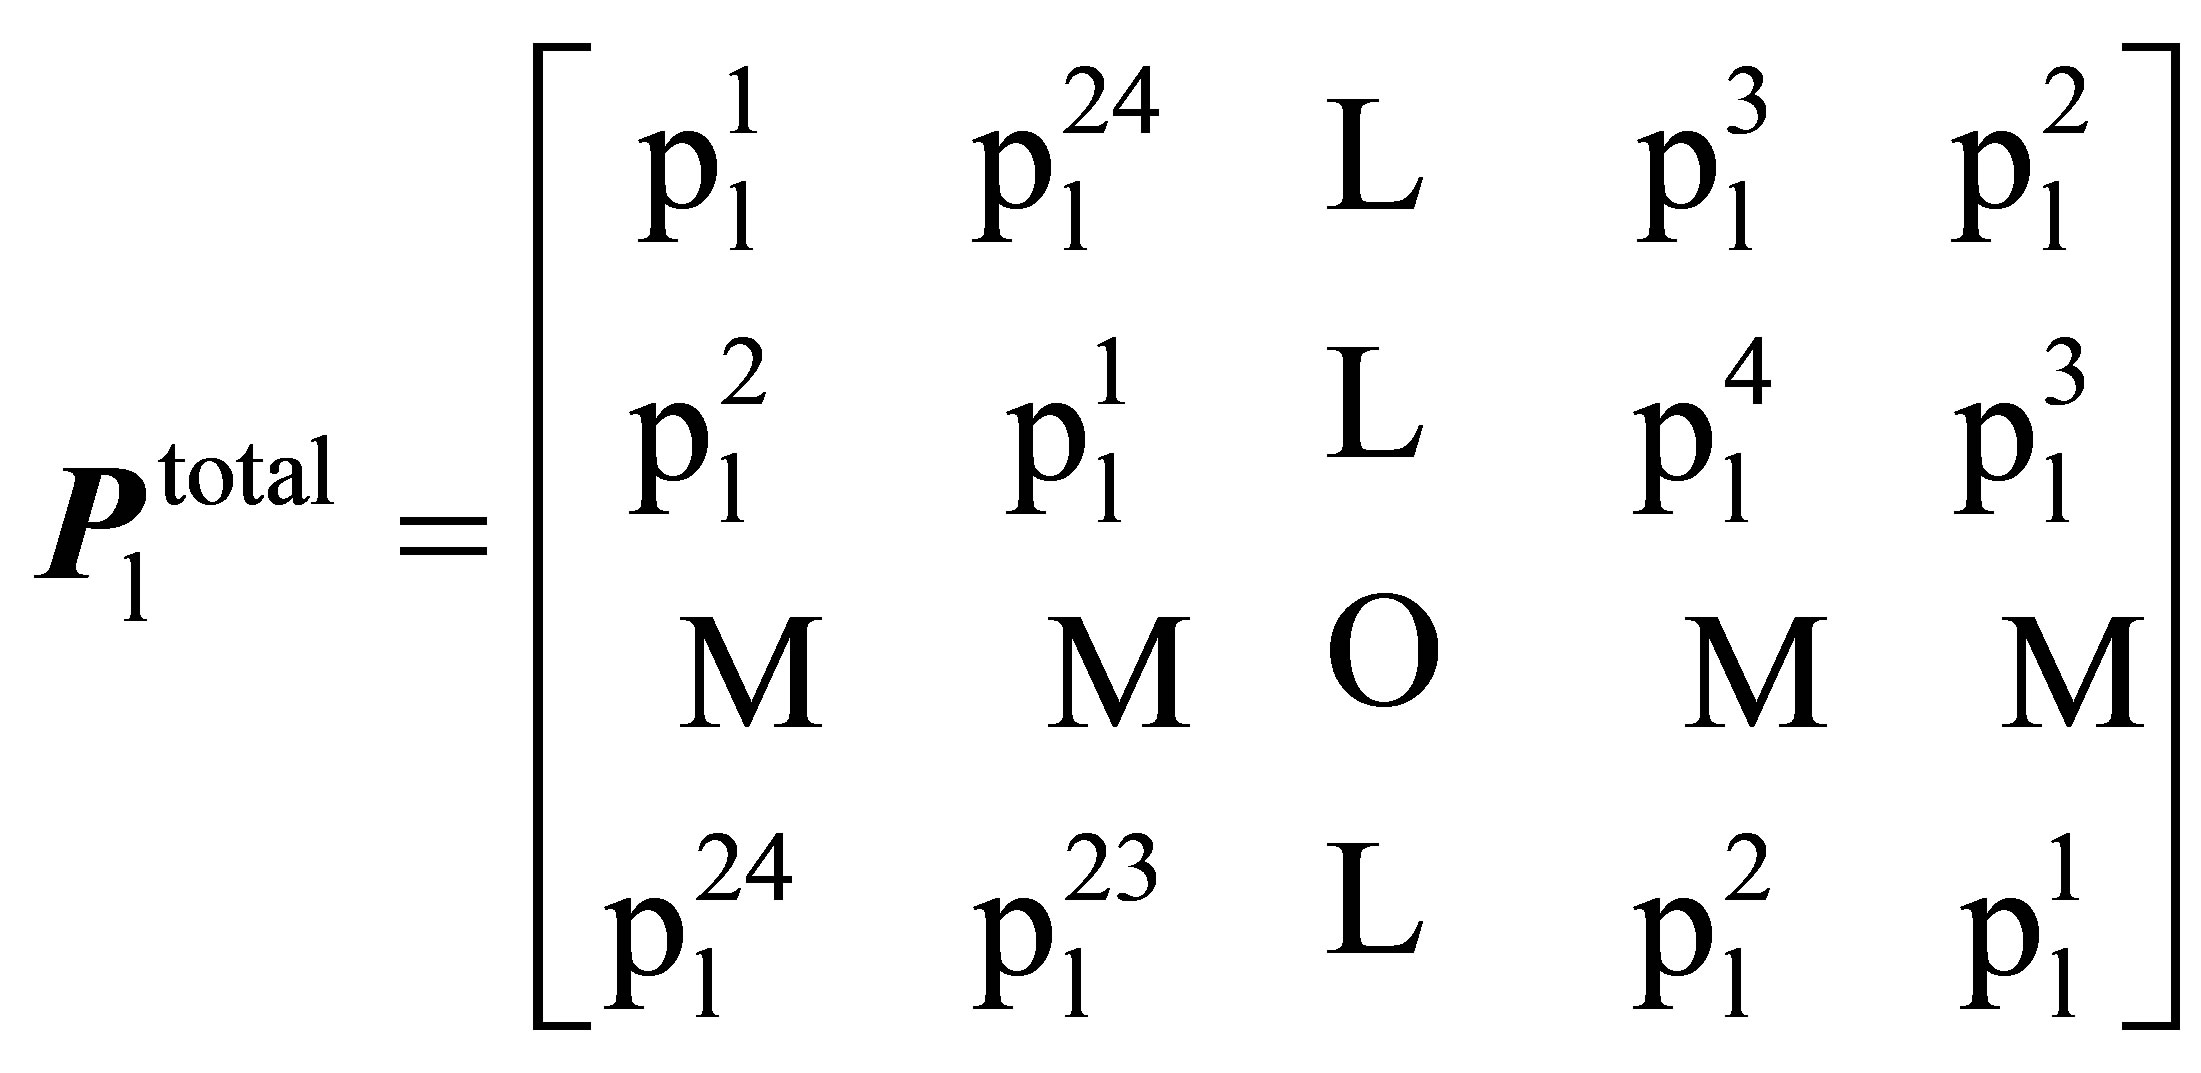
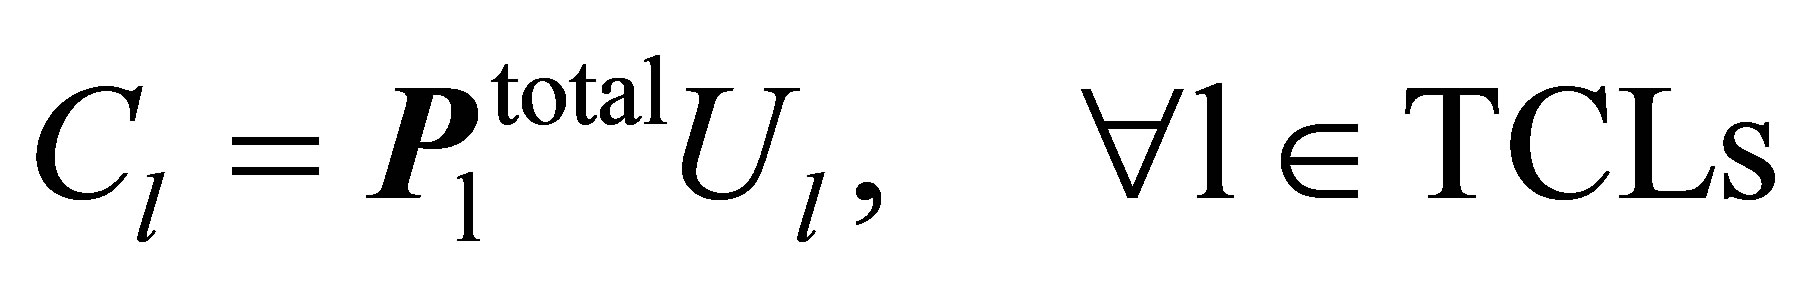
The constraints (6)-(8) are used to model TCLs power consumption, where (6) shows the total shifts for TCLs power consumption pattern .The vector
  operates as a switch controller that specify the start time for TCLs. In view of the fact that the vector
  must act same as the vector
 , needed to introduce the matrix
  that considers total shifts of vector
  in time. The vector
  shows time of use tariffs taken from Table 3. for example
  shows the cost of power consumption in the time interval between 2 am to 3 am. The vector
  indicates all loads power consumption per hour.
In this paper, both planning models are MILP that can be solved by many well-founded approaches. Although in small case studies it is possible to try a direct search method, in the literature branch and cut procedures are introduced as very popular methods for solving a wide range of integer programming problems providing a guarantee of global optimality. Branch and cut methods are accurate algorithms including of a mixture of a cutting plane method with a branch and bound algorithm. These methods work by solving a sequence of linear programming relaxations of the integer programming problem [13].
The goal programming approach changes some objectives into constraints by adding slack and/or surplus variables to represent deviation from a goal. There are some algorithmic changes possible to allow a more effective solution, but for the majority of applications, simply using a linear programming package like Solver is completely adequate.
Both of these linear programming problems are equally important. However, sometimes one of the objectives dominates the other, with respect to some criteria. In these issues can insert weighting coefficients in the goal programming problem and distinguish the difference in importance to the objectives [14].
3. Case Study and Simulation Result
In this section, simulations are carried out by a high level computer languagewhich is applied for implementation of the proposed mechanism under various scenarios. Table 4 contains a voluntary customer appliance, listed along with the specifications of the loads and consumer preferences.
For example, as one of the NCLs, load 1 has 15 kWh daily energy requirements which is modeled as follows:
 (20)
(20)
 (21)
(21)
As a one of the PCLs, load 5 has 4 kWh daily energy requirements and the model as follows:
Table 4. Consume preferences and loads specification.
 (22)
(22)
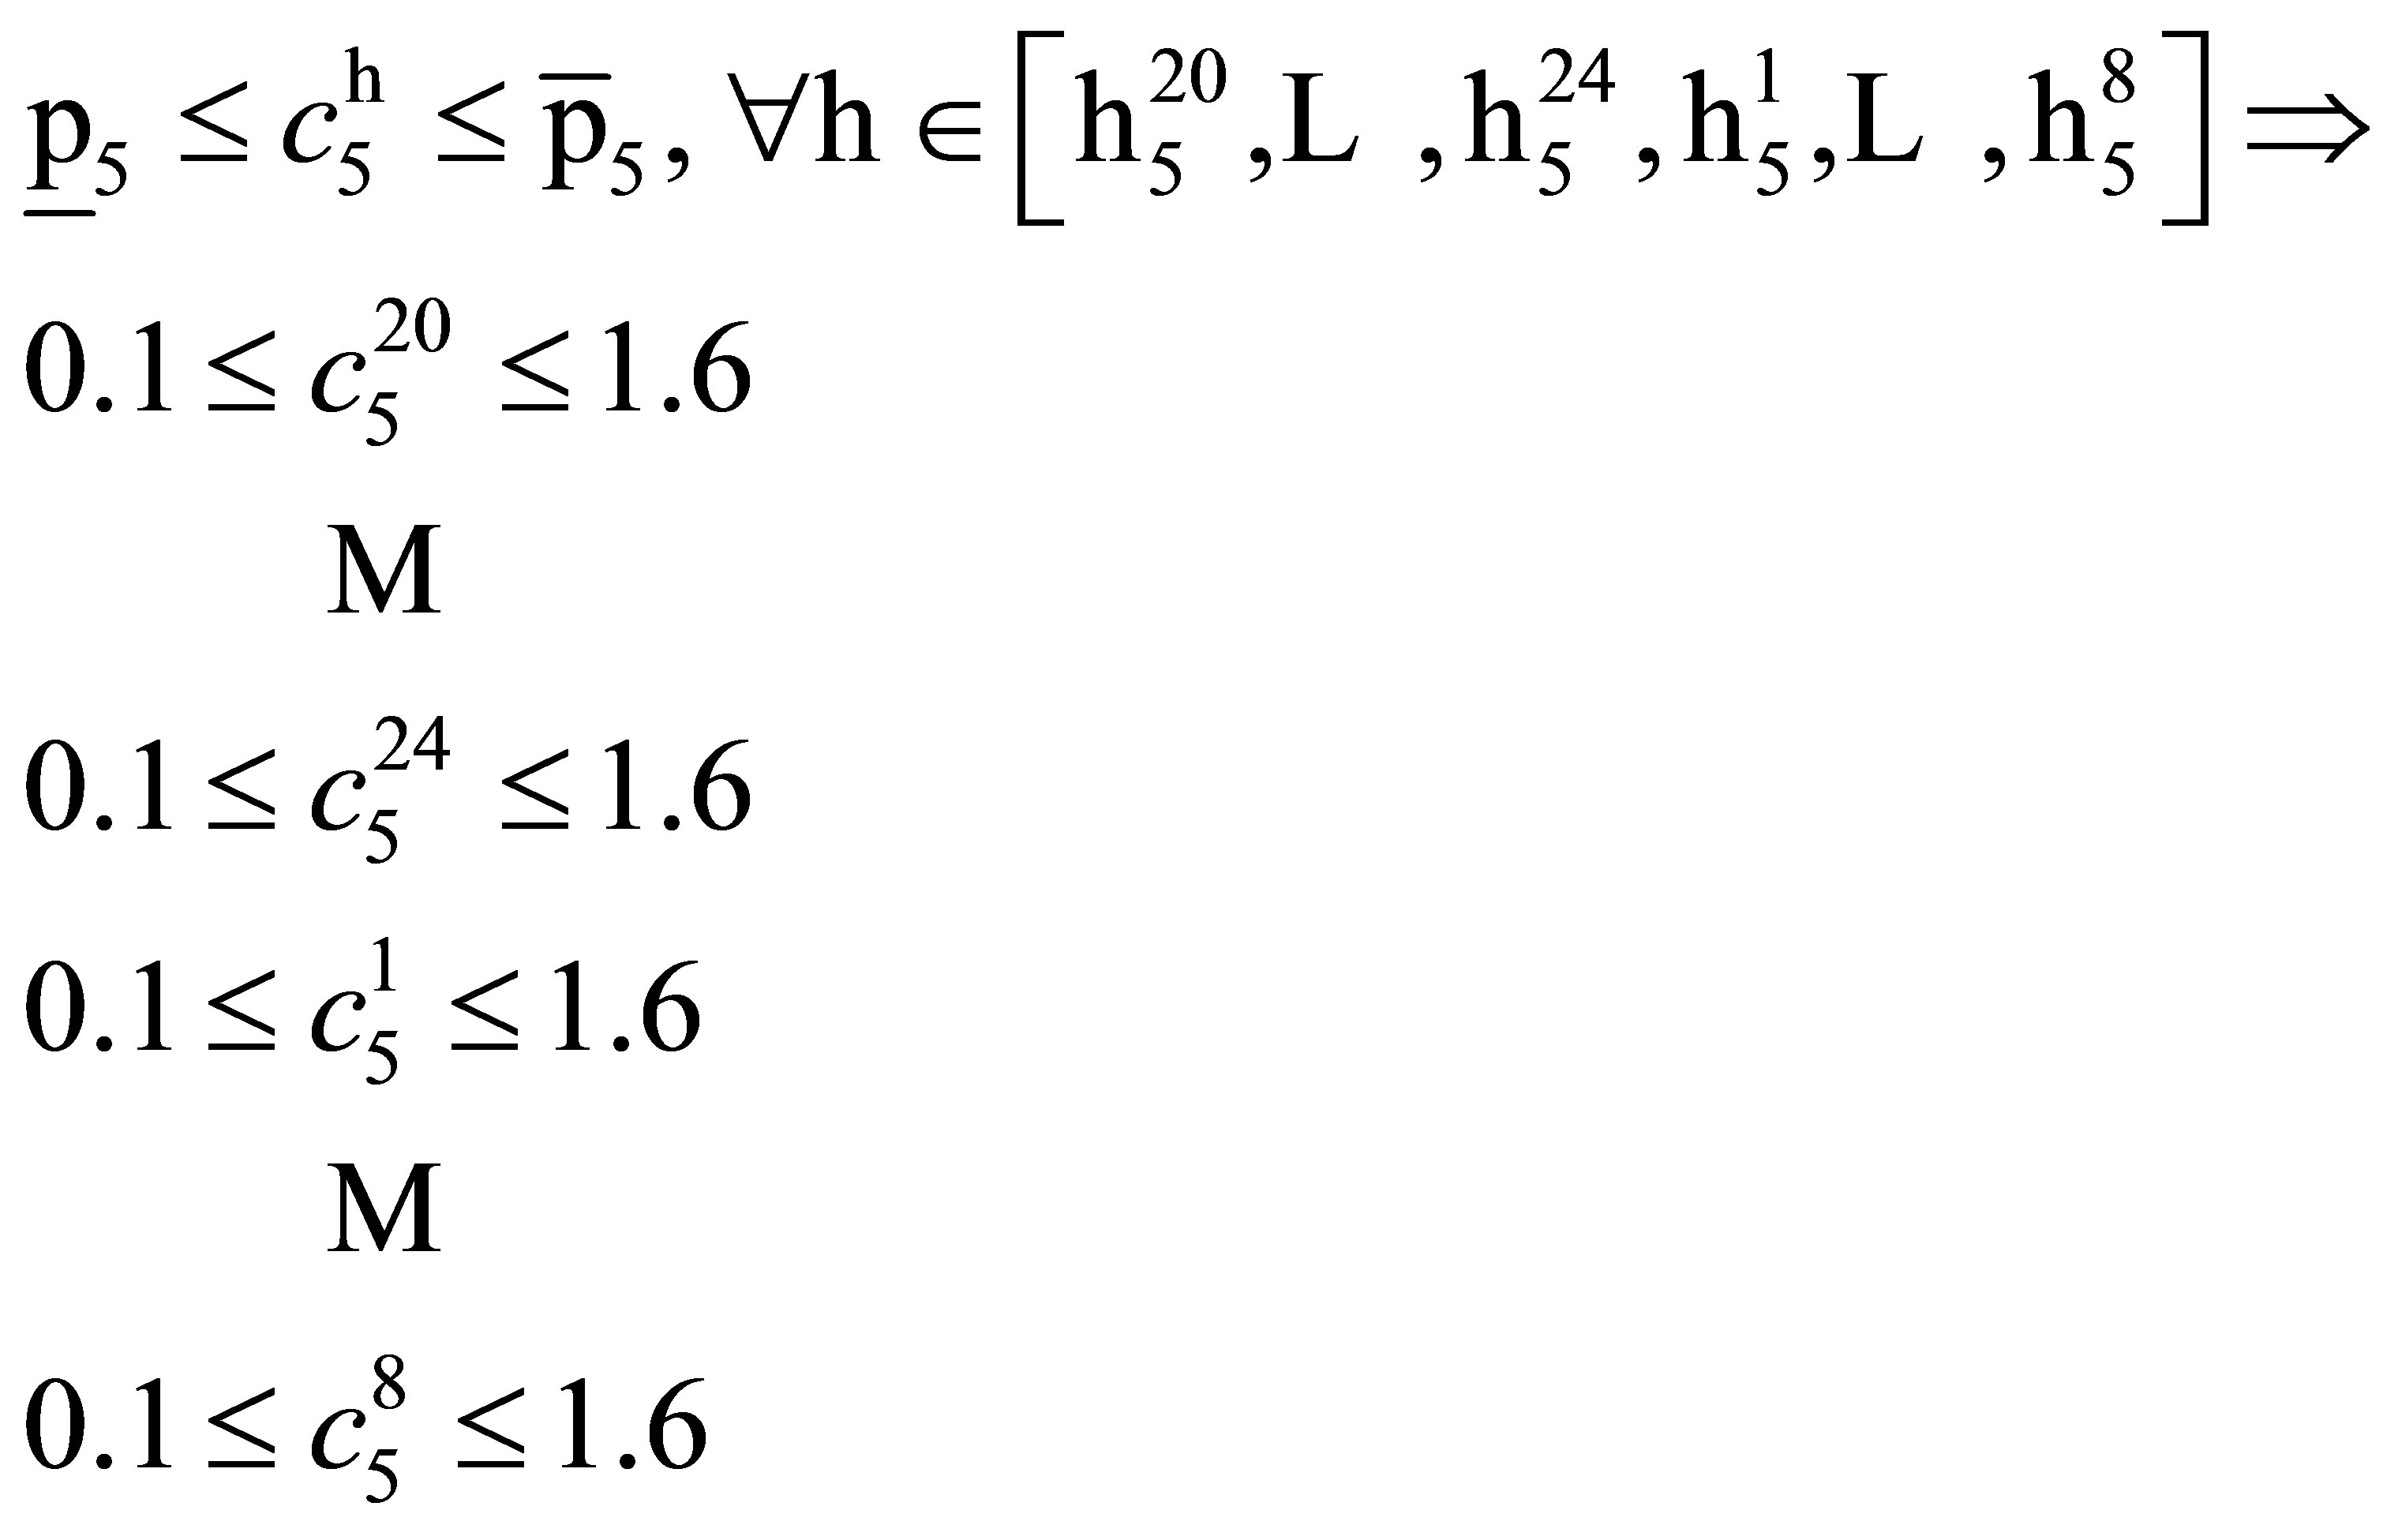 (23)
(23)
As a one of the TCLs, load 8 has 1.8 kWh energy daily requirement. The power consumption pattern is  and the total shift is obtained from
 :
:
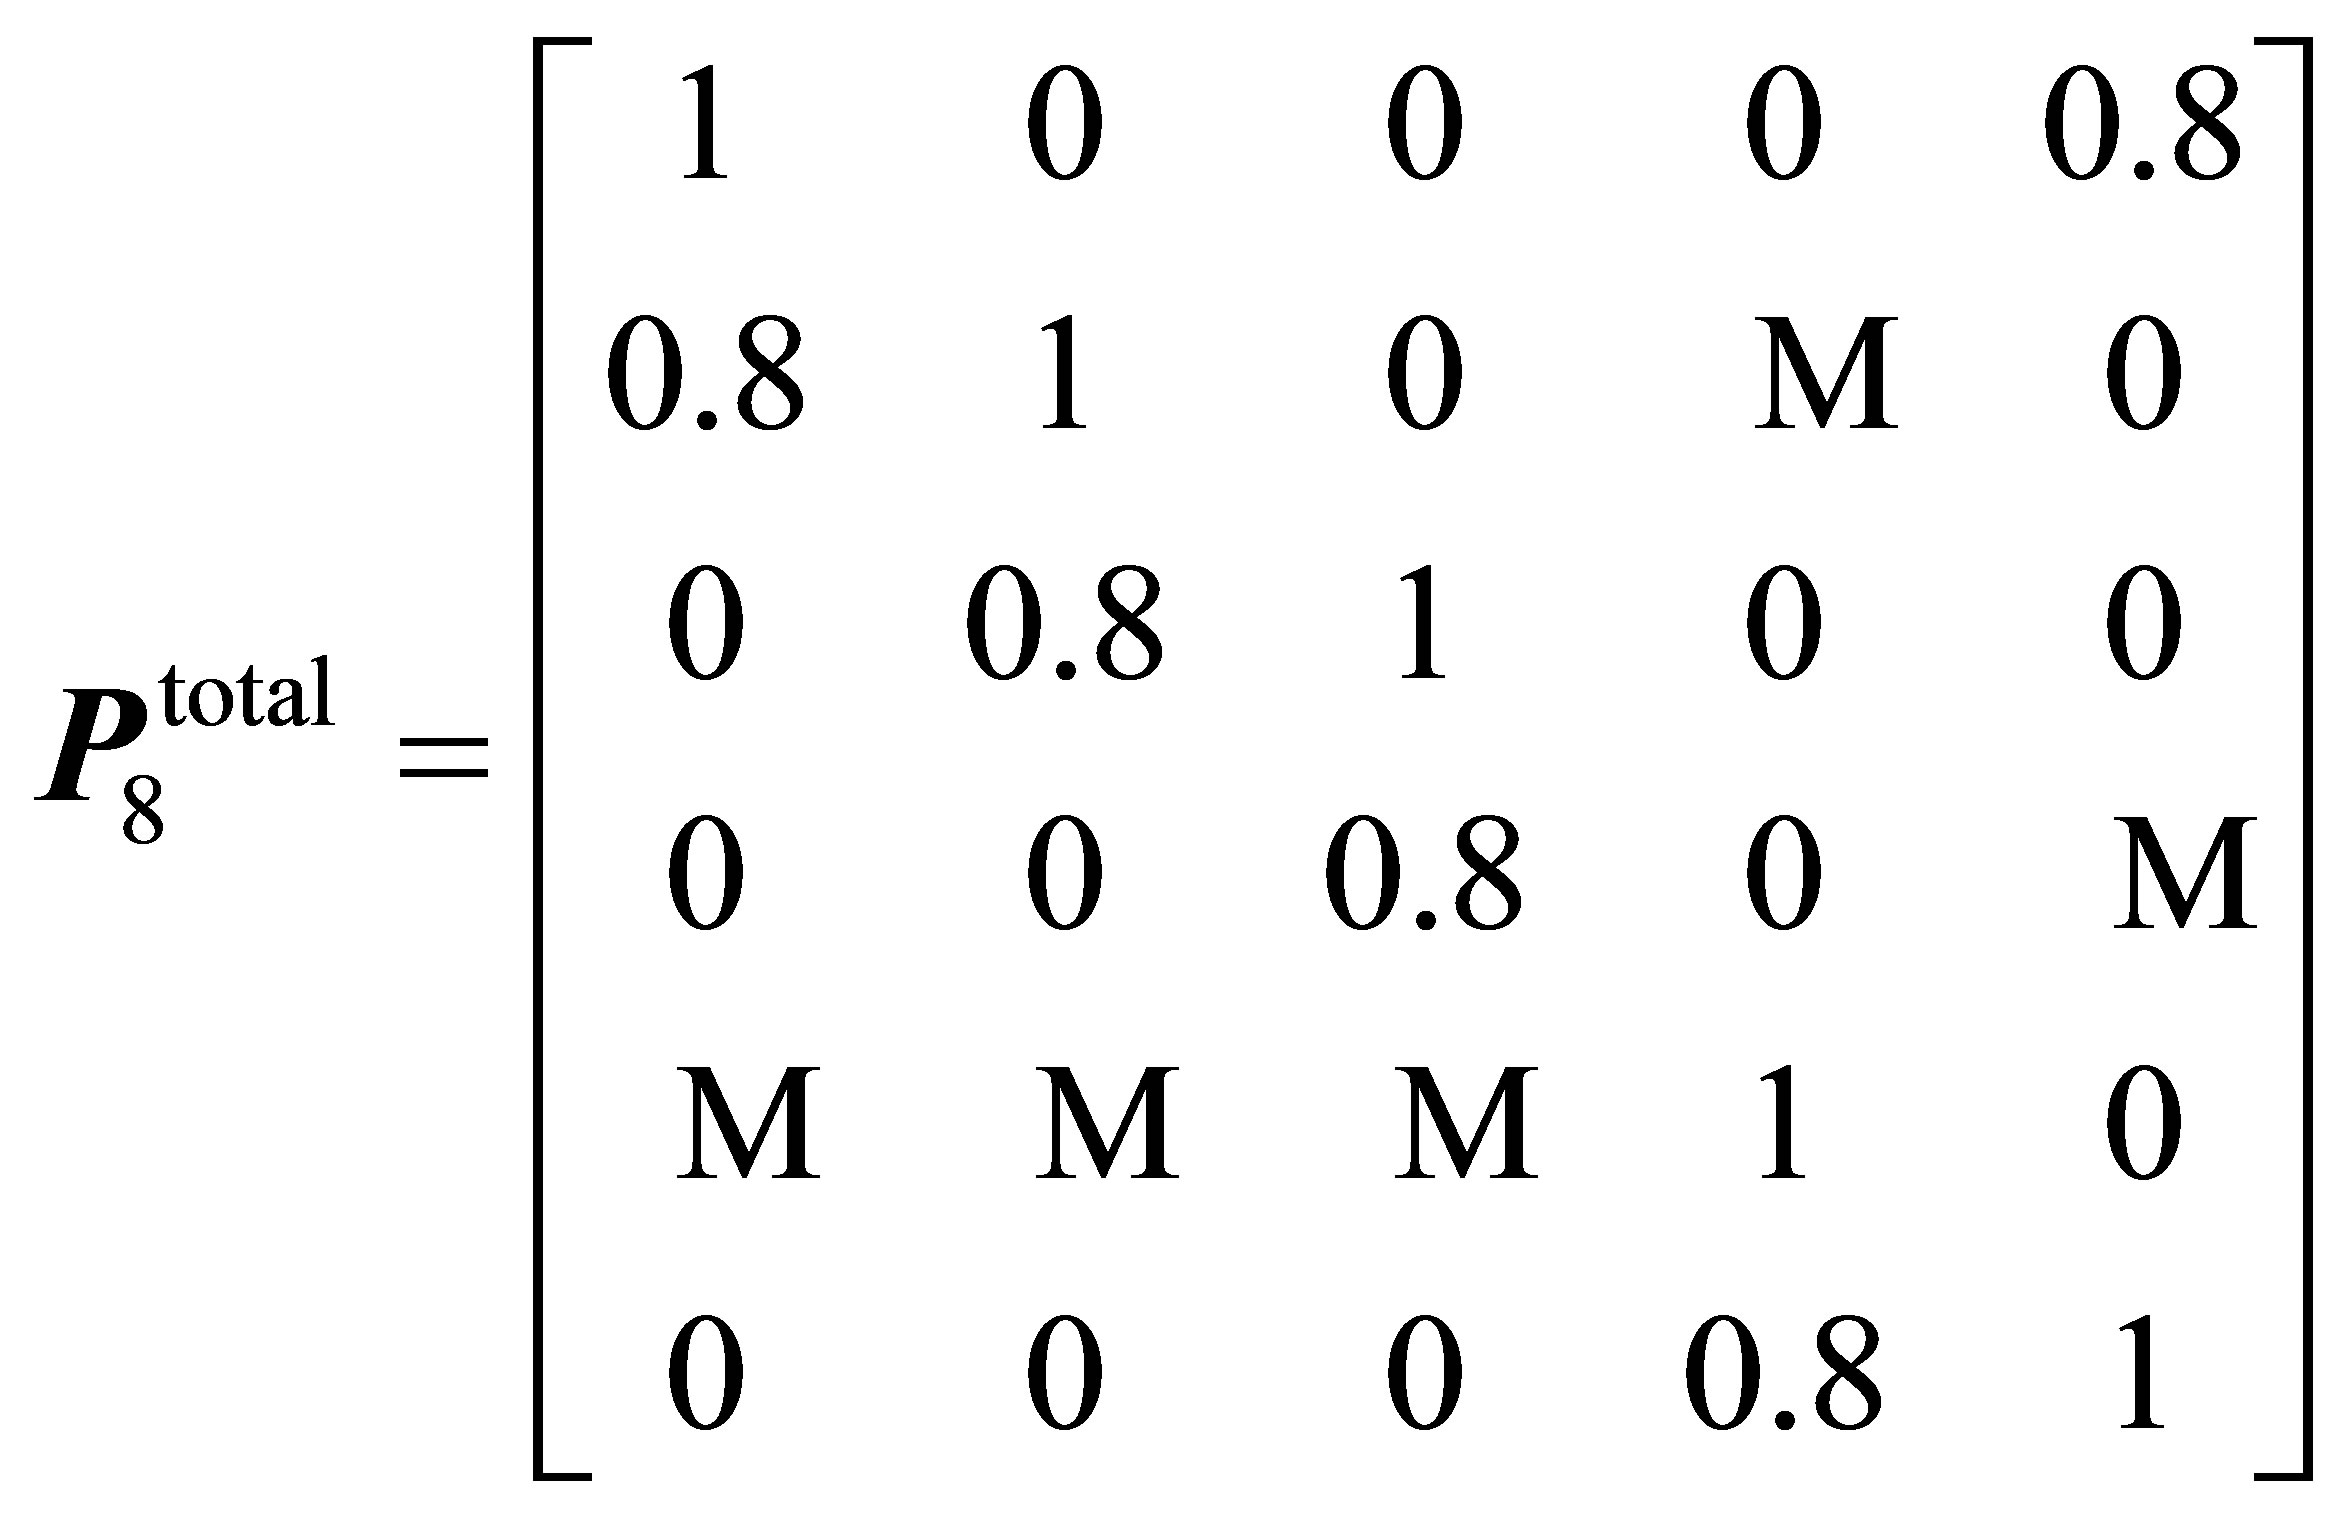 (24)
(24)
3.1. Simulation Results
Three power distribution curves are obtained from case study. The case study is modeled by minimizing peak power consumption problem (1)-(9) and minimizing electricity cost problem (10)-(19).
The 1st scenario: Figure 2 shows the lowest peak power consumption (PPC). This amount is equal to 2.127 kW which takes place at 9 pm. It can be observed that the load between 10 am to 8 pm is also smooth and almost equal to the peak.
By using Table 3, the monthly electricity cost is calculated as follows:
 (25)
(25)
 (26)
(26)
The 2nd scenario: Figure 3 shows the power distribution curves with the amount of PPC equal to 2.5 kW. The monthly electricity cost is obtained 62.199 USD. Solution of the model in this case has led to more fluctuations in the power. Particularly, it is seen that a considerable amount of the load is shifted to midnight hours, where the peak load is placed due to charging the vehicle and the operating pump.
The 3rd scenario: Figure 4 shows the power distribution curves when two objectives (minimizing peak and costs) are applied together. The monthly cost is 62.373 USD.
3.2. Analysis of the Results
For the 1st scenario, we claim that 2.127 kW is the lowest peak power consumption, but some other power distribution curves may exist with the same amount of this peak; i.e. the solution composition is not unique.
For the 2nd scenario, as a result, just by a slight increasing the lowest amount of peak power consumption (PPC = 2.127 kW) and fix the amount to the 2.5 kW, we can save 7% of electricity cost.
Finally, for the 3rd scenario, when the two objectives, including minimizing peak power consumption and
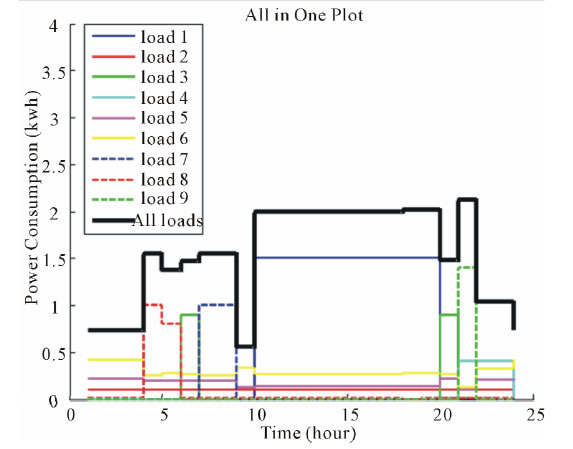
Figure 2. 1st scenario, power distribution diagrams for 9 loads.
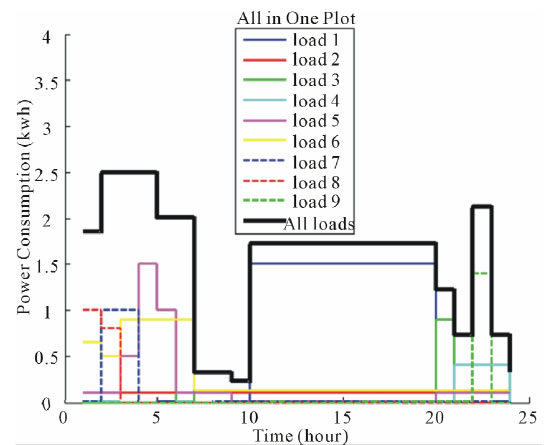
Figure 3. 2nd scenario, power distribution diagrams for 9 loads (PPC = 2.5 kW).
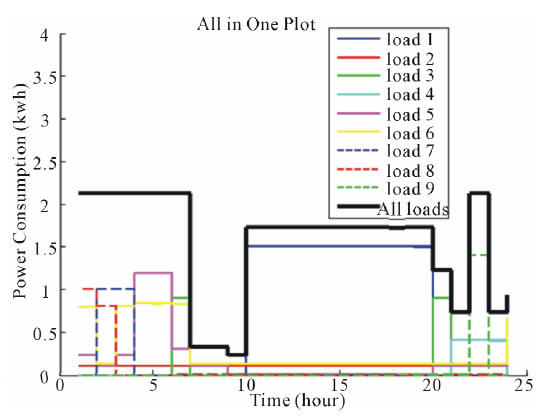
Figure 4. 3rd scenario, power distribution diagrams for 9 loads.
minimizing electricity cost are considered together; we get the best solution. In other words, without any increasing in the lowest peak power consumption, we can save 7% of electricity cost.
4. Conclusion
The comparison between the 3rd scenario with the 1st and the 2nd scenarios led to an important conclusion: the 3rd scenario satisfies the objective of the 1st scenario (minimizing peak power consumption) without increasing the lowest peak power consumption. Indeed, it can satisfy the objective of the 2nd scenario (minimizing electricity cost). In this paper, we have proposed two models for household loads to optimize energy consumption in the residential sector network. These proposed models with using the goal programming approach together can simultaneously minimize the peak load and electricity cost.
5. Acknowledgements
The authors would like to express sincere thanks to Iran National Science Foundation (INSF) and Department of Energy for their supports.