1. Introduction
The restoration aims to correct the distortions introduced during the acquisition or transmission of images. It tries to improve and to ameliorate the quality of the obtained image by reducing and eliminating the distortion. In order to well restore an image, it is necessary to explore the source of degradation in order to understand the main causes of image distortion. In this paper, we focus on restoring scintigraphic images.
Scintigraphic images are extensively used in nuclear medicine and are considered as an important indicator of the functionality of some organs despite their bad resolution [1]. Poisson noise is the overriding factor of degradations in scintigraphic images.
In the literature, there are different methods to denoise images corrupted with Poisson noise. In fact, we mention that several methods are chosen so the transformed random variables are Gaussian with unit variance.
These methods attain very high quality reconstruction results by using state-of-the-art denoising methods for the Gaussian noise model [2].
The degradations that an image undergoes are often stochastic [3]. Such degradations must be well studied. Thus, the modeling of the images acquisition process includes a precise simulation of physical phenomena and the instrumentation implied in this process. Modeling has an increasingly important role in medical imaging research and becomes an essential complement to theoretical, experimental and clinical studies. Therefore, this task is too expensive and too difficult [4].
In this work, we present the different steps of scintigraphic images acquisition in order to obtain a statistical model for planar scintigraphic images distortion. After this, a comparative study of many denoising multi-resolution methods is presented. In fact, many studies are concentrated in image denoising using wavelets transforms [1,6]. In short, all these studies perform at first the wavelet transform to the original image, and then apply some filters to the wavelet coefficients, and finally apply the inverse wavelet transform to obtain the denoised image [7].
Wavelet thresholding is a signal estimation technique that exploits the capabilities of the wavelet transform for signal denoising. It has been studied extensively owing to its effectiveness and simplicity. A great deal of the literature has been focused on developing the best uniform threshold or best basis selection.
Few years ago, a member of the representation family of multi-scale geometric transform emerged. It was called contourlet transform and was developed to overcome the limitations of the traditional multi-resolution common representation such as curvelets and wavelets transforms. Therefore, the contourlet transforms have been efficiently used in medical image denoising producing higher quality recovery of edges [9].
Another system of representation named rideglets pioneered in order to deal effectively with line singularities in 2D [9].
Recently, another bases are created, named “bandelet”, which is an orthogonal multi-scale transform. It can be interpreted as a warped wavelet basis [6].
2. Planar Scintigraphic Aquisition Chain Modeling
Scintigraphic image acquisition is assured using gamma camera, composed of:
2.1. The Collimator
It focuses on the different gamma sources onto the NaI crystal. This later detects the incoming gamma rays, and the Photomultiplier (PM) tubes and preamplifiers, with converting the light produced by the interaction of the gamma ray and the crystal into an electronic signal [10].
The basic principles of the Gamma Camera are closely related to the purpose of a radionuclide imaging which is to obtain an image of the distribution of a radioactively labeled substance within the body after it has been administered to the patient [11].
The collimator, which can be of different types, is closer to the imaged object and sets the acceptance angle for detection of the emitted gamma photons. The parallel-hole collimator is the most popular one and it consists of a lead plate with closely packed parallel holes, usually with hexagonal form. The lead “walls” between the holes are called septa. The hole diameter, collimator thickness and septal thickness depend on the resolution/sensitivity and the photon energy range for which the collimator is optimised. In most cases the hole diameter is a few millimetres, while the collimator thickness is a few centimeters [12].
To obtain an image with a gamma camera, it is necessary to project g-rays from the source distribution onto the camera detector. Gamma rays cannot be focused; thus, a “lens” principle similar to that used in photography cannot be applied. Therefore, most practical g-rays imaging systems employ the principle of absorptive collimation for image formation.
Four basic collimator types are used with the gamma camera: pinhole, parallel hole, diverging, and converging. Parallel-hole collimators are drilled or cast in lead or are shaped from lead foils. The lead walls between the holes are called collimator septa. Septal thickness is chosen to prevent g rays from crossing from one hole to the next.
The parallel-hole collimator projects a g-ray image of the same size as the source distribution onto the detector [10].
2.2. The Crystal
The detector material in the gamma camera is generally a NaI(Tl)-crystal. It is coated with a thin Al-layer at the front side and the edges to protect from outside light and moisture. The crystal is typically about 1 cm thick, which gives a high detection probability for photons with energies up to a few hundred keV. When a gamma photon interacts in the crystal, light photons are created, and the number of light photons is proportional to the energy deposited in the crystal. The rear side of the crystal is optically coupled to a light guide of glass, which protects the crystal and leads the light photons to an array of photomultiplier tubes, which are optically coupled to the light guide [12].
2.3. The C-PMs
The PM tube is an electronic instrument for generating an electrical pulse when interacting with a faint light. It is a vacuum tube containing a photocathode and a sequence of dynodes (10 to 12). The entrance of the tube is covered on the whole of its surface with a substance light emitting such as the CsSb which ejects electrons interacting with optical photons [13,14]. Each dynode is successively maintained at a high voltage. For each 3 - 10 optical photons reaching the photocathode, 1 to 3 photoelectrons are released. These electrons are accelerated towards the first dynode by a focusing grid, which release few secondary electrons. This electron multiplication is repeated until the electrons are captured by the anode with a multiplying factor of 106 to 107. The final amplitude of the pulses is proportional to the intensity of optical photons and then to the energy of the radiation deposited in the crystal.
An array of photomultiplier tubes; coupled optically to the back face of the crystal and arranged in a hexagonal pattern to maximize the area of the scintillation crystal.
Typical PM tube sizes are 5 cm diameter. A typical gamma camera has between 30 and 100 PM tubes which are encased in a thin magnetic shield to prevent changes in the gain due to changes in the orientation of the gamma camera relatively to the Earth’s magnetic field. The amount of light detected by a particular PM tube is inversely related to the lateral distance between the interaction site and the center of that PM tube [11].
2.4. Acquisition Chain Modeling
For noise modeling in planar scintigraphy, the scintigraphic image acquisition chain must be first described. Firstly, the patient receives the radiotracer dose and becomes then a gamma ray transmitter. These rays are transmitted through the body of their way back to the detector head gamma camera. They are then introduced into a collimator which absorbs an important part of the diffused rays (according to the size of the collimator holes and septas) and sometimes useful rays (Figure 1).
The interaction of a transmitted radiation with the scintillator crystal gives rise to optical photons. Then these photons will be applied to an array of photomultipliers (PMs). The signals at the output of different PMs will be digitized using an Analog-Digital Converter (DAC) and a calculation by weighting allows the location of the emission point of each gamma photon and consequently the image reconstruction (Figure 1).
To summarize, the noise will depend essentially on the output phase of the organism, collimation phase, scintillation phase and photo-multiplication phase.
In this modeling approach, the considered image is associated with a vector having N components where N is the number of pixels of the original image.
In nuclear imaging, we generally work with low emission levels. Thus, a g-ray source is modeled by a punctual and uniform process of Poisson.
This simplified model is inspired from the quantum nature of the gamma radiation. Subsequently, we adopt a constant exposure time (time required to complete an image acquisition) and this time is normalized to the unit value. So, if r represents the average number of emitted

Figure 1. Diagram of the chain of acquisition in scintigraphic planar.
photons, the probability of observing k photons at the unit time interval is given by:
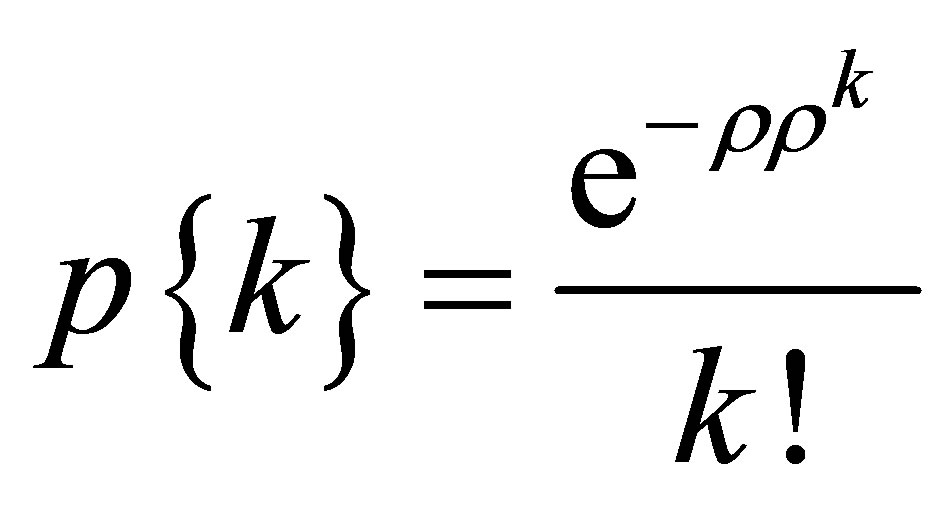 (1)
(1)
A planar scintigraphy with parallel hole collimator is considered. Knowing the quasi-isotropic nature of the gamma ray emission, we only consider the gamma photons that can transmit through the collimator and are likely to contribute to the reconstruction of the final image. In this case, we consider ds an elementary surface parallel to the collimator and located at the emitting structure and h the number of photons crossing ds during the exposure time. ds is considered as the surface of the pixel and h represents the measured at the pixel position.
Enumeration of h is uncertain because of the existence of a Poisson type noise (distinguished in the acquired image granular aspect). This noise is a random variable depending on the value h of each pixel. Knowing that h is a Poisson random variable with parameter r, then, h is characterized by an average equals to zero and a variance value r.
The original image formed before entering the collimator is described by the vector  (Figure 1). The value of the ith pixel
  is proportional to the number of photons passing through the region
  corresponding to the pixel. The
  photons passing across the tissues are attenuated depending on the thickness and the attenuation coefficient of the traversed structures.
Assuming  the probability that
  photons are transmitted across the body, among
  photons (transmitted by the emitting structure) is given by the binomial distribution with the parameter
 :
:
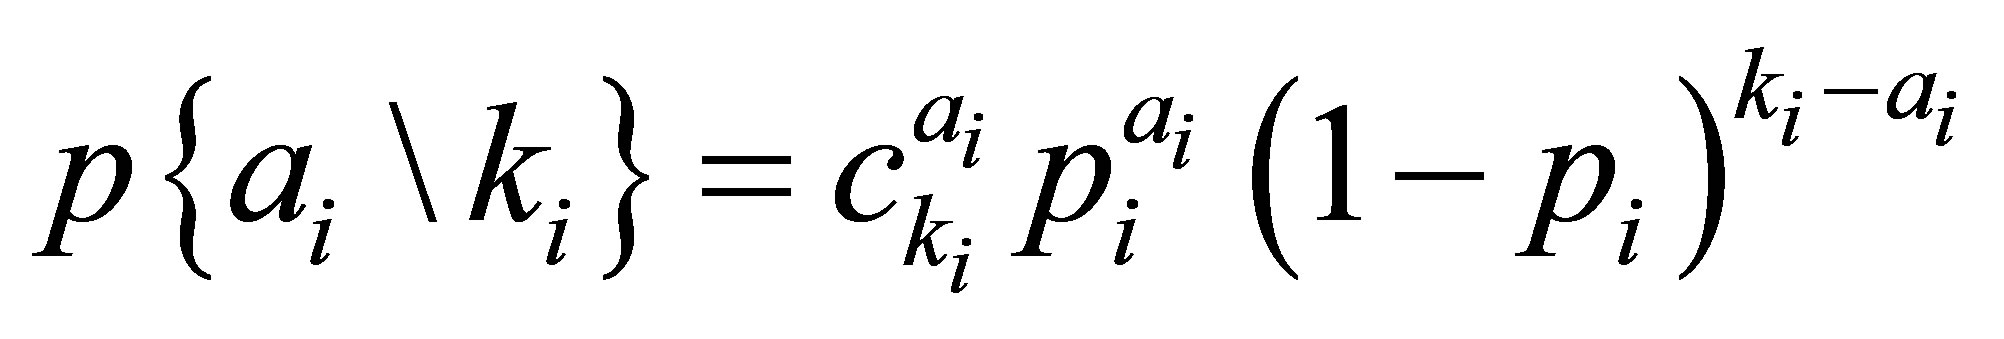 (2)
(2)
Therefore, the probability of observing  photons passing across the tissus is a random Poisson-type process of parameter
 :
:
 (3)
(3)
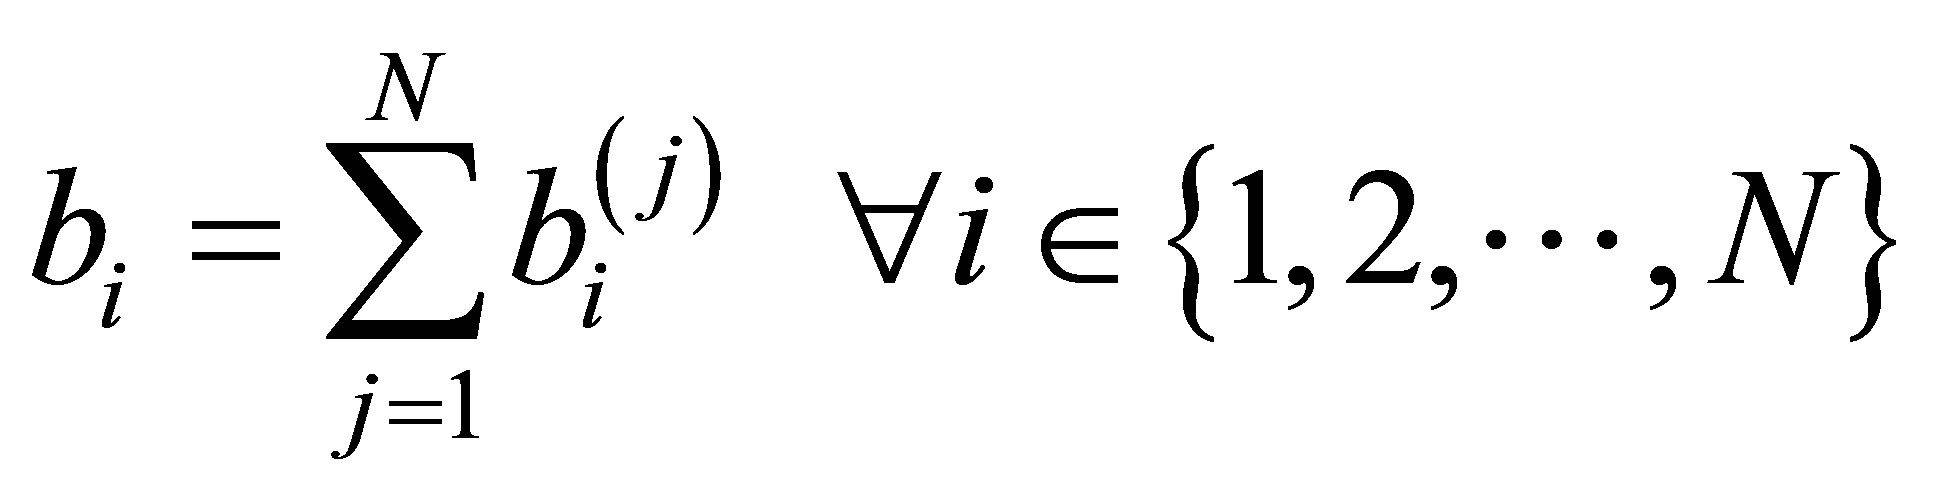
In this study, we assume the deserved image  has the Poisson-type as the only some of the degradation, and, the components
  (forming the image
 ) are statistically independent.
The image  is then transmitted through the collimator. Denote
  the image obtained at the output of the collimator (Figure 1) and
  is the average transmission coefficient given by:
 (4)
(4)
with S is the section of the collimator holes and  the surface of the septa. For a collimator low energy-high resolution, we have
 .
.
Using the same modeling formalism, the probability of having  photons at ith pixel follows a Poisson distribution with a parameter:
 (5)
(5)
The image  is then presented at the input of the scintillator crystal where the interaction of the gamma photons with NaI(Tl) gives rise to optical photon packets.
The interaction with the crystal depends on its thickness and its attenuation coefficient. The image describing the distribution of gamma photons interacting in the crystal “Figure 1” is denoted . If
. If  denotes the absorption coefficient of the scintillator crystal (around 90% for gamma rays of Tc99m traversing a crystal of NaI (Tl) of thickness 1.2” [15,16]), then, the probability of having
  photons at the ith pixel also a random process following a Poisson type with a parameter:
 (6)
(6)
The flux of g photons being converted into an optical photon flux, we denote  the vector associated with the image describing the distribution of visible photons at the output of scintillator crystal, where
  is the number of optical photons at ith pixel.
Notice that:
 (7)
(7)
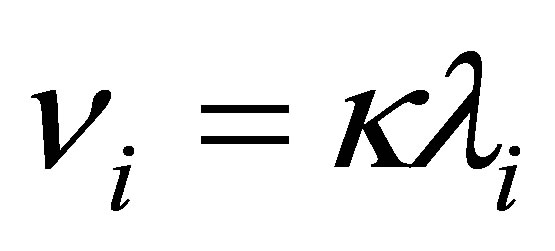
where  denotes the number of photons issued from the jth pixel of the image
  emitted under a certain angle making them landing on ith pixel of the image
 . Using the same previous formalism,
  follows also a Poisson distribution with parameter
  where
where  is called the coross-pixel parameter (
 is a random variable following a binomial distribution).
Therefore,  is also a Poisson process of parameter
  such that:
 (8)
(8)
This relation can be written in a matrix form as:

with
 (9)
(9)
The matrix H constitutes a characteristic representation of the scintillator crystal  represents the emission probability of scintillation photons in a given direction. Finally, the process of photomultilication allowing the electronic reading of the image
  although PMs attain the spatial resolution (size of the pixel of
  is lower in keeping with windows of entry of PMs) thing then us will not currently evoke. At the output of the planar scintigraphic acquisition chain, the considered image is in fact the image
  formed at the exit of the crystal scintillator.
Based on the hypothesis of independence of the  coefficients, we can consider that each pixel of the degraded image
  is modeled by the statistical Poisson process where the parameter is a linear combination of the original parameters
  .
.
The pulse output of the PM remains weak and needs a boost. The amplification in this case is also linear to preserve the relationship between the output pulse and the energy deposited in the crystal detector. The preamplifier circuit-amplifies the pulses of a few millivolts to a few volts [13].
The analyzer pulse is an electronic device which allows the counting of pulses within a certain amplitude domain. This selective counting saves only the radiation in a given energy range to eliminate background noise and the radiation released. This energy range is called window. It is centered on the electric photo peak.
The light received by each photomultiplier depends on the position relative to the emission point (for interaction Shelf g in the crystal). This amount of light is proportional to the solid angle of each PM “sees” the scintillation [5].
The current flowing out of each PM is proportional to the intensity of the light source and the solid angle under which the photocathode is viewed.
An analog computer combines the electrical pulses from different PM and thus determines the coordinates of the point of impact of a g photon [17].
For each photon, we calculate the seven nearest neighbors.
Thus, within the PM, the photons will activate m electrons (with m £ n), after multiplying, they give 106 m electrons. To obtain 7 pieces of information for the images 
Finally, all the algorithms of noise assessment in the images are based on the knowledge of the type of noise analysis. Thus we consider the problem of identifying the nature of the noise from the image observed to implement the algorithm processing or the analysis of the most appropriate image. Thus our study of the image acquisition chain allows us to infer that the model we have obtained is Poisson. But in the literature, they associate a Gaussian Model to Poisson noise. Thus the problem is to estimate the noise variance.
Now that we have explored various causes of degradation of a scintigraphic image, we propose to conduct a comparative study to select the best method to improve the quality of these images. To do this, we place ourselves in the context of a restoration where degradation is supposed to be only due to noise. It is then a filtering problem. Multiresolution methods have clearly marked the superiority over conventional methods. At this stage, we propose a comparative study to select the best method.
3. Denoising Using Multiscale Approach
During the previous decade, there was an abundant interest in the wavelet methods for noise removal in signals and images. In recent years, there is a new multiscale transform based on wavelet transform. A wavelet is a localization function of the mean equal zero. Its transforms always incorporate a result in a pyramidal representation and are computationally efficient.
In addition, wavelets transforms also allow an exact reconstitution of the original data thanks to sufficient condition in the progressive case when the wavelet transform is the wavelet coefficients which allow the reconstitution of the zero mean.
The reason behind being named as wavelet is that its functions are often wavelike but clipped to a finite domain [18].
Actually using the wavelet technique to treat and to overcome denoising problems proves its ability to satisfy the compromise between smoothing and conserving important features. The observed data are modeled as a signal embedded in noise. In cases where the noise is additive and Gaussian, the denoising problem becomes in the way to determine the optimal wavelet basis which concentrates the signal energy in a few number of coefficients and thresholds the noisy ones. But in other various experimental fields, especially those based on techniques where the detection includes a counting process, the data is modeled as a Poisson process. This is the case of scintigraphic images. Thus, many techniques were considered for the purpose of recovering the underlying intensity structure. Unlike the Gaussian noise, the Poisson noise depends on the image intensities. Consequently, the wavelet shrinkage is not as suitable for this context as the curvelet transform [9].
In fact adding to the wavelet, there are other frequency transforms which are widely used for denoising such as the curvelet. Just like the wavelet, the curvelet transform is a multiscale transform with frame elements indexed by scale and location parameters. But it has directional parameters and its pyramid includes elements with a very degree of directional specificity.
Morever, the curvelet transform is based on certain anisotropic scaling principle which is quite different from the isotropic scaling of wavelets. All of these features are extremely stimulating and helpful for the development of improved denoising algorithms [19].
In addition, the contourlet transforms constitute a relatively new family of frames that are designed to represent edges and other singularities.
The main idea behind curvelet is to represent a curve as a superposition of functions of various lengths and widths obeying the scaling law width ~ length2 [8].
It can sparsely characterize the high dimensional signals which have line, curve and hyperline singularities and the approximation efficiency is one magnitude order higher than wavelet transform [20]. In addition to the wavelet and the curvelet, we have the contourlet transform which appeared to overcome the limitations of the wavelets In addition to the wavelet and the curvelet, we have the contourlet transform which appeared to overcome the limitations of the wavelets. It proposed an efficient directional multiresolution image representation [18]. It has been developed by Do and Vetterli. The contourlet is based on an efficient 2D multiscale and directional filter that can deal effectively with images having smooth contours [21]. Therefore, it is able to capture contour and fine details in an image. Its approach starts with the discrete domain construction and then sparse expansion in the continuous domain [22]. In fact, contourlet transform can offer a sparse representation for piecewise smooth images [23].
It consists of two steps which are the subband decomposition and the directional transform. A Laplacian pyramid is first used to capture point discontinuity into a linear structure. The overall consequence is an image expansion using basic elements like contour segments, thus the term contourlet transform being coined [18].
Consequently, it was proved that the contourlets have elongated supports at various scales directions and aspect ratios. Therefore, contourlets are good at capturing directional features in images [21]. They have better performance in representing the image such as lines, edges, contours and curves than wavelets because of their directionality and anisotropy [18].
Another transform which has the same purpose as well as the curvelet and the contourlet is the ridgelet which was developed over several years to break the limitations of the wavelet transform [24].
To reach such a goal in higher dimensions, Candès and Donoho pioneered this new system of representation which deals effectively with line singularities in 2D. The idea is to map a line singularity into a point singularity using the Radon transform. Then, the ridgelet transforms can be used to effectively handle the point singularity in the Radon domain. Their initial proposal was interested for functions defined in the continuous R2 space. For practical applications, the development of discrete versions of the ridgelet transform that lead to algorithmic implementations is a challenging problem. Some article took the redundant approach in defining discrete Radon transforms that can lead to invertible discrete ridgelet transform with appealing properties [24].
Recently, the ridgelet transform has been successfully used to analyse digital images and applied in image denoising [25].
Finally, it is worth mentioning that it is important to know the geometrical structures of the images in order to exploit them because the geometry defines the changing zones and gives important tracks for human perception [26]. That’s why there are several transforms that tackle this matter such as the previously mentioned contourlet and this new one known as the bandelet transform. This latter is an orthogonal, multiscale transform able to preserve the geometric content of images and surfaces.
In fact, the orthogonal bandelets use an adaptative segmentation and a local geometric flow, which is wellswited to capture the anisotropic regularity of edge structures. They are constructed with a “bandeletization” which is a local orthogonal transformation applied to wavelet coefficients [22].
We note that the applications of which also have the potential in the bandelet transform in the image processing thanks to the photon-counting characters.
However, with all the obtained results of the previous mentioned techniques, the image denoising problem remains a great challenge demanding other techniques.
So, I will test the performance of all these methods, and the new section will present results.
To compare the performance of each of these transformations on images, we collect two types of image. The first is the phantom image of Hoffman is certainly the most commonly used in nuclear medicine and widely used for evaluating denoising methods. The second is a real scintigraphic image. These images were denoised using Wavelet (WT), Curvelet (CUT), Contourlet (CONT), Ridegelet (RT) and Bandelet transforms (BT).
To evaluate the obtained results, we used a set of objective and subjective criteria.
As an objective criterion, we use the PSNR, defined by:
 (10)
(10)
where MSE is the mean square error between the original and the denoised image with size I × J. The PSNR is calculated between the original image and the treated image.
Another criterion is the SSIM (Structural Similarity) which is the measure of similarity between two digital images. It was developed to measure the visual quality of a compressed image, compared to the original image. The SSIM measures the structural similarity between two images, rather than pixel by pixel.
Table 1 illustrates the denoising results of Hoffman image. The first step is to add noise to the Hoffman image. Then we compute and measure the PSNR of this same image using the wavelet, curvelet contourlet, ridigelet and bandelet domains.
In Figure 2, we show the recovered images after denoising with sigma = 10.
We compute the SSIM to the Hoffman image in Table 2.
Finally, we present in Figure 3, the results obtained in a real scintigraphic image.
After applying wavelet, curvelet, contourlet, ridgelet and bandelet transform to the Hoffman image, we compared the different obtained results. Moreover, the visual quality of various directional texture region of Hoffman image is also important and show that bandelet transform gives better visual quality result image.
I have seen almost the same results for the scintigraphic image. In fact I’ve worked on several images but I’ve presented a single sample: scintigraphy in small animals.
So we can conclude that the bandelet approach boosts the PSNR value and helps obtaining high visual quality result images.
4. Conclusion
We have presented the acquisition chain in planar scintigraphy, which takes into account the Poisson noise and its non-stationary. This prompted to address the problem of restoration of the scintigraphic image under a theoretical aspect, for which we have adopted the Poisson

Table 1. PSNR values of denoising for Hoffman image.
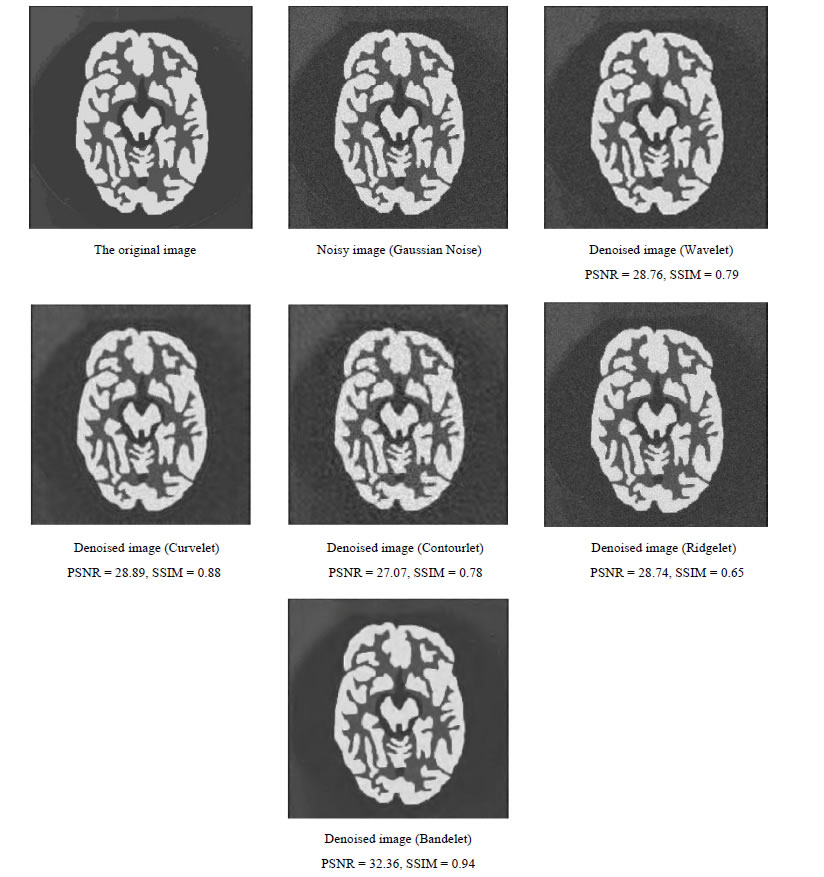
Figure 2. Denoising of Hoffman Image with gaussain noise.
model at various stages of construction of the image in planar scintigraphy.
For the comparative study of multi-resolution methods to reduce noise in scintigraphic images, we can assure that the bandelet transform outperforms the wavelet, the curvelet, the contourlet and the ridgelet transform. It can provide high PSNR values and remove the Gaussian noise from images with the best degree of efficiency. The performance of the denoising algorithm using the bande let transform also performs well even in the cases where we have images with very high frequencies.
For the results obtained on the real images, such as the scintigraphic image of small animals, we can confirm that the images with best qualification were always those processed with the bandelet transform.
For the choice of threshold, we applied the Donoho threshold. But it would be interesting to test adaptive thresholds. Indeed, the interest of a suitable base is that

Table 2. SSIM values of denoising for Hoffman Image.
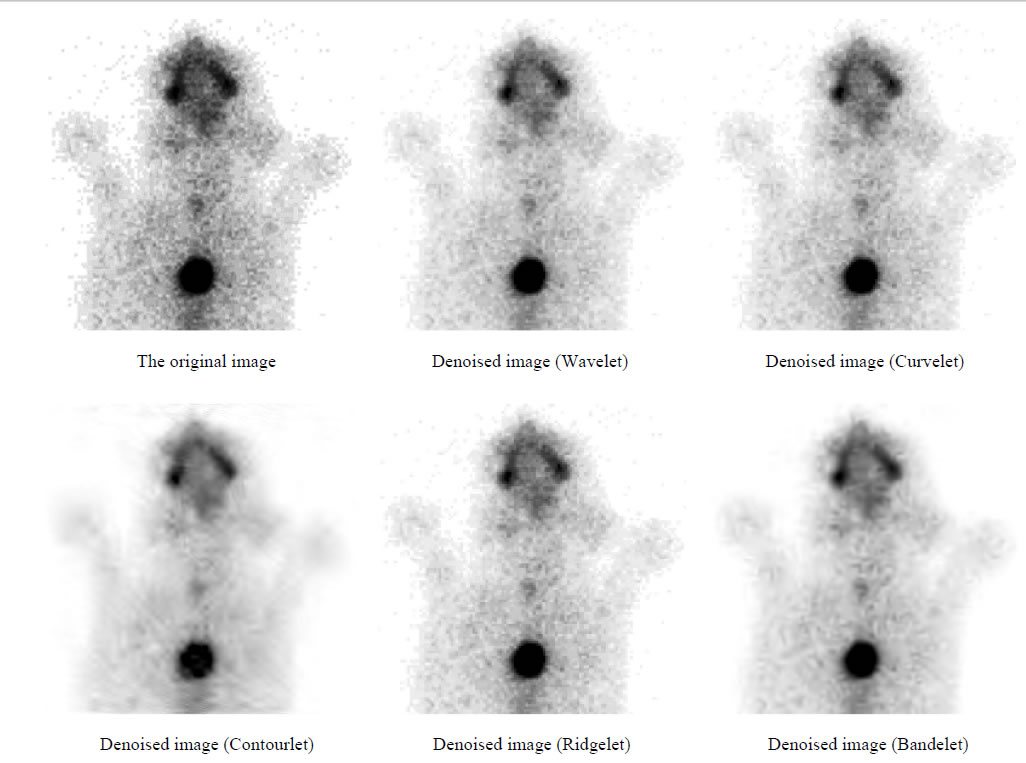
Figure 3. Denoising of scintigraphic image real.
the vectors are chosen according to the considered signal. For a noisy signal, the adapted basis vectors are more suitable to correlate the noise.