1. Introduction
For many types of studies involving rainfall, such as flood control works and irrigation works, among others, rainfall trends are typically described by the use of depth-duration estimates [1,2]. Such a depth-duration analysis is typically used to estimate rare return period (or return frequency) depths of rainfall for various time durations.
In the current paper, the focus is on depth-duration estimates of rainfall infiltration into soils. A conceptual model that describes infiltration is selected, given rainfall and soil properties, where it is assumed that the soil can infiltrate the rainfall quantities under consideration (e.g., the soil is free draining and not encumbered by perched groundwater or other such interferences to infiltration). The resulting estimates of infiltration can be analyzed in developing depth-duration estimates of rainfall infiltration analogous to the procedures applied to rainfall data alone. Probability distributions can be considered and fitted to the synthesized depth-duration estimates, enabling estimates of rare depth-duration outcomes of rainfall infiltration.
In this paper, the focus is developing a statistical procedure that may be useful in describing the occurrence of earth movement events such as landslides and mud floods (among others) and to describe such outcomes in terms of the often used concept of return frequency, as is used in flood control engineering design and planning. This paper does not examine the details of landslide initiation (including transient soil water pore pressures and water content variations in time, among other related factors) which are examined in the literature [3]. Instead, if it is known that a certain quantity of infiltrated rainfall over a particular duration of time typically results in an earth movement event at a given location, then it is logical that an even larger quantity of infiltrated rainfall over the same duration of time should result in a higher probability of such an earth movement event or possibly a greater magnitude of the outcome. The “rainfall threshold” concept [4-6] embodies this idea and is well established in the literature. This paper extends the return frequency description of the rainfall threshold concept to rainfall infiltration [6].
Several rain gages were analyzed in the State of California for the purpose of accomplishing the analysis described above. The rain gages selected are located close to the locations of target earth movement events. Because a long history of rainfall data is needed to estimate a long history of rainfall infiltration, daily rain gages were used for the estimation of daily infiltration. The rainfalls assembled were daily rainfall values collected over time periods of several decades. Those data were then organized into all the rainfall depth-duration outcomes, namely, 1-day, 2-day, 3-day, and so forth, out to the entire water year (multiple years of depth-duration outcomes can be considered analogously). For each duration, the maximum value is selected for each year, resulting in the annual outcome for each year. The various annual outcomes, for each duration, are ranked in size, and plotted on various types of probability paper in order to assess an underlying probability distribution. For the current analysis, and for the selected analogs used to estimate infiltration quantities, the probability distribution considered was the standard normal distribution or the log-normal distribution. Using the standard normal distribution as the adopted underlying distribution, occasions of earth movements under study can be correlated to the return frequency of the infiltration corresponding to the subject earth movement.
It should be noted that severe rainfalls do not necessarily infiltrate into the ground to become causal to an earth movement event, but instead may run off the land surface to cause flooding events. Furthermore, the arrangement and timing of a large quantity of rainfall distributed over a multiple-day depth-duration typically results in significantly different amounts of rainfall infiltration. High intense portions of rainfall tend to result in a larger proportion of the rainfall runoff whereas a low intensity rainfall tends to become infiltrated rainfall. Consequently, the above described infiltration depthduration analysis may better explain the occurrence of an earth movement event than provided by rainfall alone, and may be useful in assessing risk of future earth movement occurrences. By using the above described procedure for estimating return frequencies of rainfall infiltration, plots of return frequency versus duration size can be prepared for the estimated depth-duration infiltration quantities analogous to the plot of return frequency versus depthduration rainfall quantities.
It is contemplated that from the presented analysis, risk assessment of engineering and geotechnical works can be considered with respect to return frequency of rainfall infiltration (or even assessment of impacts from added infiltration water such as landscape irrigation, leakage from utility pipes and reservoirs, among other such types of added water). A possible procedure to perform such a risk assessment may adopt a desired return frequency of risk, such as 100-year (as used in FEMA floodplain designation), or other return frequency. The implementation of a prescribed return frequency of rainfall infiltration as a design consideration throughout a region may provide the total population with a balanced risk reduction to earth movement events analogous to flood risk reduction approaches. An assessment can then be made of the engineering or geotechnical work, for each depth-duration of infiltration estimate from 1-day through one water year, or longer if necessary in order to capture infiltration effects of long duration. This analysis approach may also be used as another tool in assessing risk for earth movement events, such as landslides, mud floods, debris flows, and other such outcomes that are substantially caused by infiltration of water.
2. Rain Gage Data Considered
Several rain gages were examined as part of this study. Four of the rain gages studied have locations close to landslide or mud flood events under study, and therefore the opportunity to assess the return frequency of the associated rainfalls as well as infiltrations was available. Table 1 provides relevant information about the rain gages, as well as the distance from the considered earth movement events to the closest rain gages.
3. Daily Infiltration Estimation Approach
There are many conceptual models and mathematical models that may be used to estimate rainfall infiltration into the soil, given rainfall data and properties of the soil [7-10]. For most situations of interest, rainfall impacts the soil and undergoes several near-surface interactions including storage, evapo-transpiration (ET), and ponding of rainfall on the soil surface along with the wetting of vegetation and objects (sometimes referred to as initial abstraction, or Ia). The rainfall that survives these near surface interactions percolates into the soil and then moves downwards and laterally as described by mathematical models such as the well-known Richards equation or other similar mathematical formulations [11]. Interferences to soil water movement include soil properties of hydraulic conductivity, water content versus soil water pore pressure corresponding to the properties of the soil itself, conditions of perched groundwater, and saturated conditions of the soil typically associated with soils that are not “free draining”. In this paper, the soils considered and related interferences to soil water movement are assumed to correspond to “free draining” soils. For example, if the soil is surrounded by relatively impermeable layers of soil or impermeable faults, then continuous infiltration of water may be impeded and the soil is not “free draining”. The analysis approach assumes a free draining soil sufficient to apply the assumption that the estimated annual depth-duration infiltration outcomes are mutually independent. (It is noted that in some earth movement phenomena, such as mud flows or mud slides, there may be significant amounts of clay or other such soils that exhibit some amount of cohesion, resulting in timing delays between the causal infiltrated rainfall and the earth movement itself. Furthermore, many types of earth movement phenomenon, particularly landslides, involve the accumulation of soil water resulting in increased pore
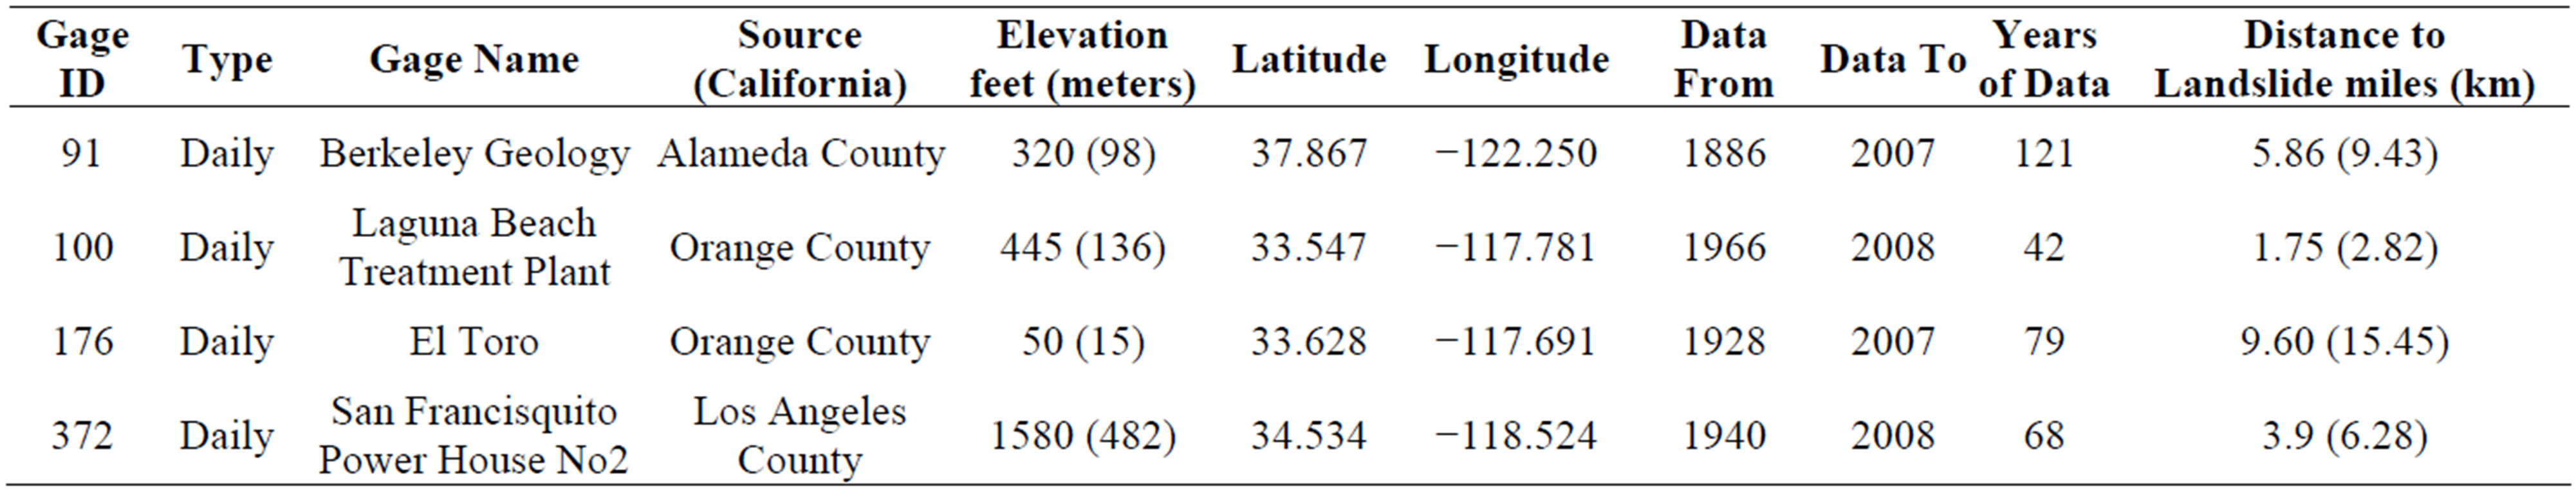
Table 1. Rain gages examined in study.
pressures, which also takes time for the infiltrated rainfall to migrate towards such areas of soil water accumulation. These delays in timing between the causal infiltrated rainfall and the occurrence of the earth movement may be assessed using standard soil water modeling techniques. However, the association of the causal rainfall infiltration, its depth-duration and return frequency, still typically applies to the earth movement outcome.) Again, the procedures described herein are proposed as an extension of the rainfall threshold approach.
The National Resources Conservation Service (NRCS; previously known as the Soil Conservation Service, or SCS) continues to develop and support use of a rainfallrunoff modeling approach typically known as the Curve Number approach (or CN method), as is described in several publications including the National Engineering Handbook [12]. The CN approach has been the subject of numerous research publications, including [13], among others. Due to the continued and widespread use in civil engineering and irrigation studies throughout the United States (and the world), the CN approach is utilized in this paper to estimate daily runoff values. Furthermore, since daily rainfall data are available, a procedure to estimate evapotranspiration (ET) is also used.
4. Description of NRCS Rainfall-Runoff CN Method
The NRCS’s CN approach provides estimates of daily runoff given daily rainfall and a descriptive CN value for the situation under study. The effects of prior rainfalls is considered through the Antecedent Runoff Condition (ARC) which results in an adjustment to the selected CN of the situation such that a high ARC results in a higher CN value for the target day and a lower ARC results in a lower CN value for the target day, causing an increase or decrease in daily runoff, respectively. Details of the ARC modification procedure can be found in the National Engineering Handbook [12]. For a given situation under study, a CN value is selected from a tabulation of CN descriptions prepared by the NRCS after years of experimental plot measurements of the rainfall-runoff process.
The CN approach works upon values for daily rainfall and a selected watershed curve number (CN) value (between 1 and 100) that is associated with the watershed under study. The CN approach estimates initial abstraction, Ia, by
 (1a)
(1a)
where S is a storage parameter defined by
 (1b)
(1b)
and daily runoff, Q, is estimated by
 . (1c)
5. Estimation of Daily Rainfall Infiltration
The mathematical analog considered in this paper for estimating rainfall infiltration is
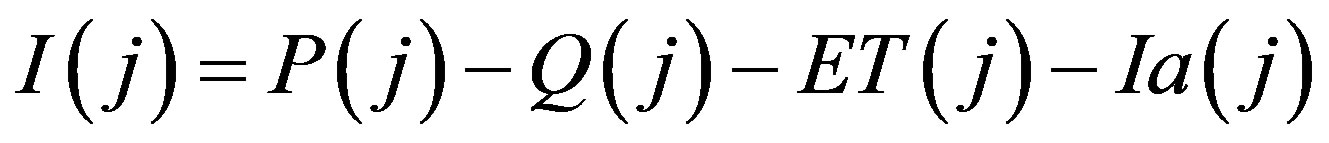 (2)
(2)
where:
I(i) = infiltration estimate for day j;
P(j) = rainfall for day j, available from daily rain gage data;
Q(j) = runoff for day j, estimated using the NRCS approach for the specified CN value and ARC;
ET(j) = evapo-transpiration for day j; and Ia(j) = initial abstraction for day j, estimated from the NRCS approach for the specified CN value and ARC.
The CN adjustment procedure for a particular daily rainfall is to adjust the CN value based on the prior five day rainfall values, according to the well-known NRCS procedure for including antecedent rainfall conditions. Adjustments of CN values follow the prescribed NRCS procedure. For durations greater than five days, if rainfall is continuous, wet antecedent conditions are typically assumed. Similarly, if the preceding five days are dry, then the CN values are lowered as described in the NRCS procedure. Because the CN procedure does not track evapo-transpiration between storm events and during storm events, a local ET procedure is used. In the current paper, data from the California Irrigation Management Information System (CIMIS) is used to provide the necessary ET(j) daily values (from average monthly records), as measured at nearby CIMIS gaging stations. (Information about CIMIS, CIMIS gaging stations, and relevant information available, can be found at http://wwwcimis.water.ca.gov/cimis/welcome.jsp). Finally, daily estimates of initial abstraction are based upon the NRCS procedure.
The computation of daily infiltration estimates from Equation (2) can be accomplished on a standard spreadsheet computer program (such as the one used in the current work) using daily rainfall data and ET data available from sources such as the web or subsequent publications. Once daily infiltration is estimated for the entire history of daily rainfall data from the rain gage, the resulting history of daily infiltration can be analyzed for underlying trends and statistical attributes on a depthduration basis analogous to depth-duration analysis of rainfall alone.
6. Depth-Duration Analysis of Infiltration
The above sections describe the procedure used in this paper to develop a continuous history of daily rainfall infiltration estimates, given a history of continuous daily rainfall data and selected procedures for estimating daily rainfall infiltration. The resulting daily rainfall infiltration estimates may be subdivided into appropriate rainfall water years (such as October through September of the following year). Next, the maximum value for each duration (i.e., the “annual outcome”) is determined, for each water year, of 1-day through the entire water year (e.g., 365-day). For N water years of data, there will be a set of N annual outcomes, one such set for each of the various duration sizes. For each duration, the set of N annual outcomes are ranked by magnitude, and the usual statistical percentiles (e.g., such as the 50-, 80-, 90-, 95-, 96-, 98- 99-, and higher percentiles) are computed as well as the statistical mean, standard deviation and skew. Because annual outcomes of depth-duration daily rainfalls are used, and because the presented overall procedure assumes free draining infiltration without interference from accumulating soil water in the depths of soil under study (such as from perched groundwater or deep groundwater conditions, among other factors), it is assumed that the selected set of such annual outcomes are mutually independent outcomes from a random variable (as is assumed in the analysis of rainfall alone). It is noted that although it is assumed that annual outcomes are mutually independent (that is, outcomes of a target year are independent of outcomes from a different year, which is an assumption employed for the statistical analysis of most rainfall events as well as many types of runoff events), there may be considerable correlation and mutual dependence between various depth-duration infiltration outcomes. For example, an 8-day duration event may also contain the 1-, 2-, 3-, 4-, ··· 7-day duration events. Consequently, as a rough guideline, the 50th percentile of the selected set of outcomes would approximate the 2-year return frequency value of daily rainfall infiltration corresponding to the duration selected. The 99-percentile would approximate the corresponding 100-year return frequency value. Depending on the underlying probability distribution assumed, estimates can be made of the return frequency values of durations of rainfall infiltration.
7. Distribution of Rainfall Infiltration Estimates
At each gage considered in this study, three approaches for estimating rainfall infiltration are considered:
1) Rainfall less Runoff (P-Q), where runoff is calculated using the NRCS Curve Number method with variable ARC2) Rainfall less Runoff less Evapo-Transpiration (P-QET), using average monthly ET values from the most relevant CIMIS gage, and 3) Rainfall less Runoff less Evapo-Transpiration less Initial Abstraction (P-Q-ET-Ia), where Ia is calculated via the NRCS Curve Number method.
It is noted that for each location, the appropriate soil group was determined using NRCS Soil Survey maps, and a CN of 70 for AMC II was used. The published California State Department of Water Resources (DWR) rainfall depth-durations are from the set of peak daily duration intervals, N = {1, 2, 3, 4, 5, 6, 8, 10, 15, 20, 30, 60, 365}, and a representative subset of these, i.e. {1, 4, 8, 20, 30, 60, 365}, are further examined. Data for the above three infiltration approximations are ranked according to their respective durations, and the Normal Order Statistical Medians, M, are calculated for each data set as follows:
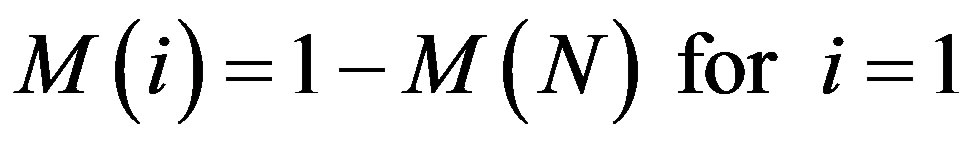 (3a)
(3a)
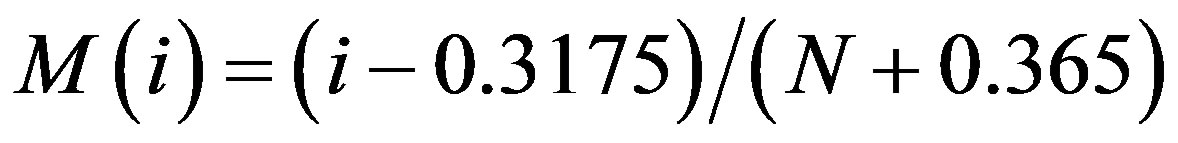
 (3b)
(3b)
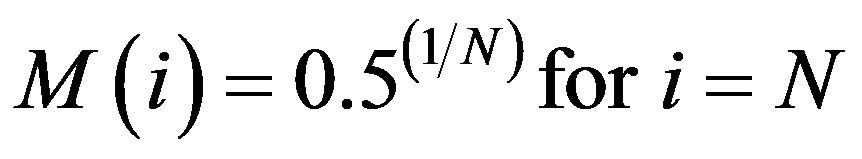 (3c)
(3c)
where “i” is annual event i.
(See http://www.itl.nist.gov/div898/handbook/eda/section3/ normprpl.htm, among others).
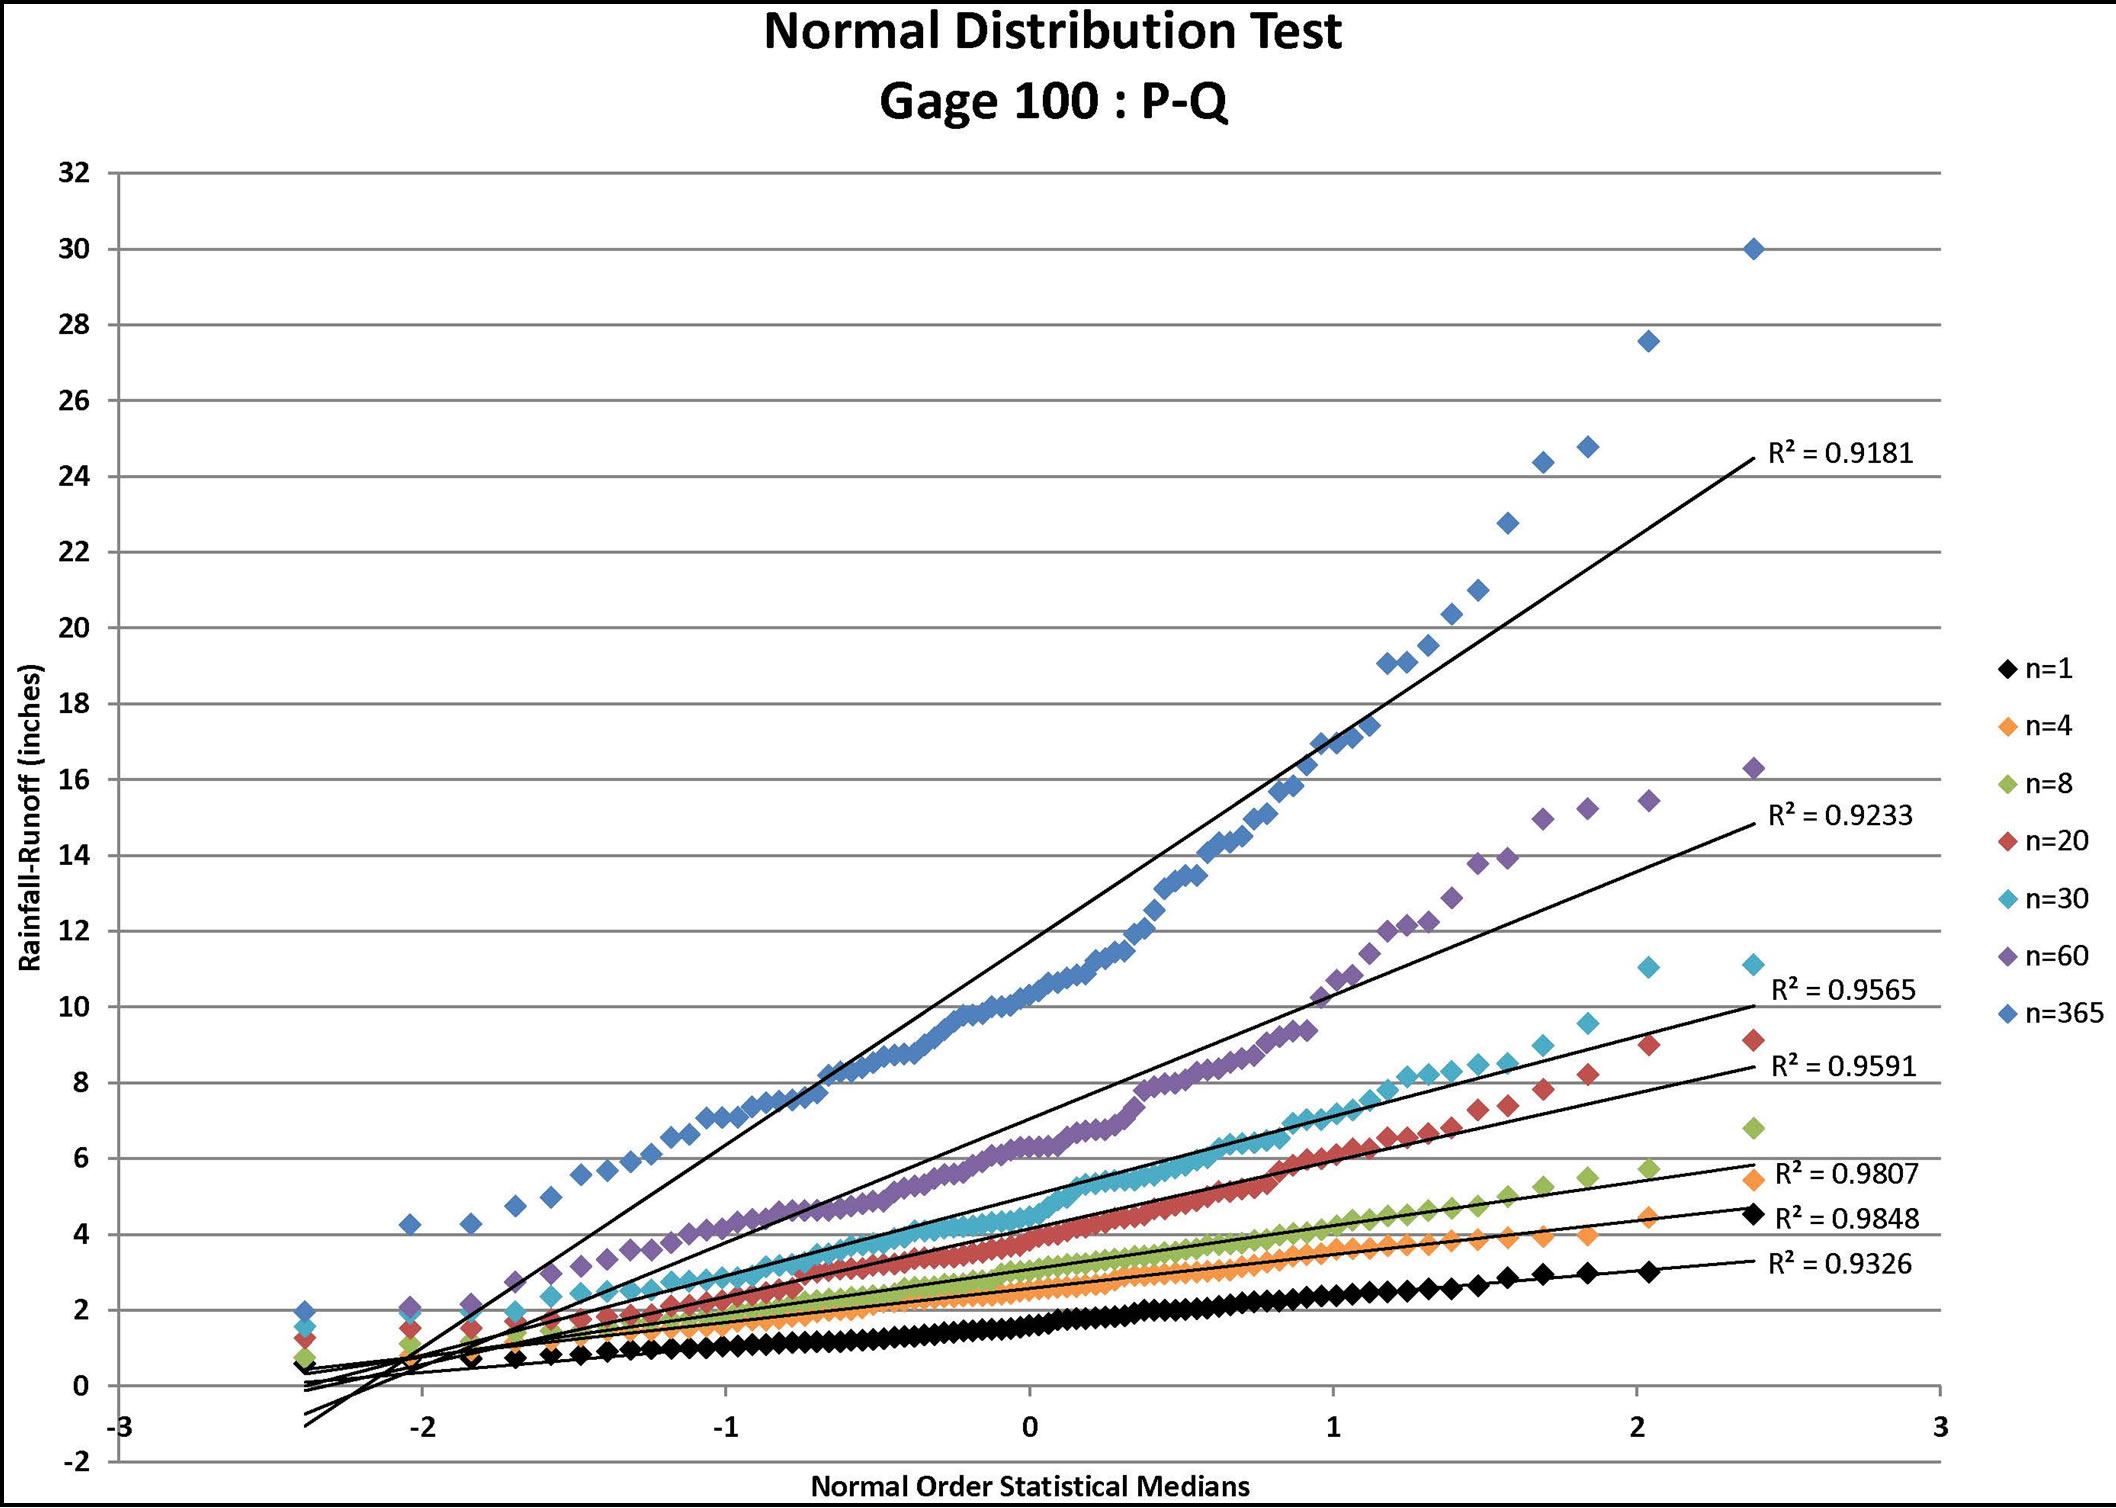
Each infiltration estimate is then graphed versus its corresponding Normal Order Statistical Medians and the graphs were inspected for linearity. In such a graph, a normally distributed set of data will exhibit linear behavior. For example, the results for Gage 91 are shown for all three infiltration estimates in Figure 1 (P-Q), Figure 2 (P-Q-ET), and Figure 3 (P-Q-ET-Ia). (Similarly, Figures 4-6 show infiltration estimates from the other gage sites considered.) This process was repeated using log10 of each data point in order to determine if the distribution is Log Normal. Each resulting plot was given a Line of Best Fit and the R2 value calculated. The R2 values are summarized in Table 2. From Table 2, although the R2 values are similar with respect to the two presented distribution
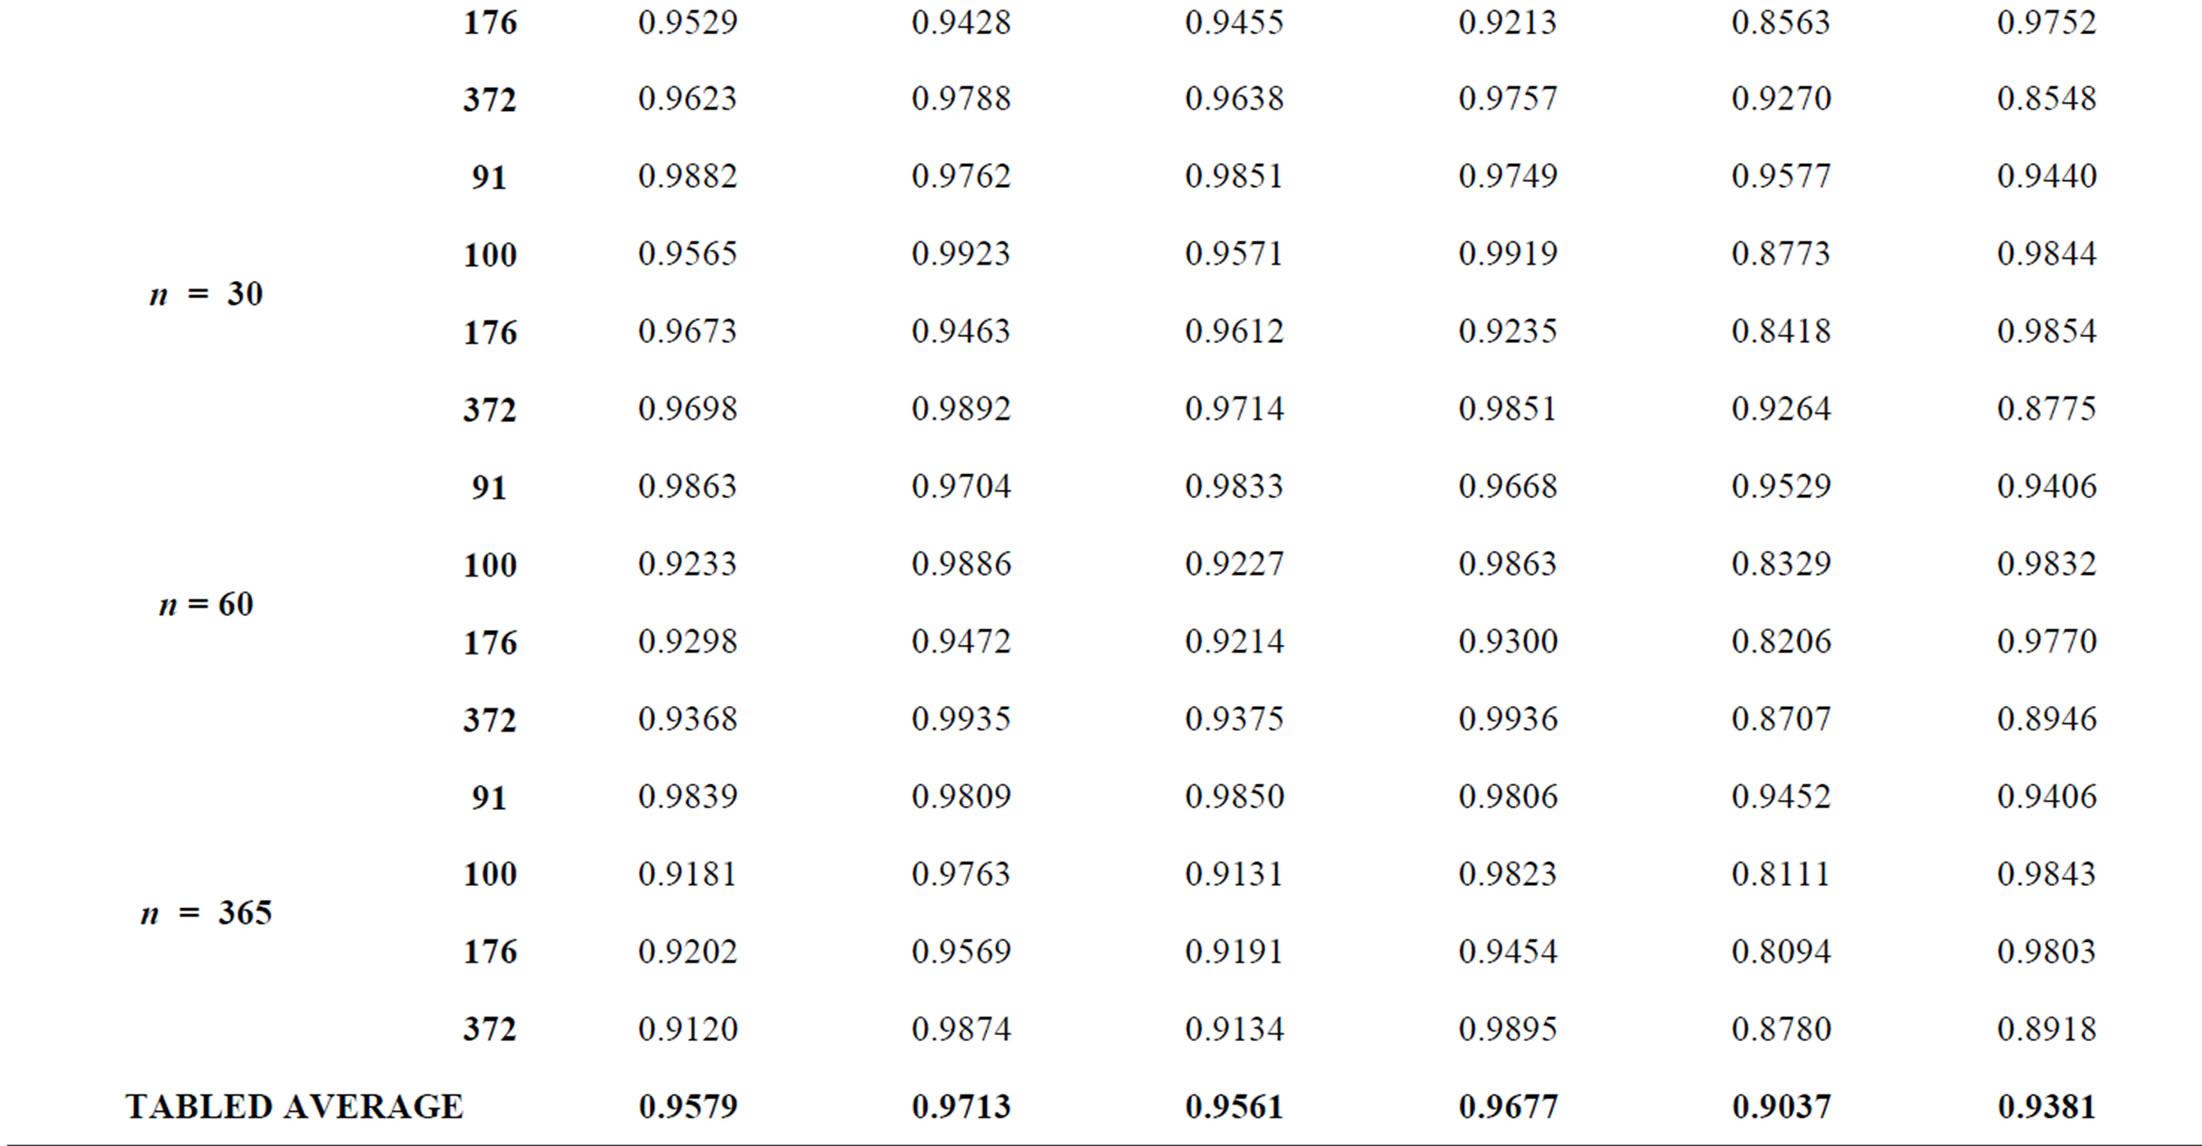
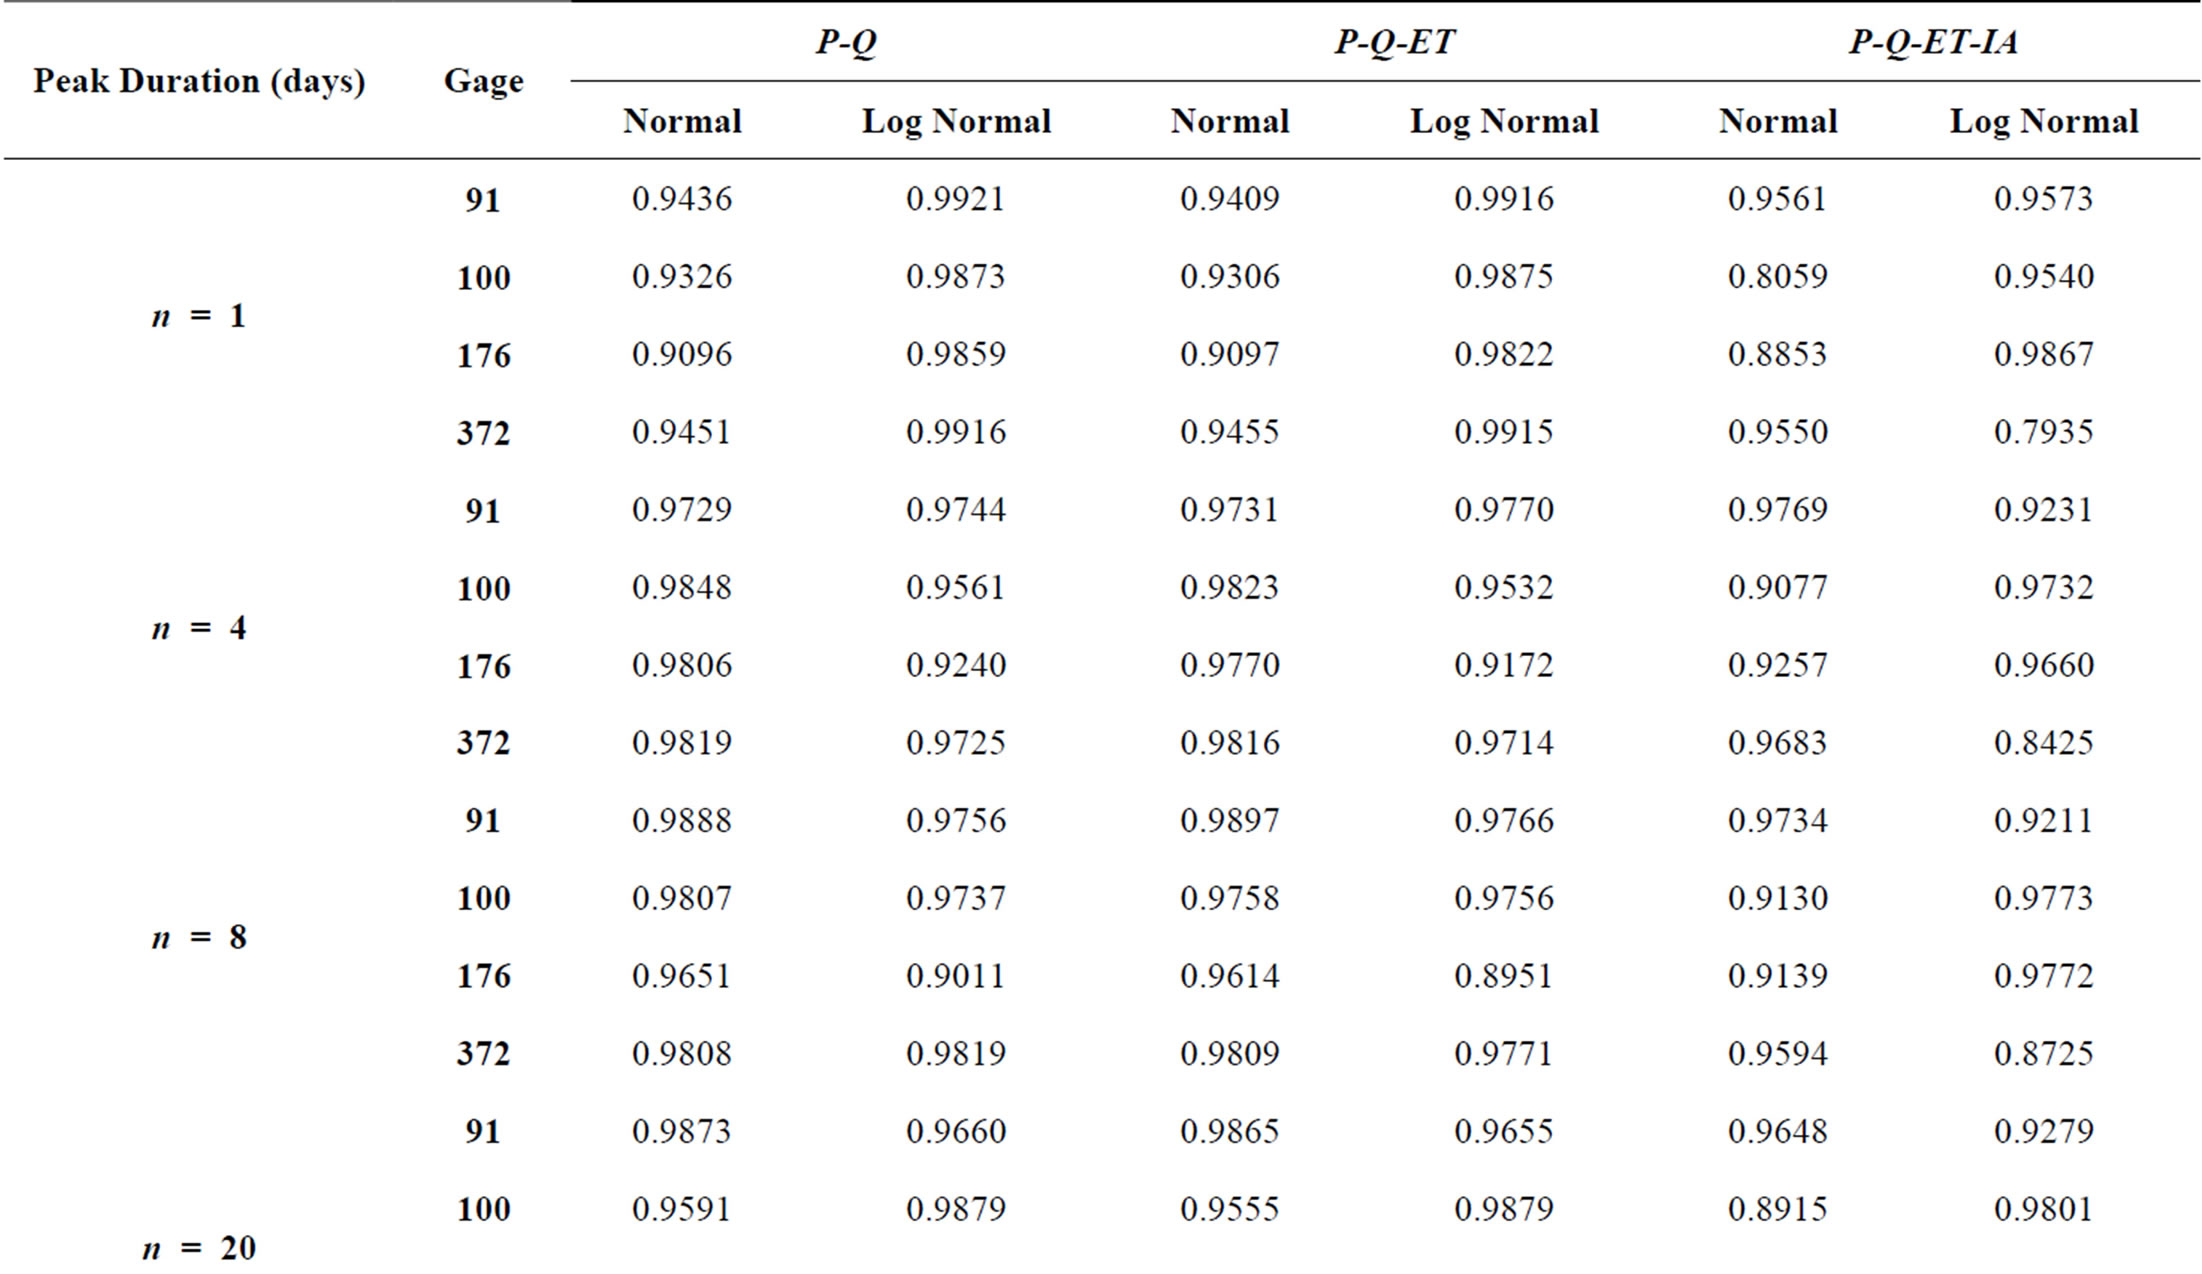
Table 2. R2 Values from normal distribution and log normal distribution test plots.
candidates, visual inspection may be needed in assessing goodness of fit of the data to generalized regression curves. For some soils and conditions, the infiltration estimates may be improved for wet conditions in the soil by including a soil-moisture tracking method. Other models for infiltration may also be considered as well as soil-moisture accounting methods. In the current paper, the soil is assumed to be sufficiently “free draining” such that the CN approach is adequate for estimating infiltration quantities. Probability distribution assessment may be needed on a regular basis in order to refine estimates of rare return frequency levels (e.g., usually 100-year or rarer; or extrapolations based on a questionable record or short record length, among other issues) when additional data are collected.
The choice of the probability distribution function used
Figure 1. Normal distribution test for Gage 91: P-Q where P = rainfall (available from daily rain gage data) and Q = runoff (estimated using the NRCS approach for the specified CN value and ARC) for n = depth-duration size (days).
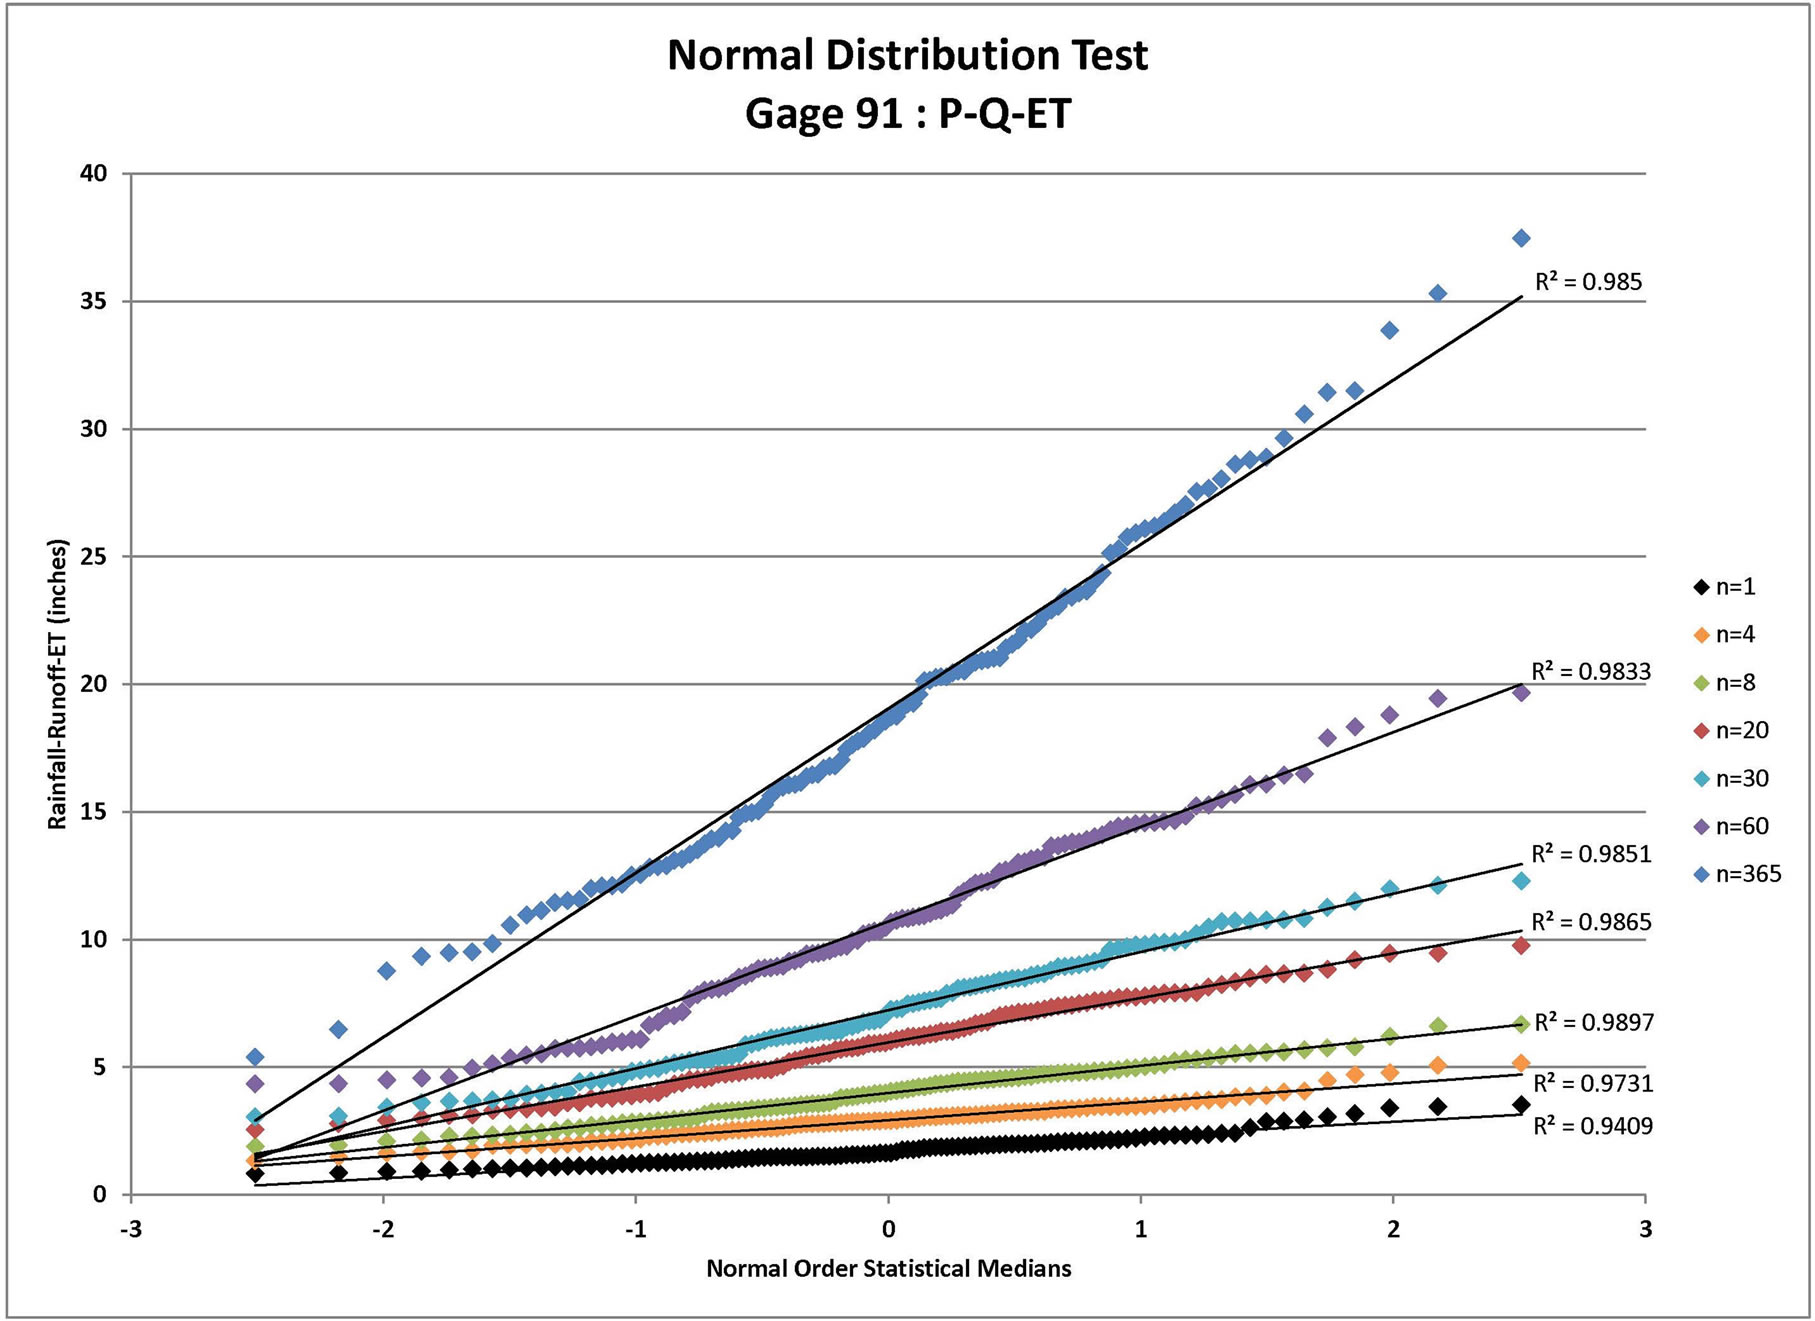
Figure 2. Normal distribution test for Gage 91: P-Q-ET where P = rainfall (available from daily rain gage data), Q = runoff (estimated using the NRCS approach for the specified CN value and ARC) and ET = evapo-transpiration for n = depth-duration size (days).
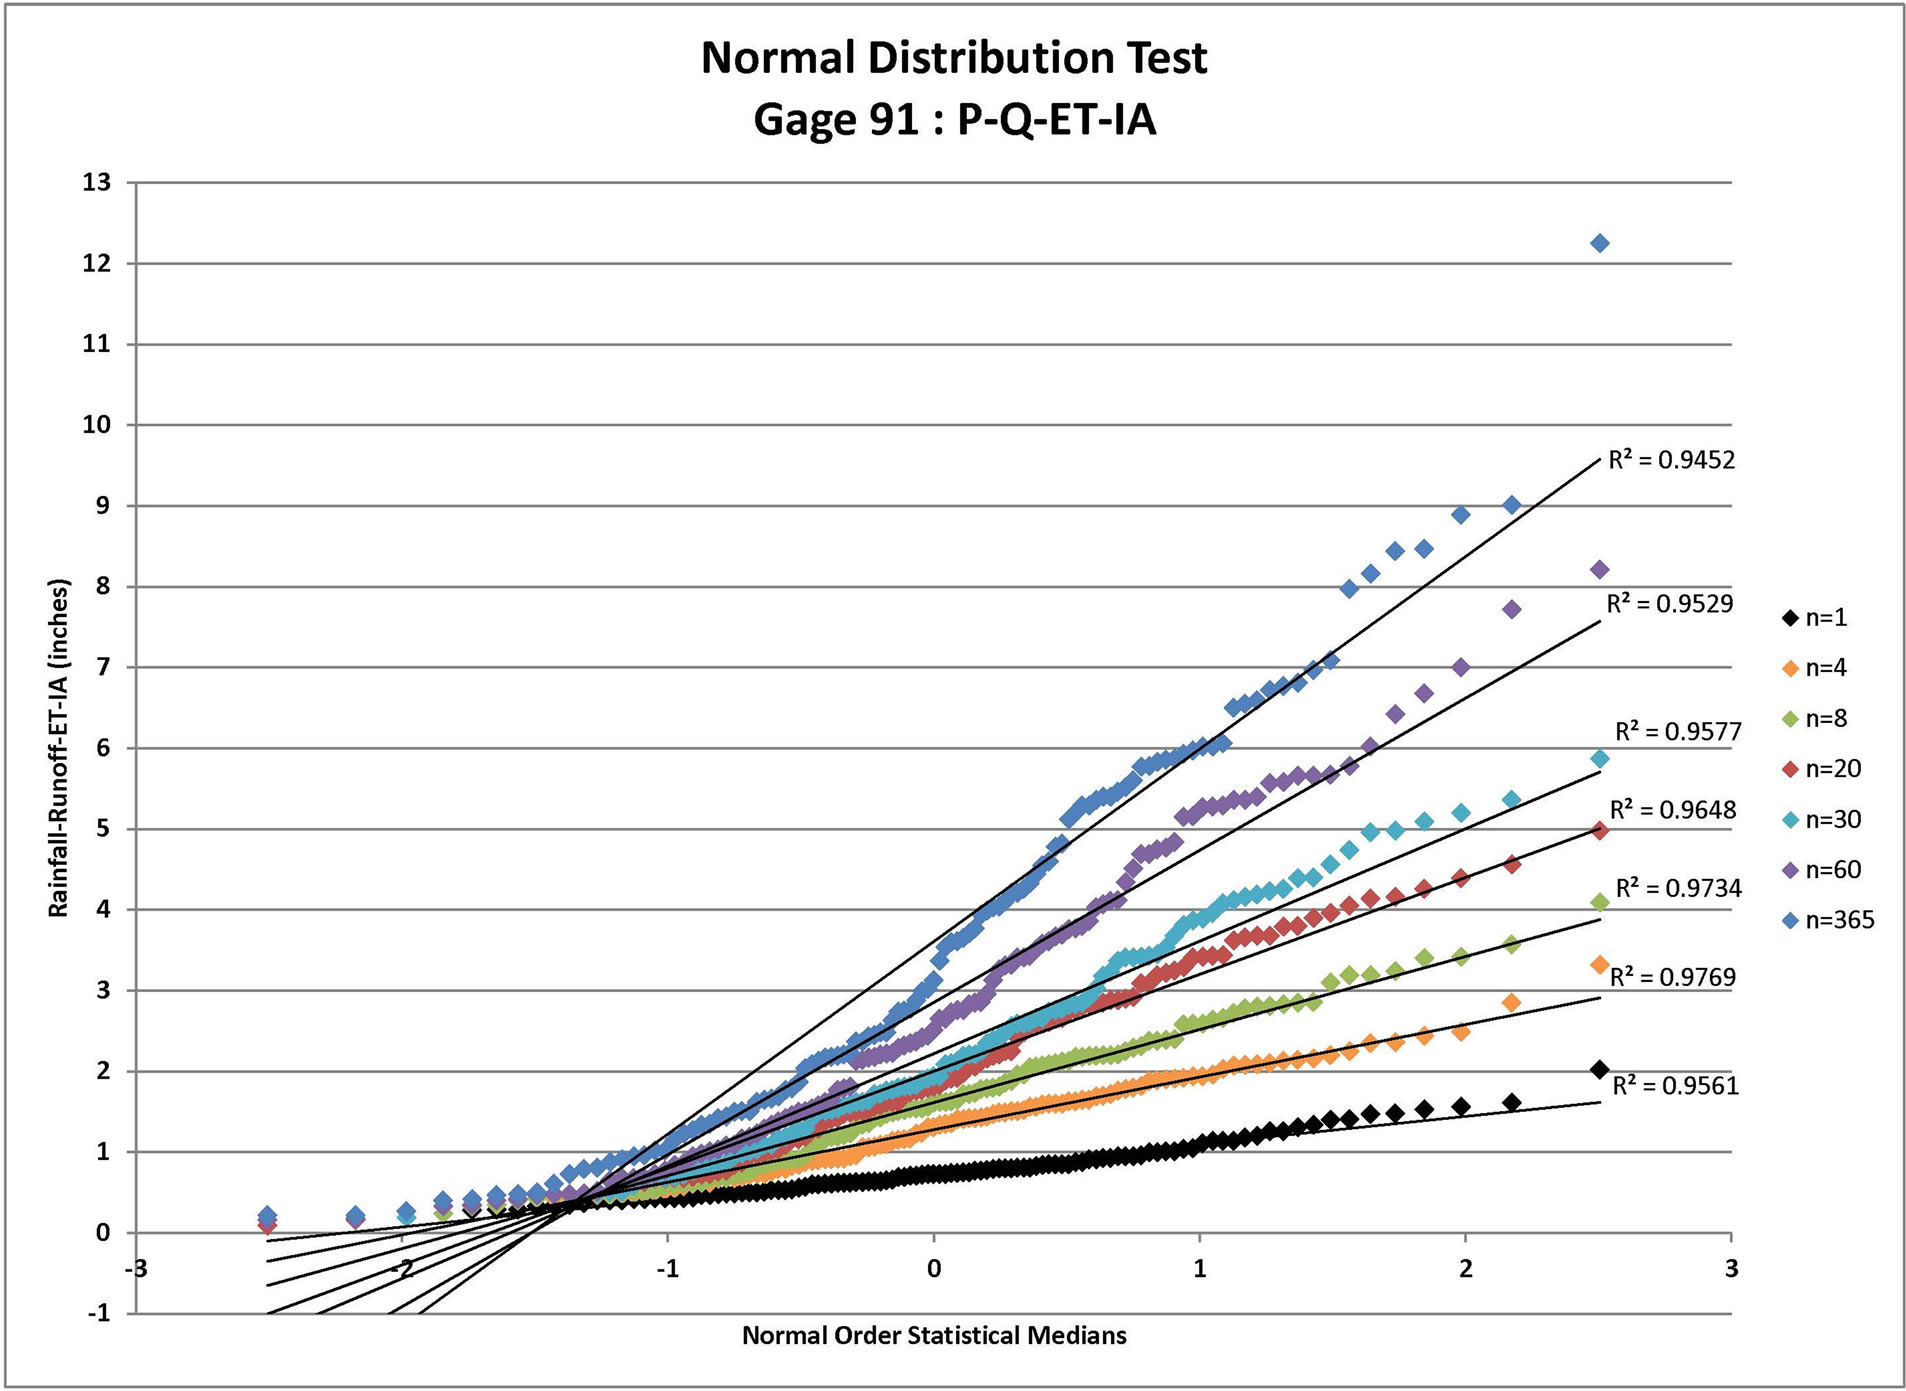
Figure 3. Normal distribution test for Gage 91: P-Q-ETIA where P = rainfall (available from daily rain gage data), Q = runoff (estimated using the NRCS approach for the specified CN value and ARC), ET = evapo-transpiration, and IA= initial abstraction (estimated from the NRCS approach for the specified CN value and ARC) for n = depth-duration size (days).
to extrapolate the rainfall infiltration estimates to rare occurrence probabilities depends upon the analysis of the resulting rainfall infiltration estimates for the various durations considered. In this paper, the standard normal and also the log-normal distributions are considered. Other distributions are possible, such as the log-Pearson III (LP3) distribution typically used to model storm runoff peak flow rates. This paper does not investigate the advantages or disadvantages of probability distributions and leaves that topic for future research. The choice of the standard normal distribution is based upon apparent goodness-of-fit of the rainfall infiltration estimates to the usual normal distribution plot test as observed by the authors. The best distribution to be used is subject to further indepth research. Indeed, it is contemplated that the apparent best distribution fit for the cases considered may be inappropriate for other locations or upon addition of more data.
For the case studies considered, significant variation in the usual best-fit statistical measures as well as visual inspection of best fit plots to the data both show that the applicable probability distribution function (pdf) was not consistent across all cases, suggesting that the choice of best fit pdf may need to be made on a case-by-case basis. Further research is needed to better understand what pdf best fits particular situations. In terms of risk analysis, use of several pdf fits may be appropriate to better describe variabilities and uncertainties in the predictions obtained in extrapolating data to rare return frequency levels.
8. Return Frequency Estimation of Depth-Durations of Infiltration
Once the probability distributions for the various depth-duration rainfall infiltration quantities are developed, return frequency estimates can be made of particular durations of rainfall infiltration corresponding to observed earth moving events. If the standard normal distribution is assumed to describe the depth-duration estimates of rainfall infiltration, the usual percentiles corresponding to the mean plus (or minus) the standard deviation of the particular duration estimated rainfall infiltration estimates, can be directly used to estimate the corresponding return frequency. Other probability distributions may be more appropriate for use such as the log-Pearson family of distributions that finds significant use in rainfall return frequency analysis [14]. It is noted that the rainfall infiltration estimates not only depend on the rainfall data used, but also the model employed to estimate the rainfall infiltration. Different infiltration models may result in in
 (a)
(a)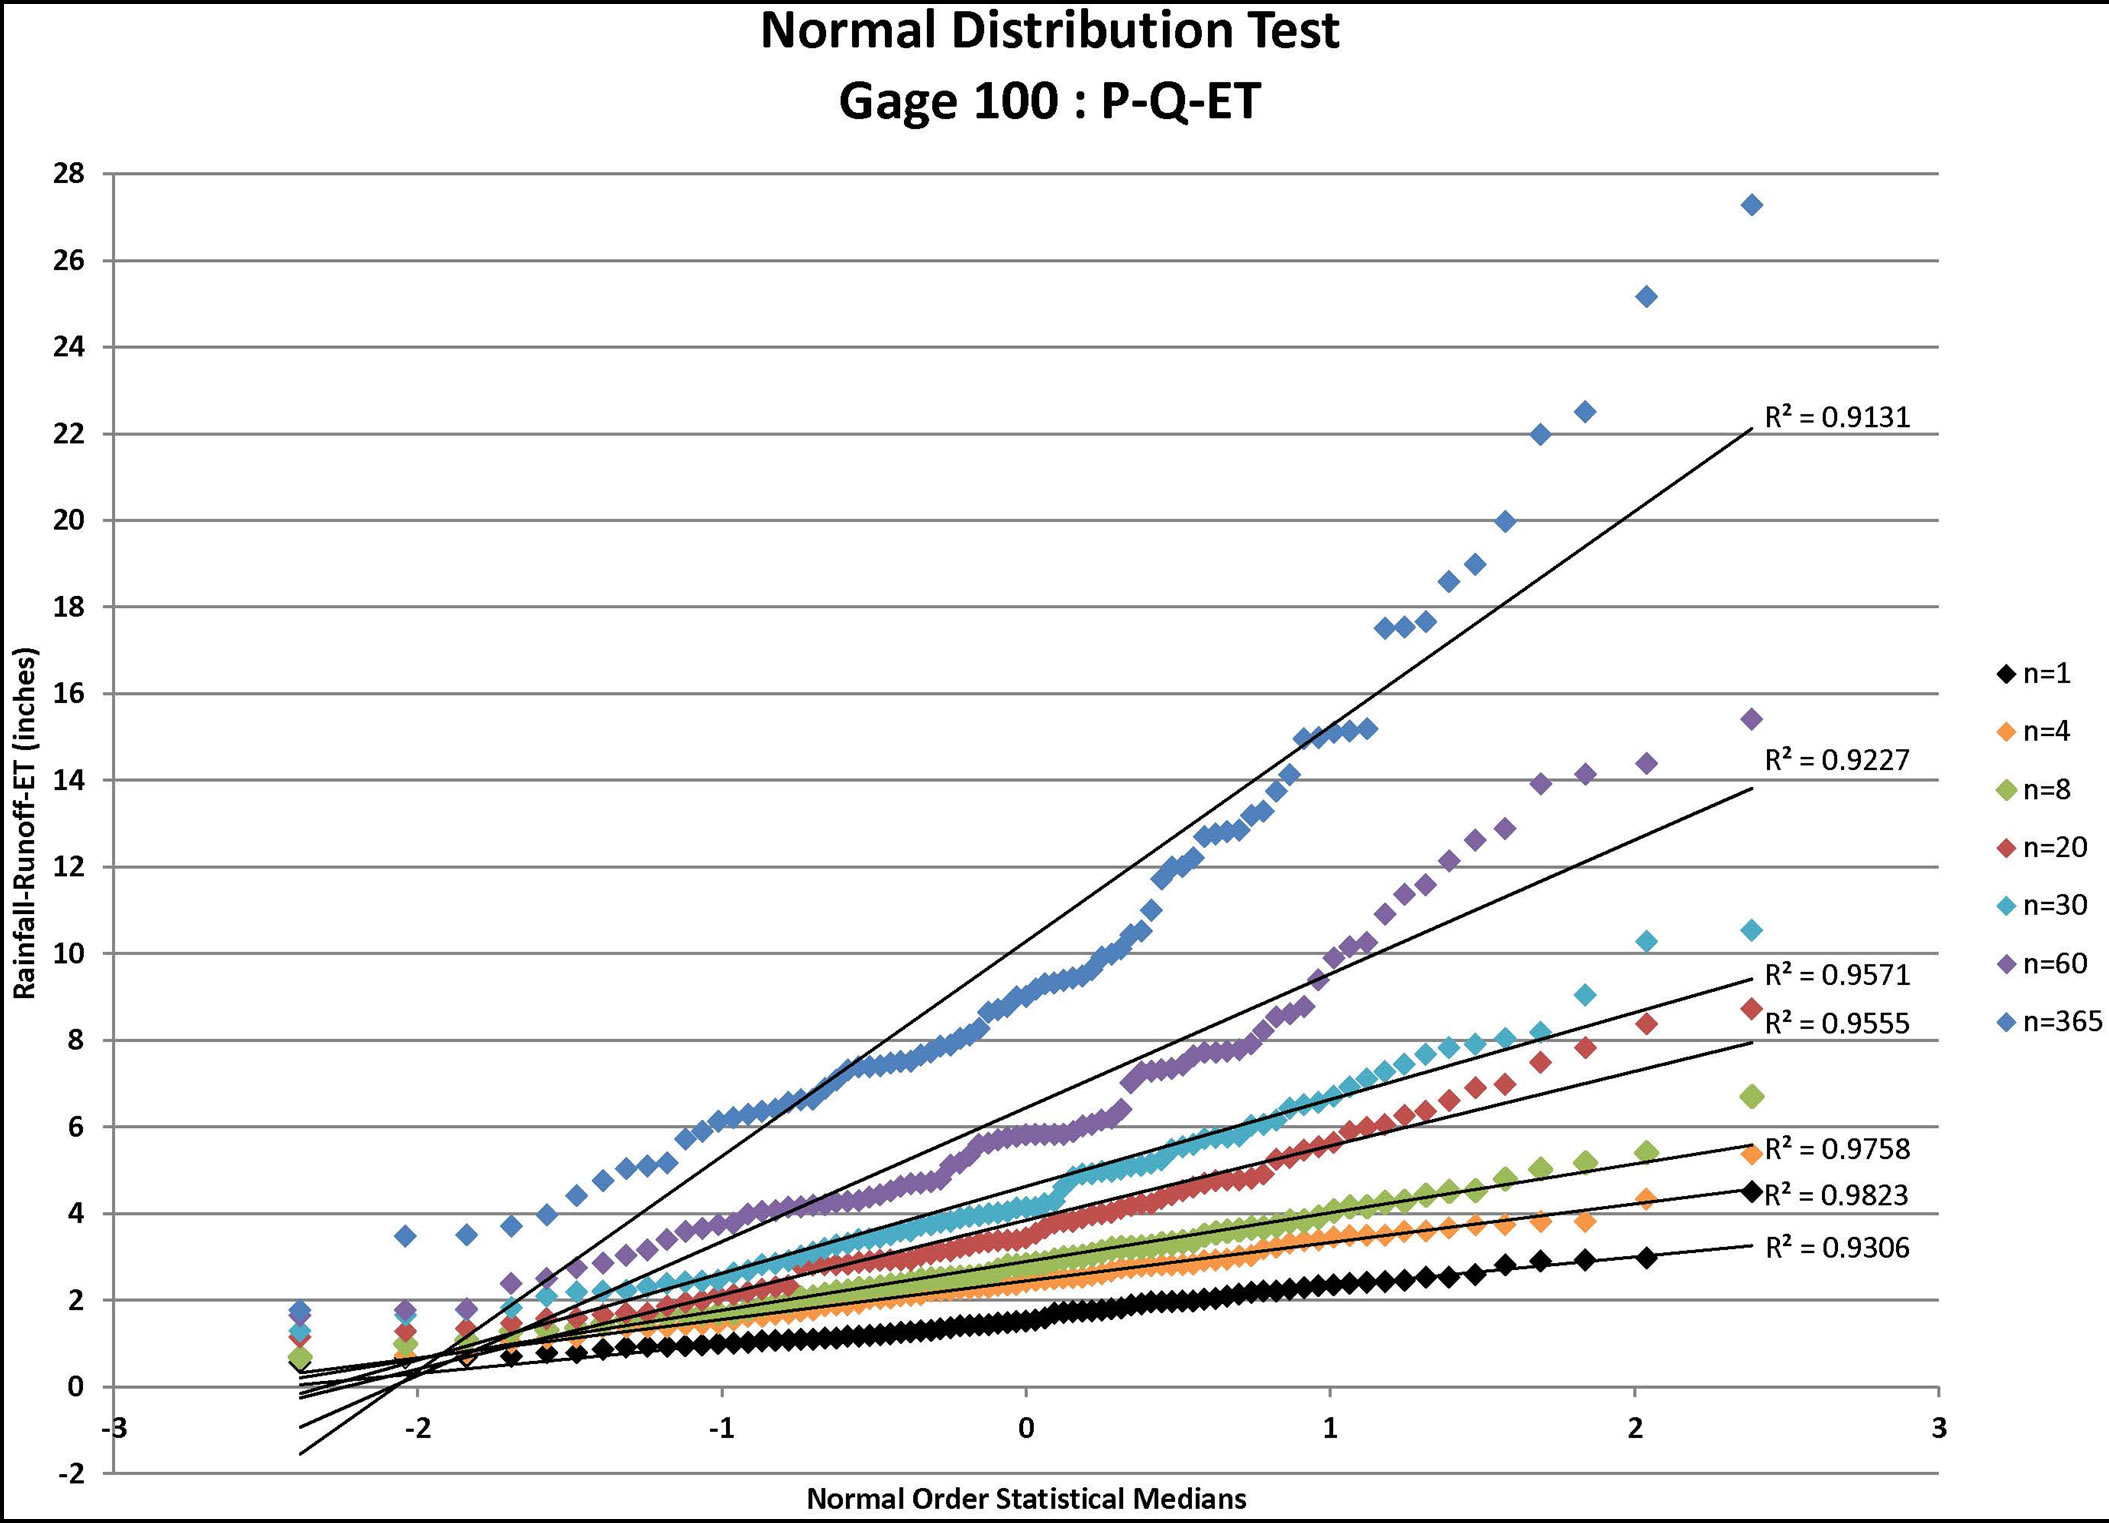 (b)
(b)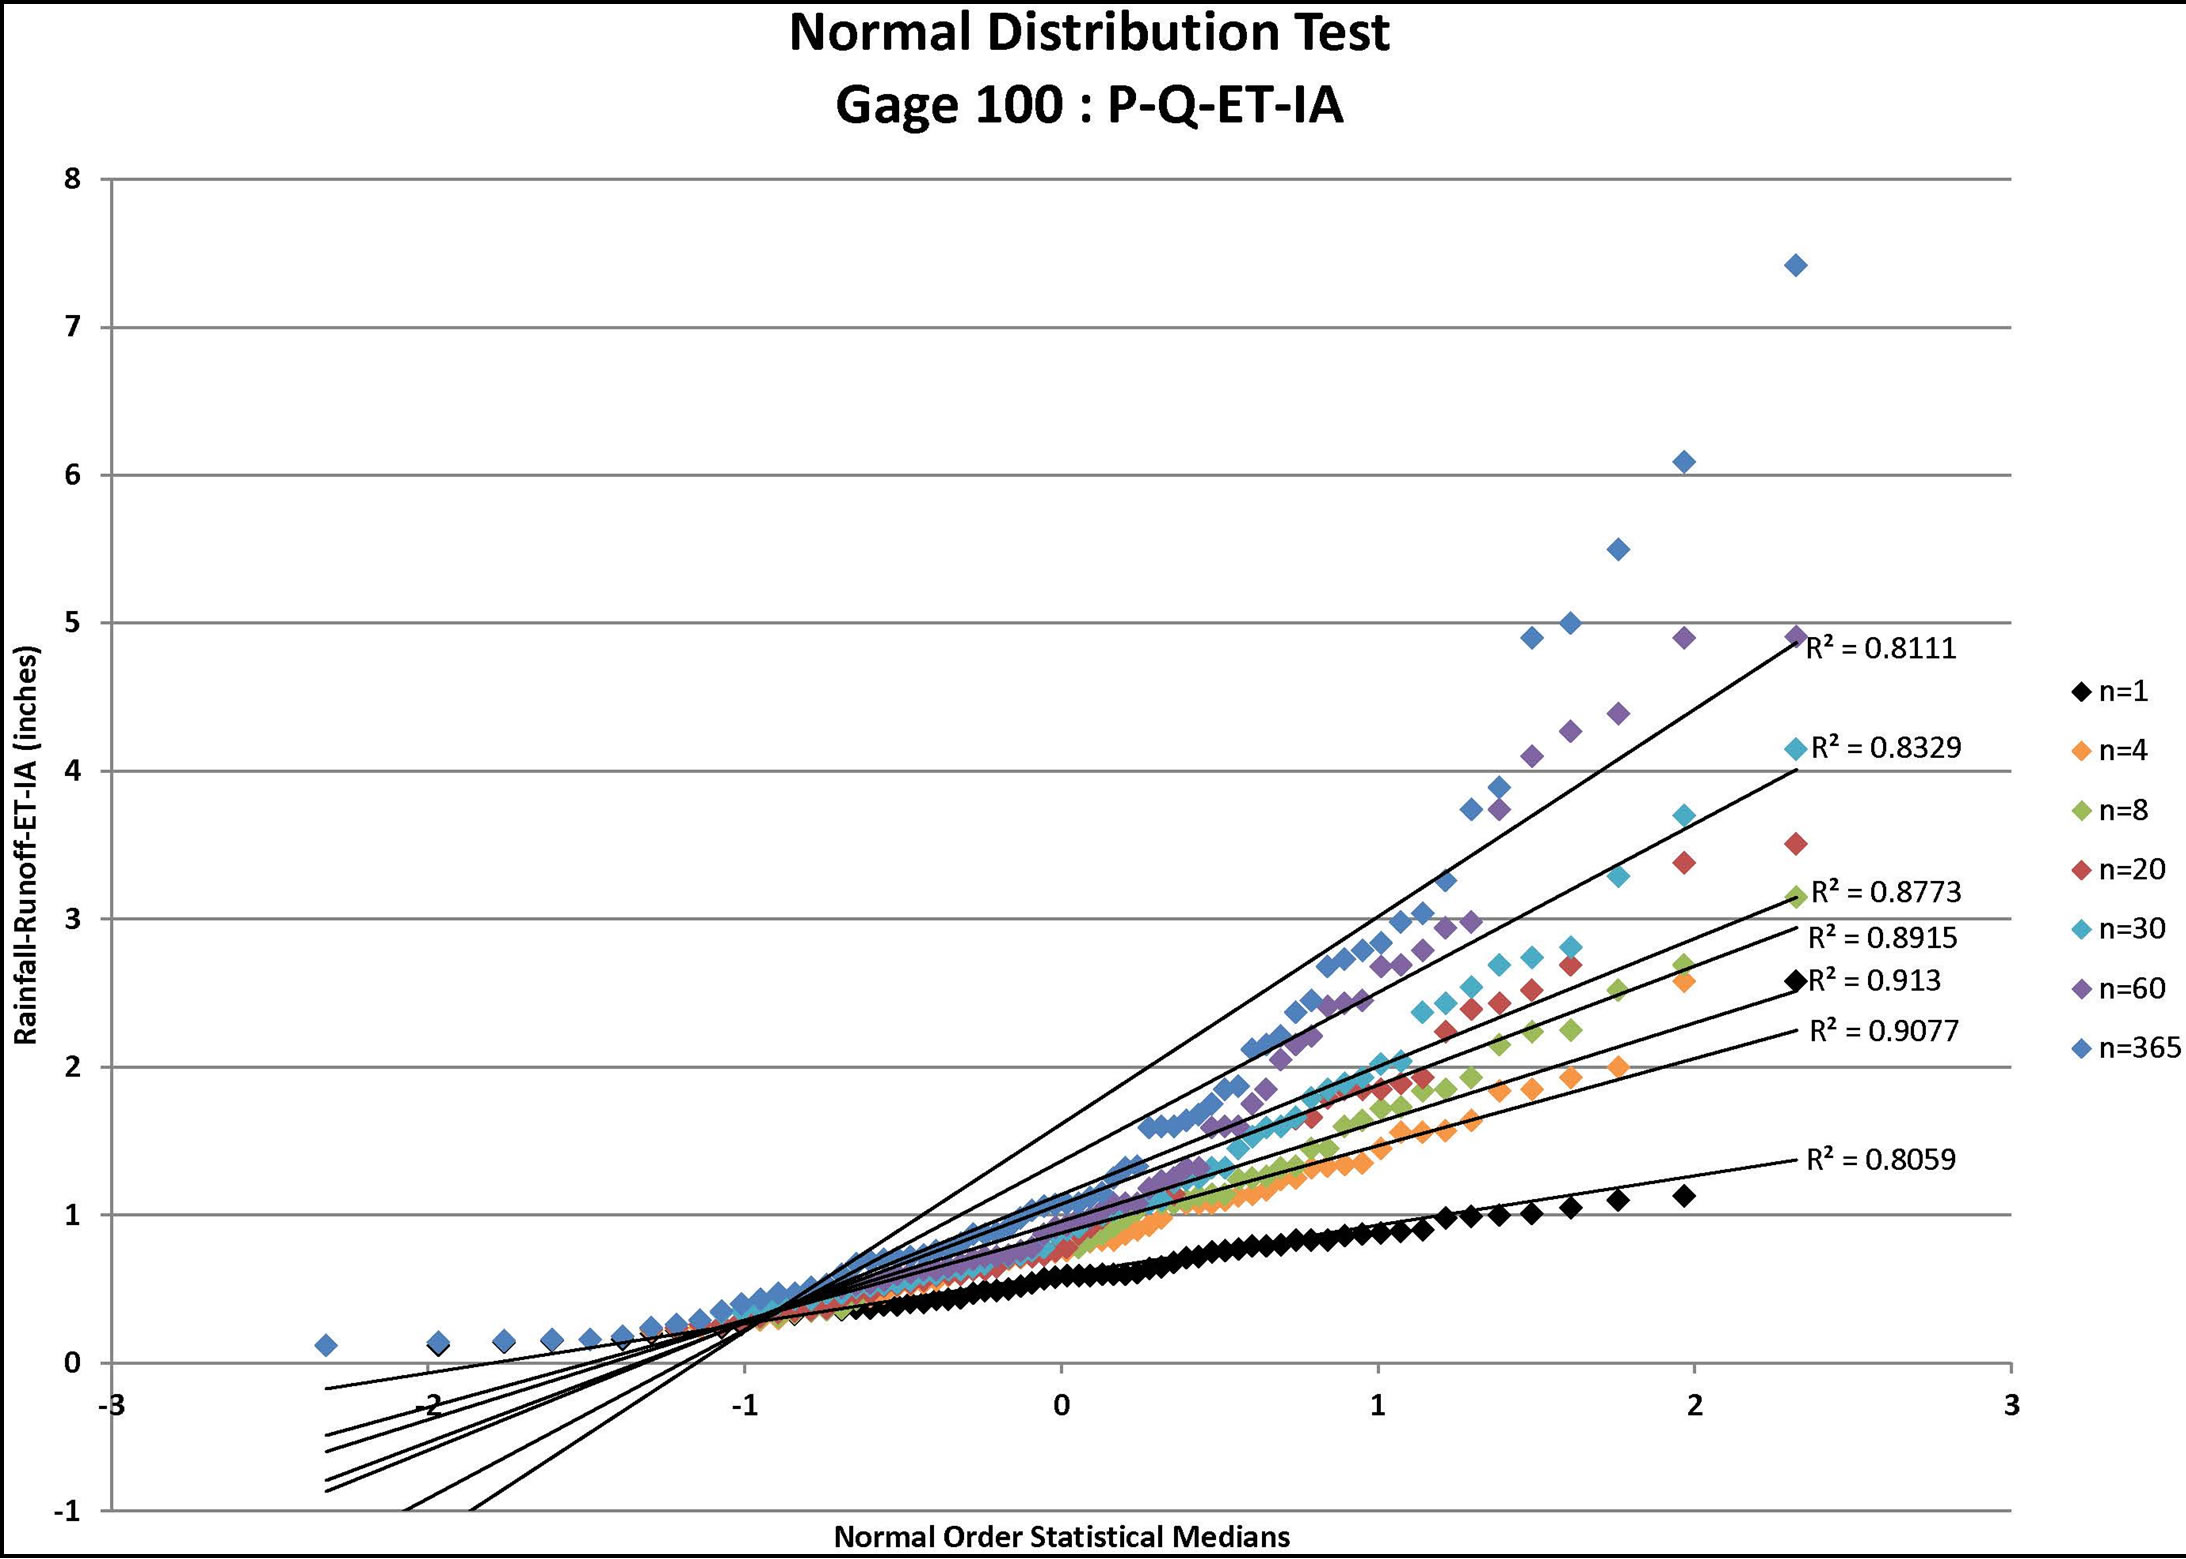 (c)
(c)
Figure 4. Normal distribution tests for gage 100: P-Q, P-Q-ET, and P-Q-ET-IA where P = rainfall (available from daily rain gage data), Q = runoff (estimated using the NRCS approach for the specified CN value and ARC), ET = evapo-transpiration, and IA = initial abstraction (estimated from the NRCS approach for the specified CN value and ARC) for n = depth-duration size (days).
 (a)
(a)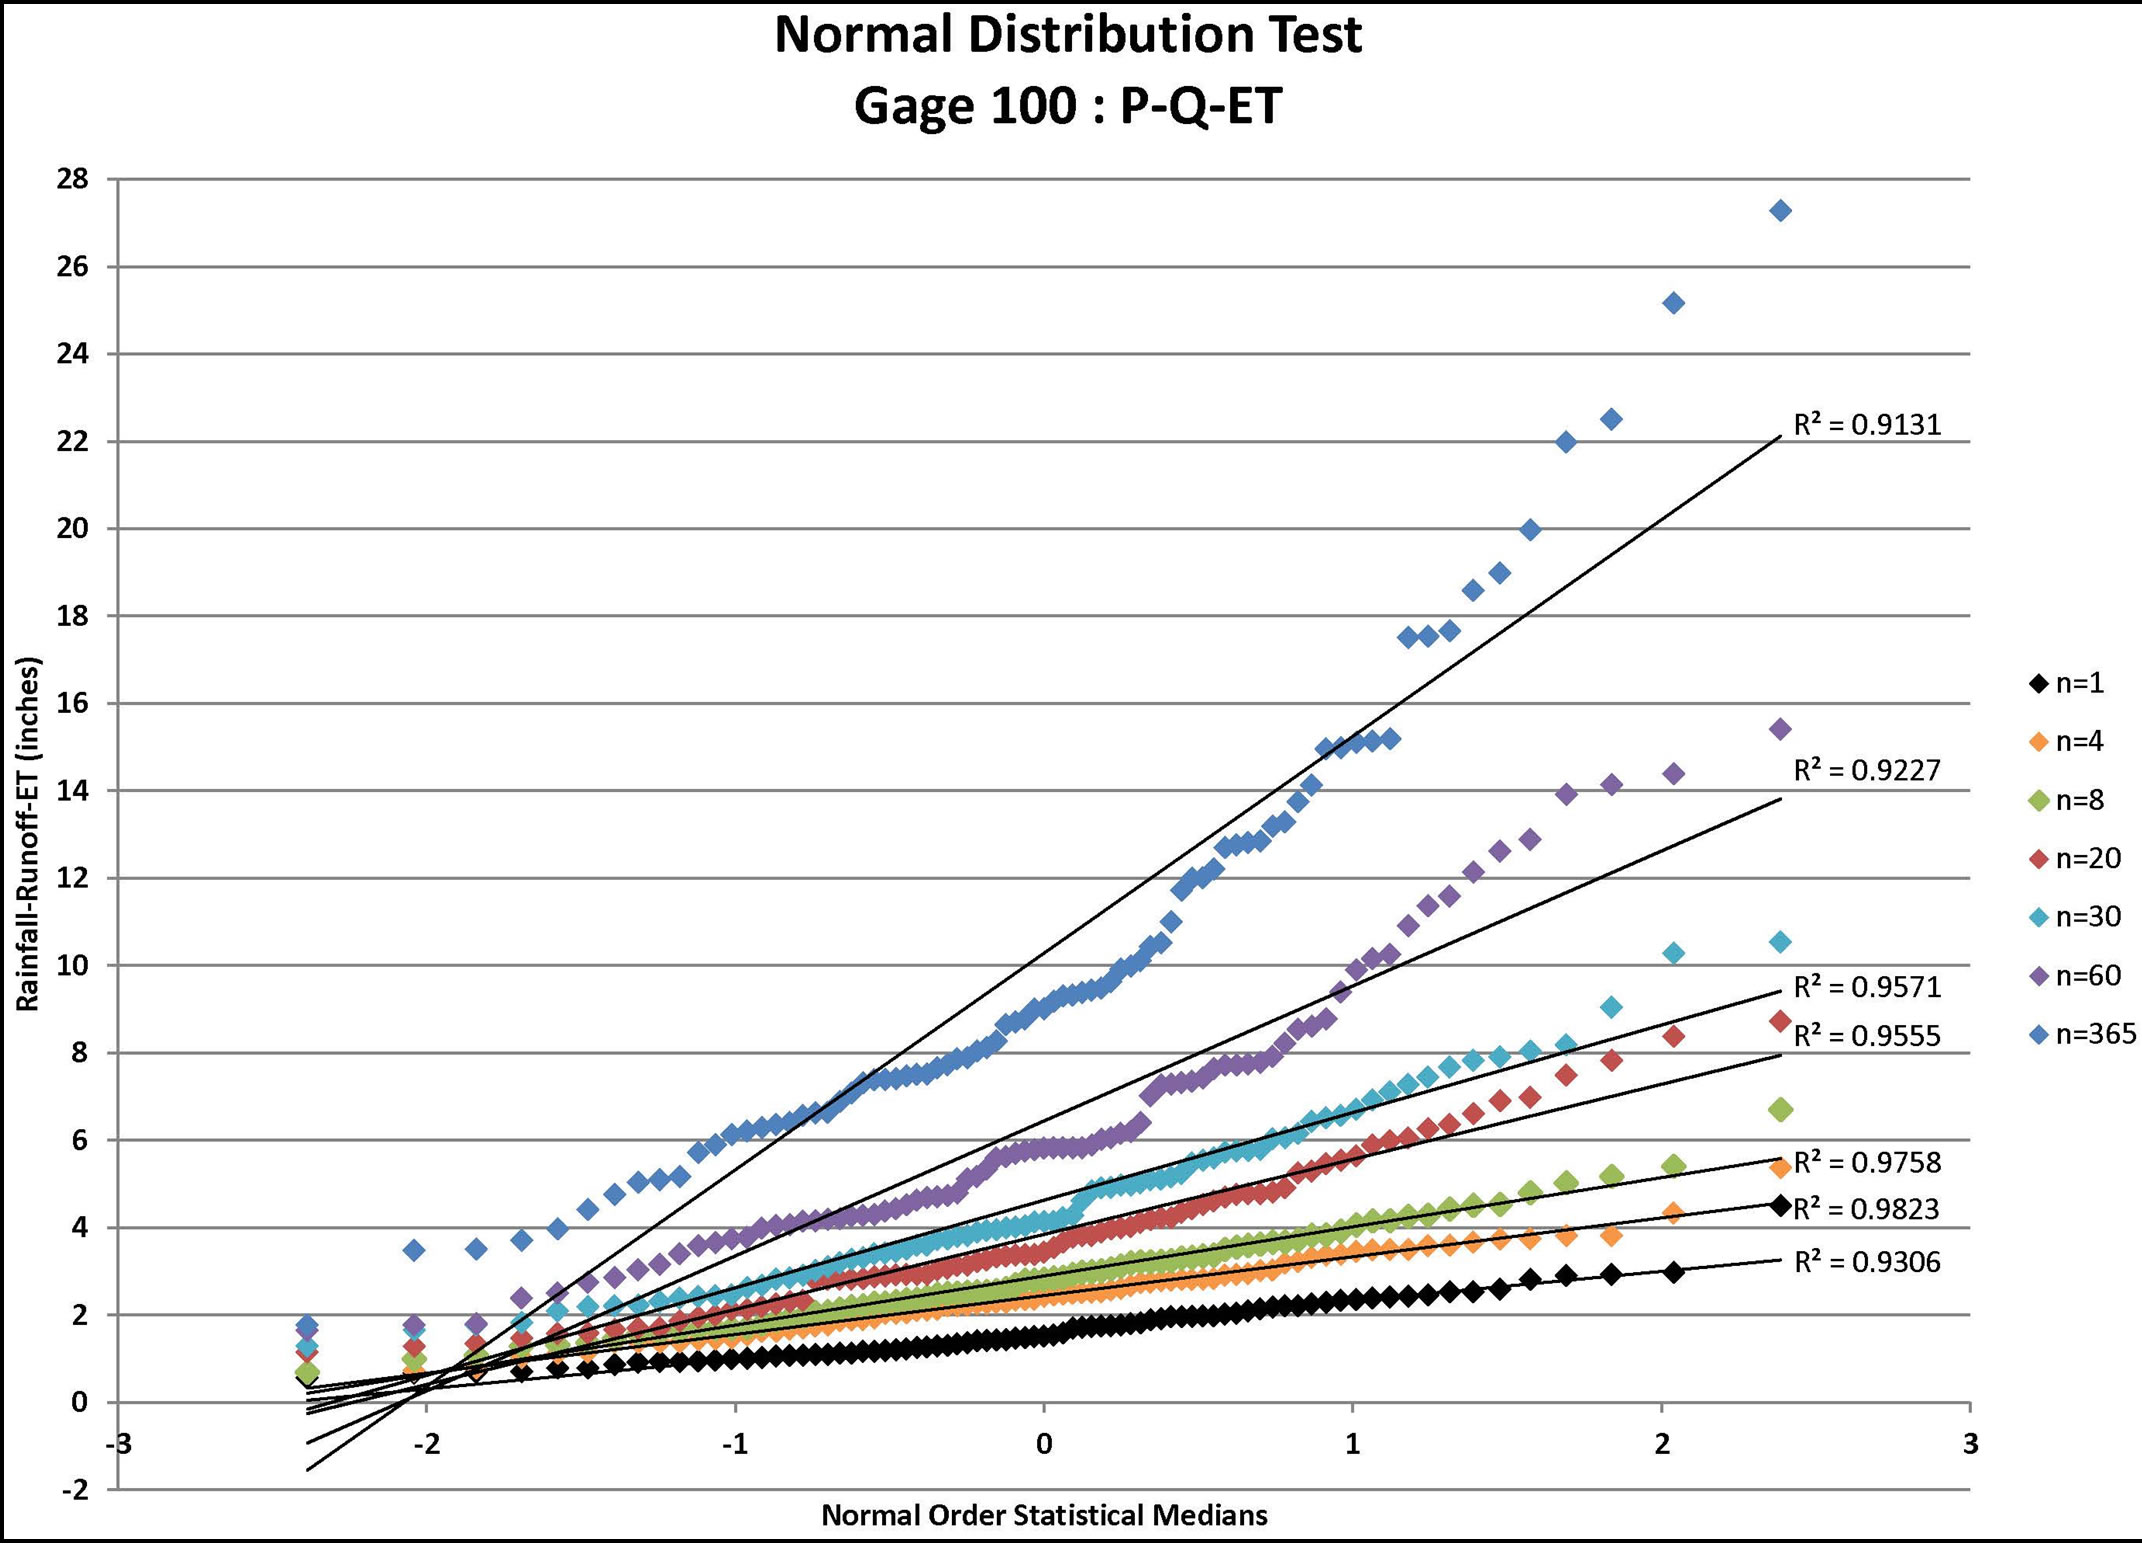 (b)
(b)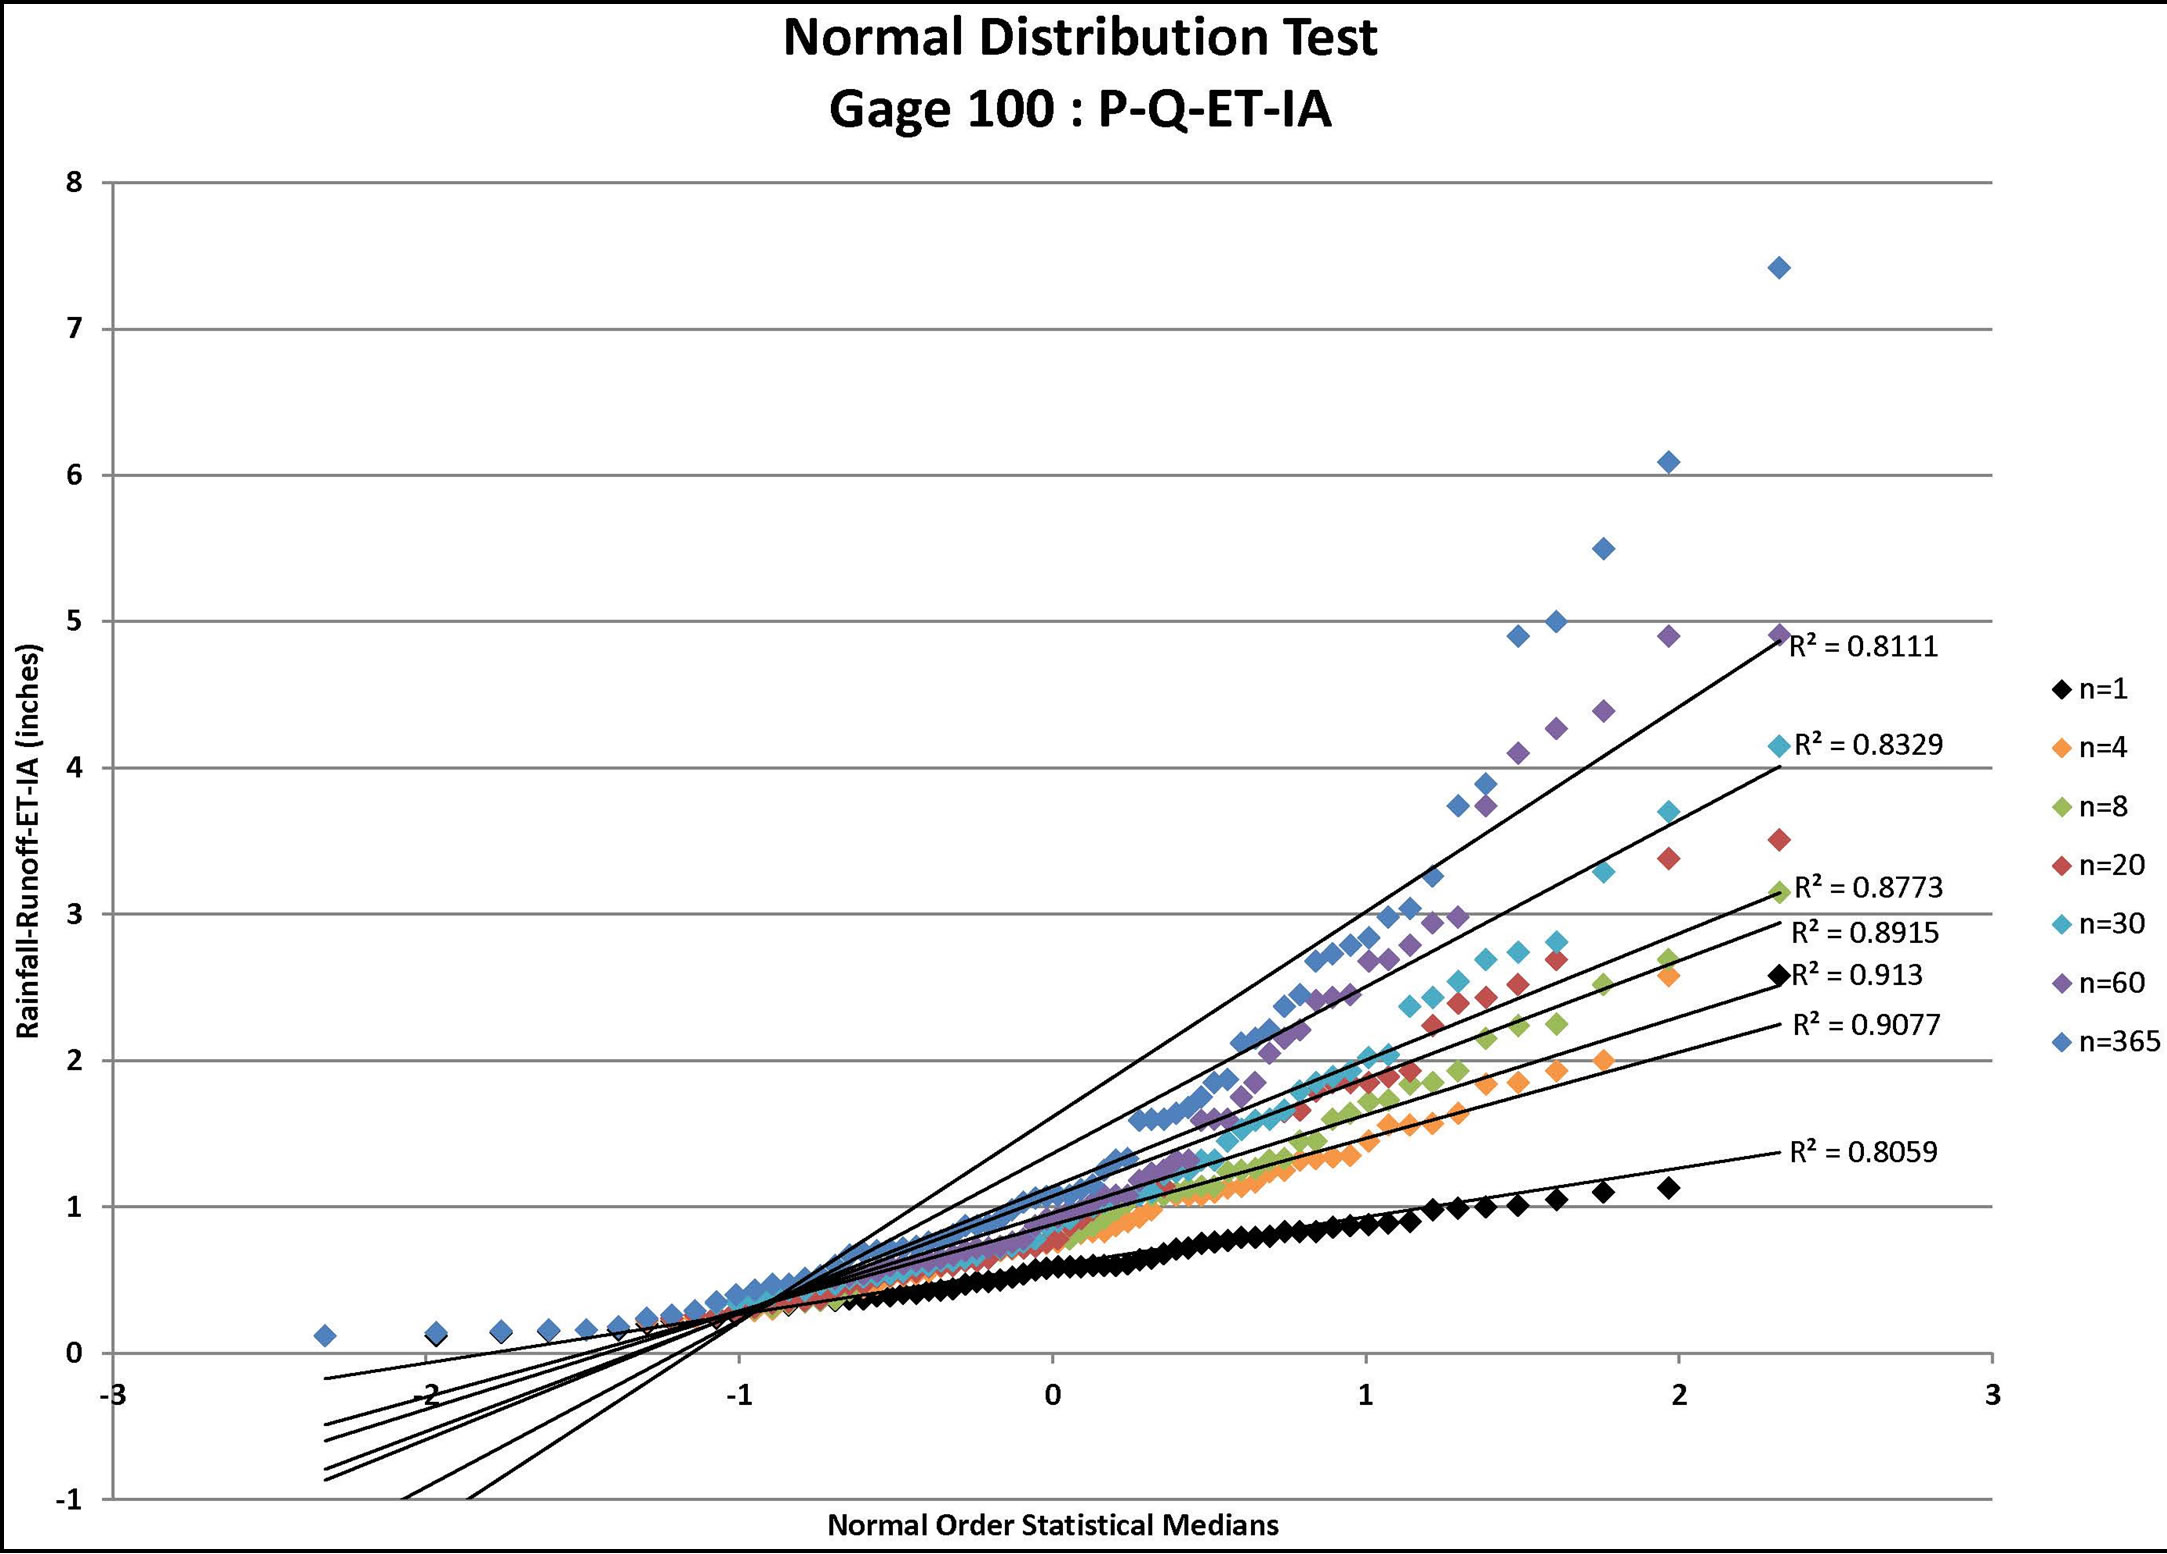 (c)
(c)
Figure 5. Normal distribution tests for gage 176: P-Q, P-Q-ET, and P-Q-ET-IA where P = rainfall (available from daily rain gage data), Q = runoff (estimated using the NRCS approach for the specified CN value and ARC), ET = evapo-transpiration, and IA = initial abstraction (estimated from the NRCS approach for the specified CN value and ARC) for n = depth-duration size (days).
 (a)
(a)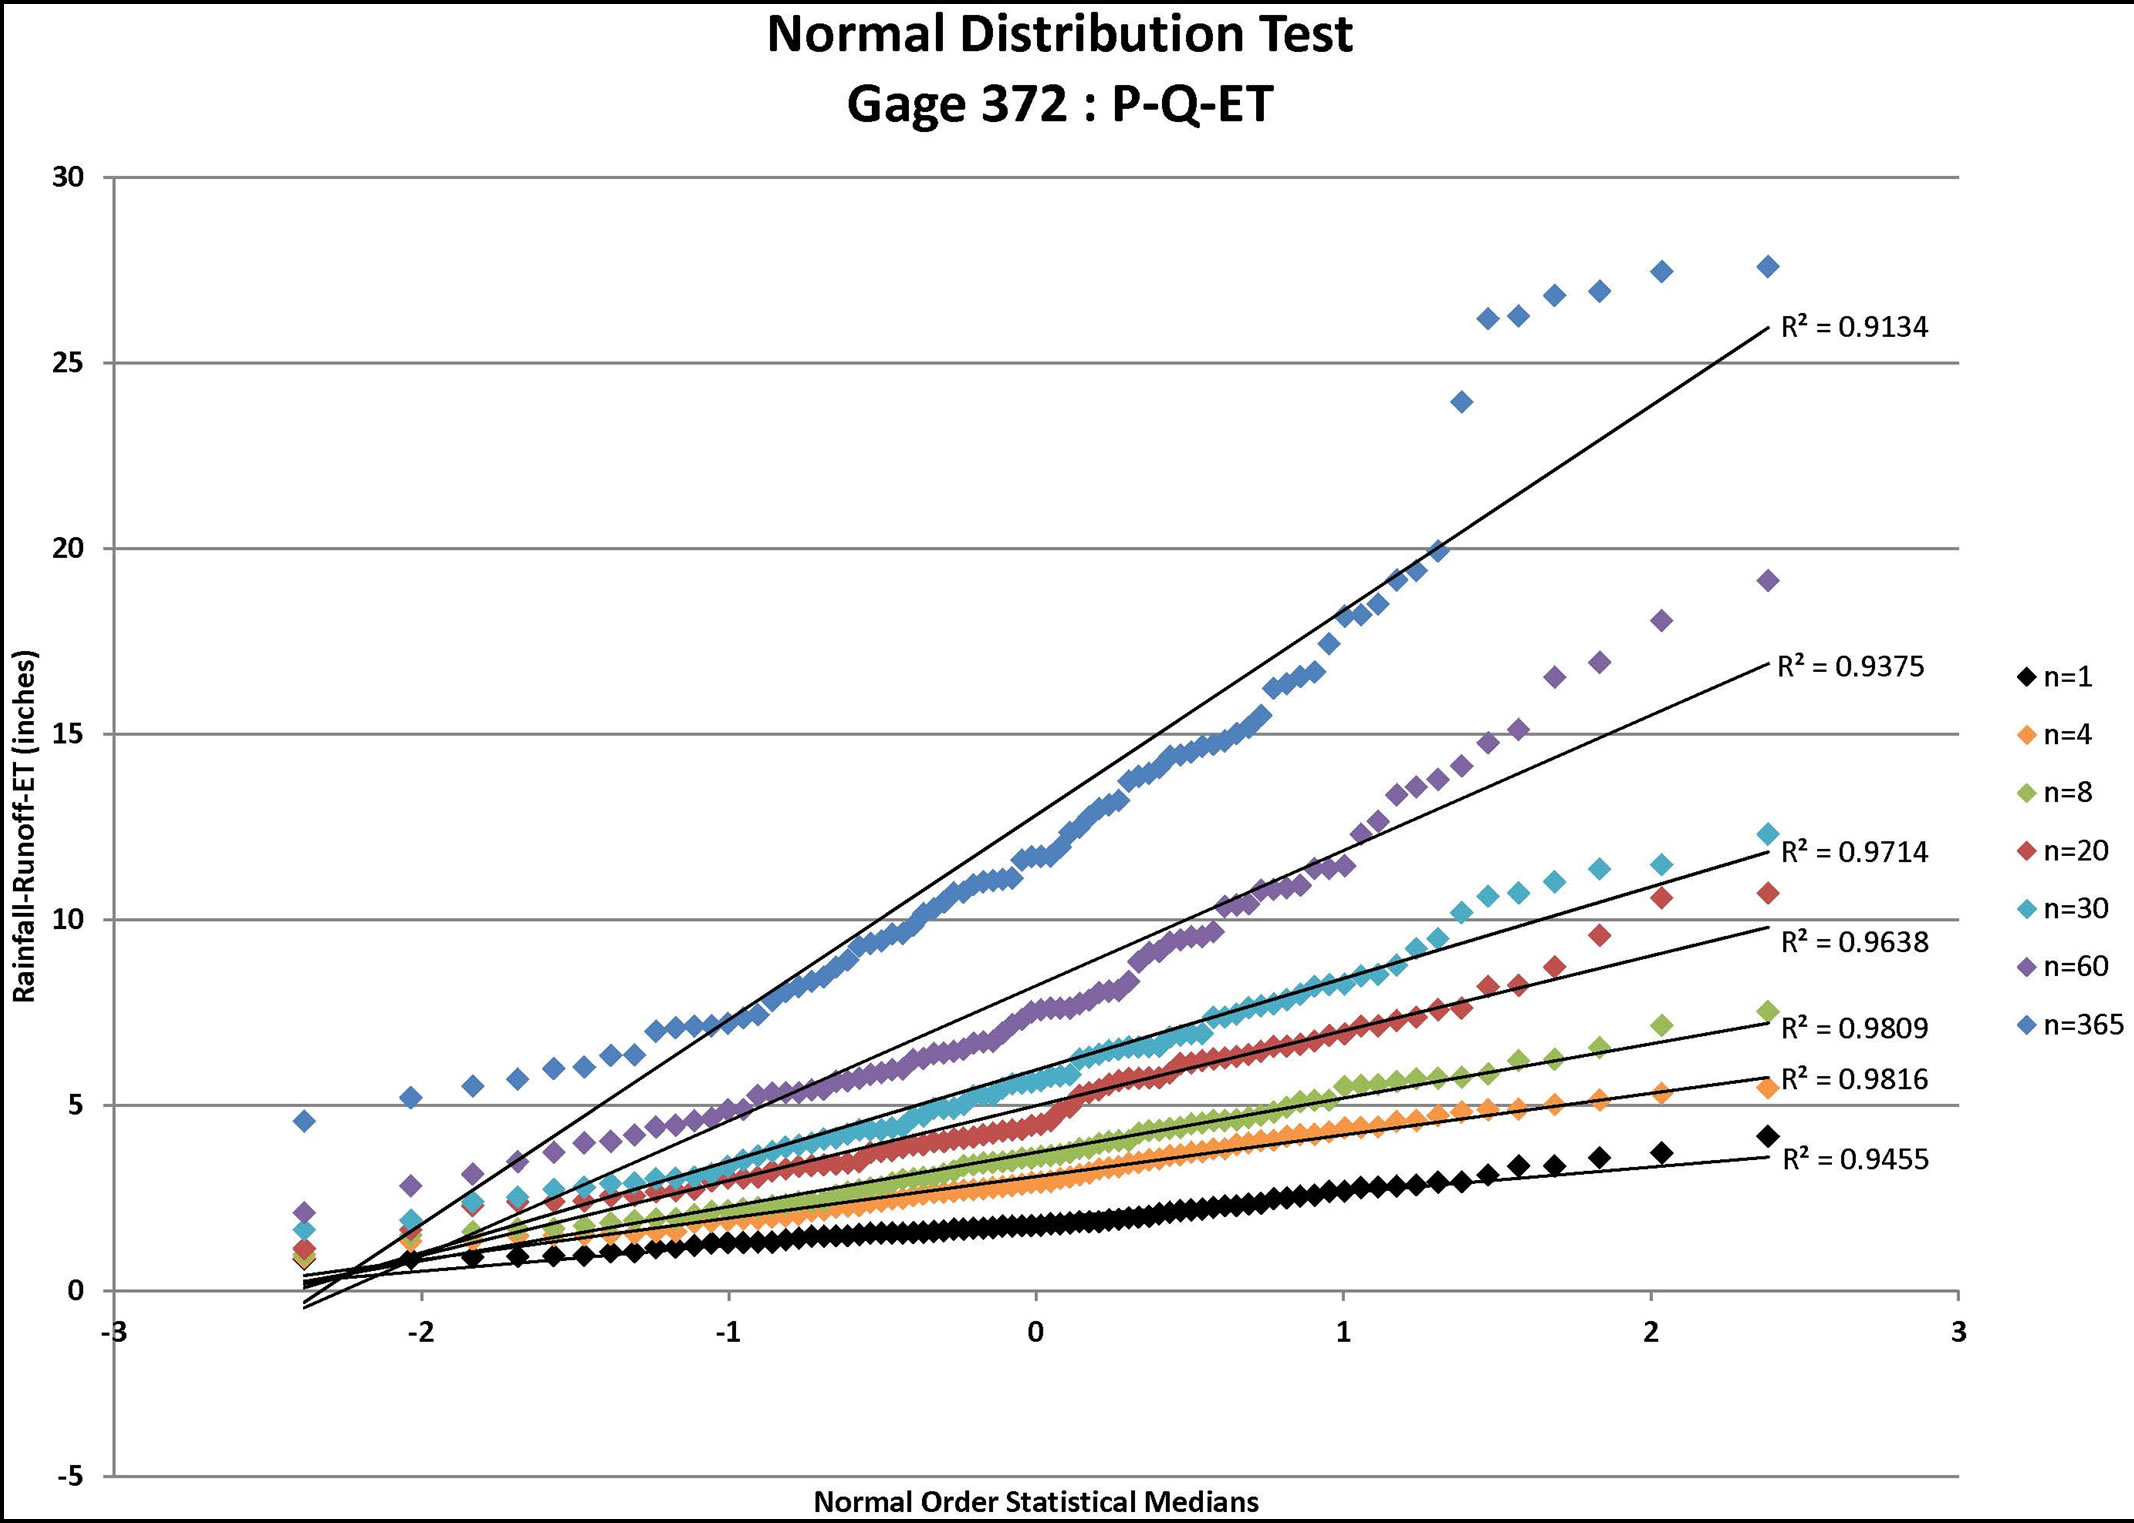 (b)
(b)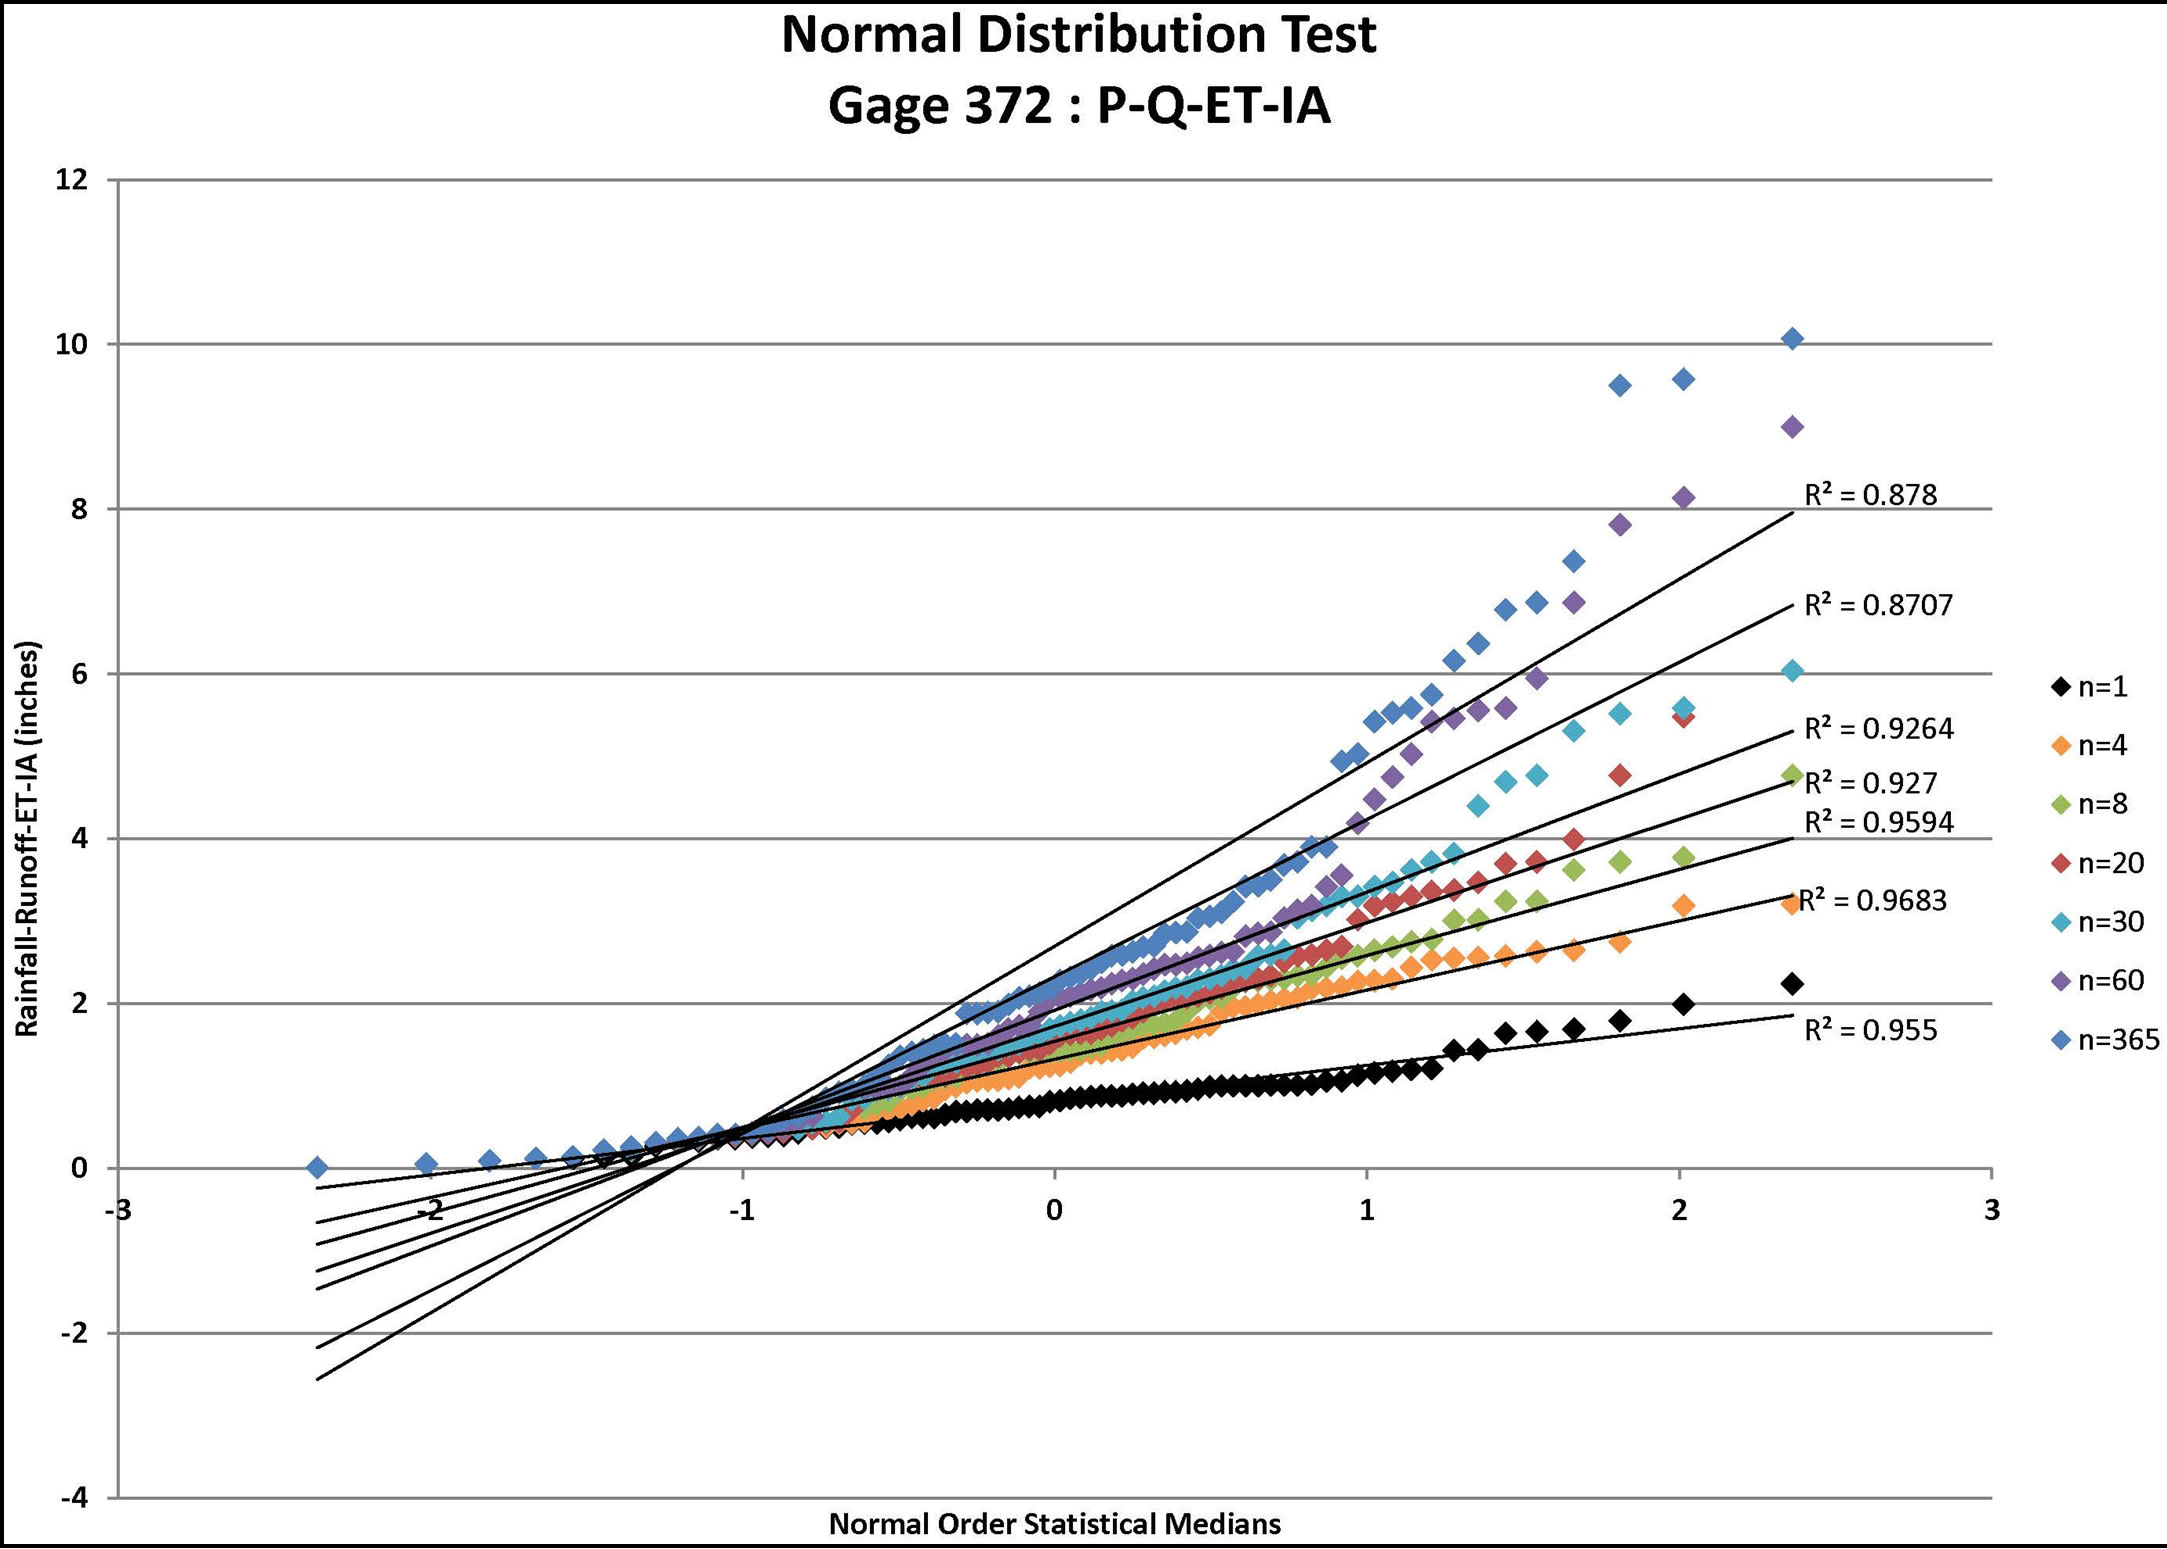 (c)
(c)
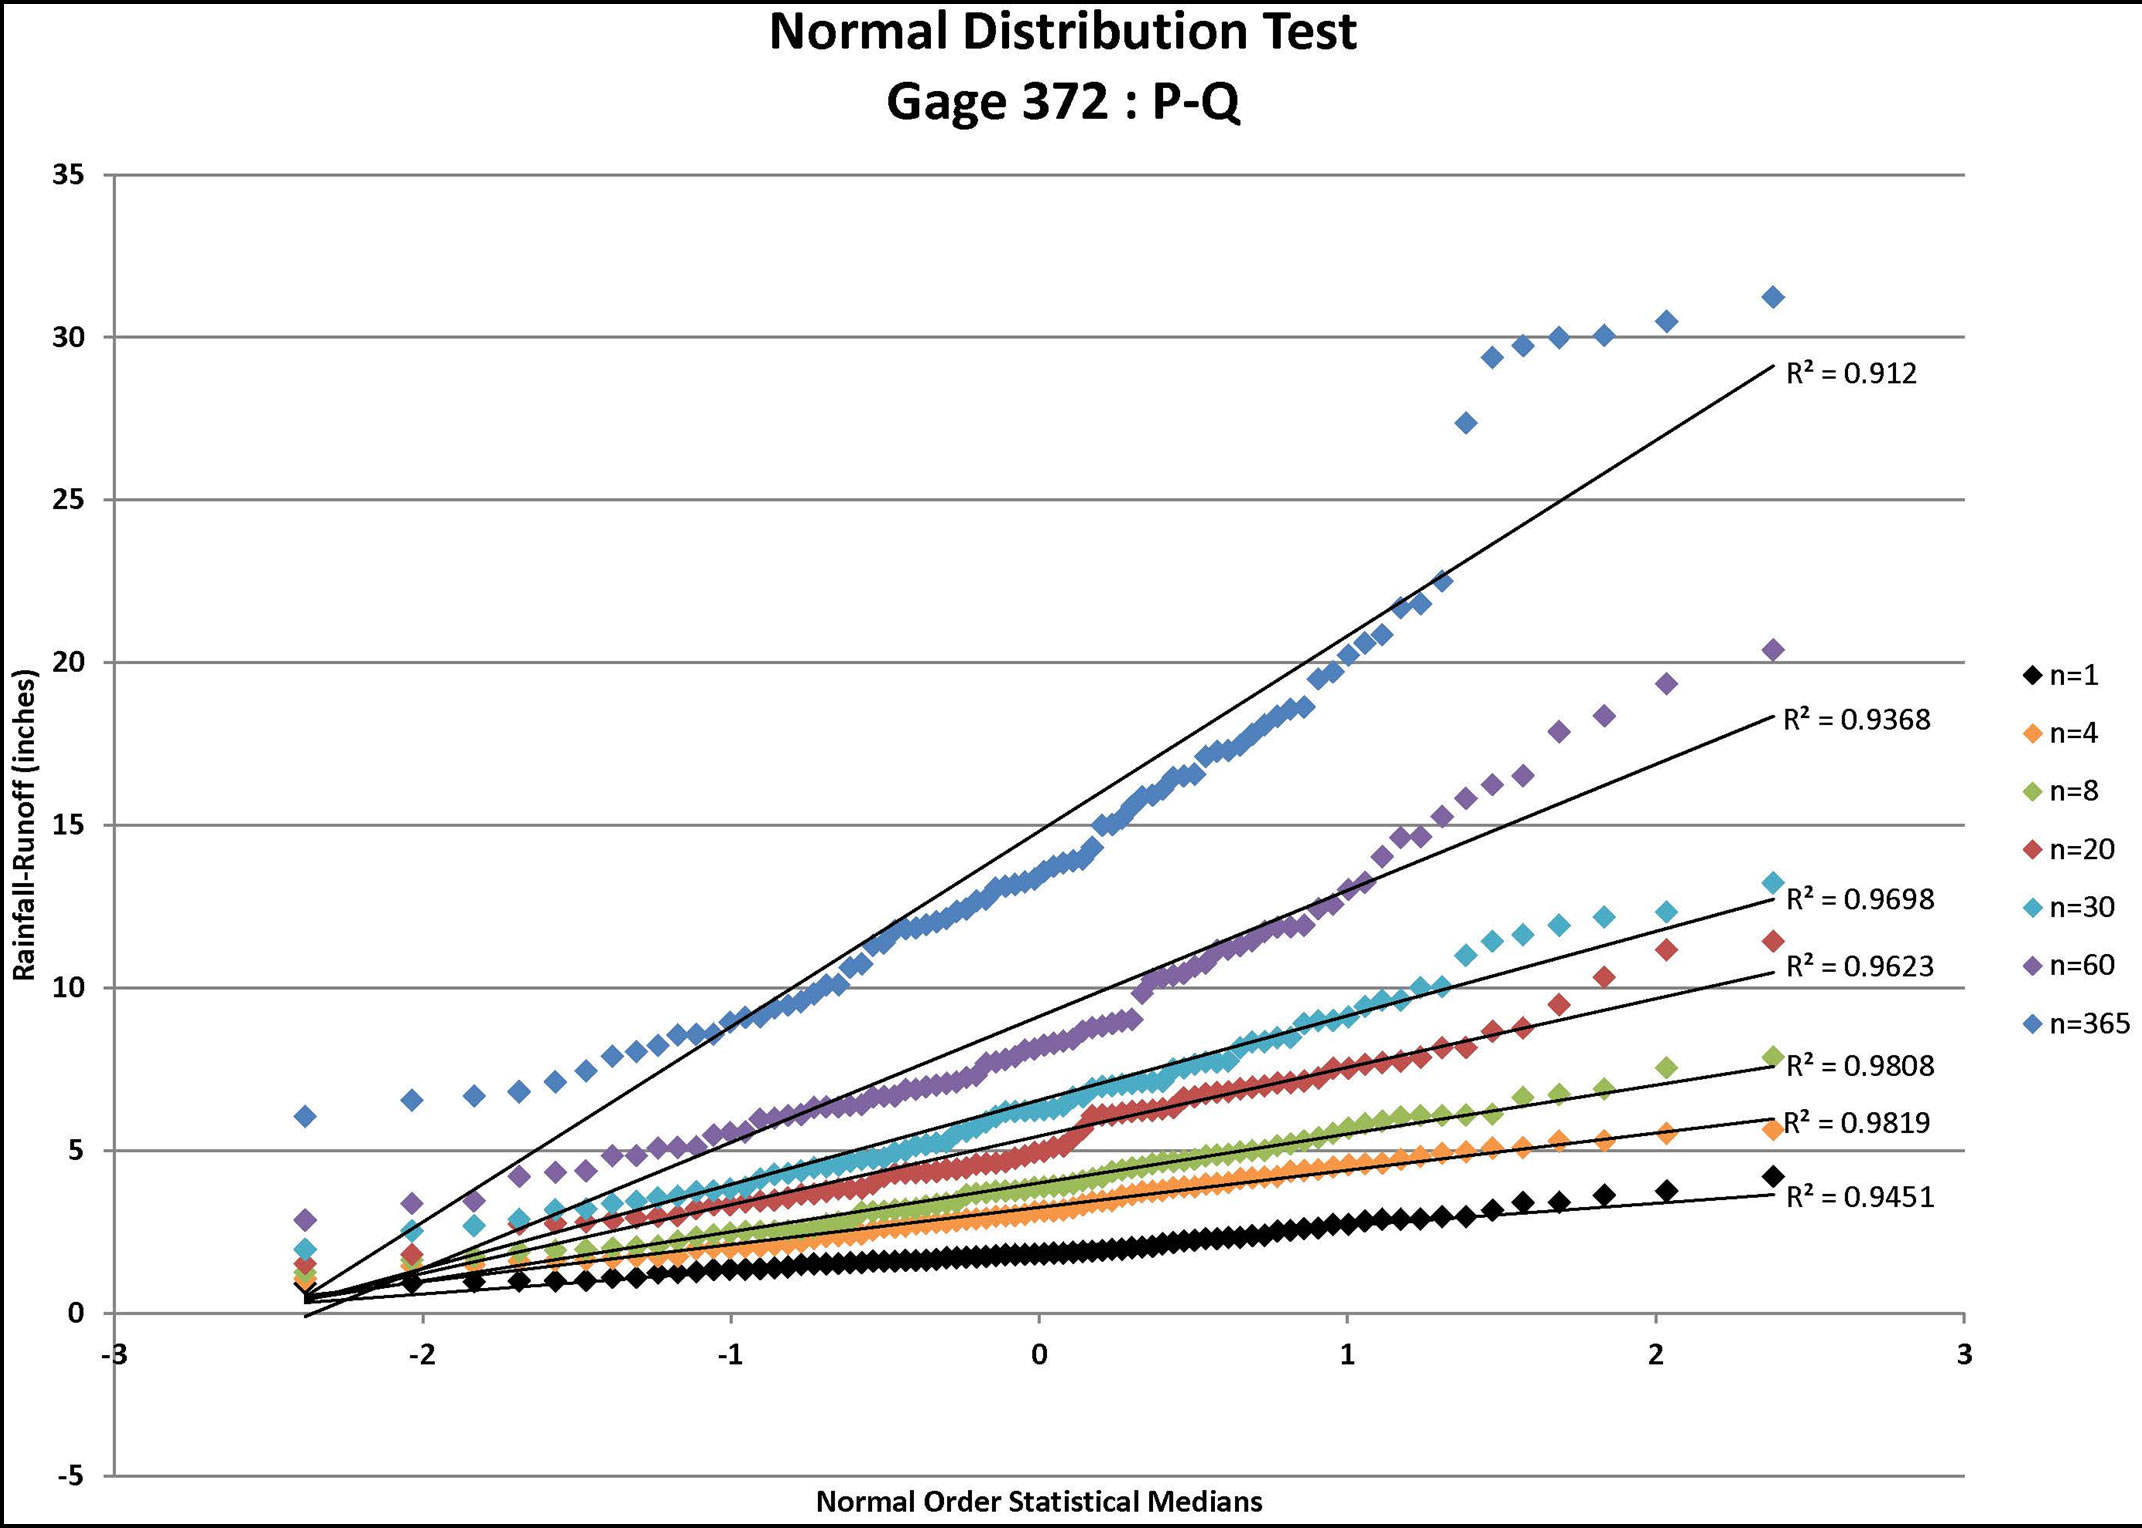
Figure 6. Normal distribution tests for gage 372: P-Q, P-Q-ET, and P-Q-ET-IA where P = rainfall (available from daily rain gage data), Q = runoff (estimated using the NRCS approach for the specified CN value and ARC), ET = evapo-transpiration, and IA = initial abstraction (estimated from the NRCS approach for the specified CN value and ARC) for n = depth-duration size (days).
filtration estimates that may be better modeled statistically by a different distribution. More research is needed to assess if one probability distribution is appropriate for generalization to application to all situations, such as the log-Pearson distribution which is applied to rainfall data alone.
9. Application
In order to demonstrate the above approach, a series of shallow landslides which occurred over a time span of 100 years was considered, with large landslide events occurring in years 1909, 1935, 1940, 1952, 1956, and 2006. The location of these landslides were not the same, but separated by a few hundred feet distance. Of particular interest in this situation is the relationship between the occurrences of landslides versus the severity of the rainfall event. In order to describe the relevant rainfall infiltration, the return frequencies of the particular rainfall infiltration events are estimated using the procedures described in this paper. The above methodology for estimating rainfall infiltration is applied to the daily rainfall data for the Berkeley Geology rain gage, listed in Table 1. For the rainfall water year given as October to September, the entire water year of daily rainfall is broken down into the above described depth-duration intervals up to 365 days in length. For the study, the entire history of daily rainfalls is analyzed in order to identify other comparable rainfall or rainfall infiltration events found in the past where data exist. However, for the subject demonstration, only the water year of the landslide event is presented herein. Using the normal distribution as described above, the return frequency of each of the 365 depth-duration annual outcomes is estimated, resulting in 365 return frequency estimate values, one for each duration size. Plots of return frequency estimate versus duration size are prepared, for both rainfall as well as the rainfall infiltration estimates. The combined plots are shown in Figure 7. However for brevity, only the water year of the landslide event is graphically shown, although similar plots were created as part of the computational analysis for each of the seasons where rainfall data are available [6].
From the Figure, rainfall infiltration return frequency estimates are above the 100-year level for the durations of 14 days through 21 days. For the 16-day duration, rainfall infiltration quantities are estimated to be above the 250- year return frequency level. In comparison, the associated rainfalls corresponding to these same durations are less than about the 30-year return frequency. Examination of the rainfalls and the associated infiltration estimates show that the rainfalls under study were of relatively low or
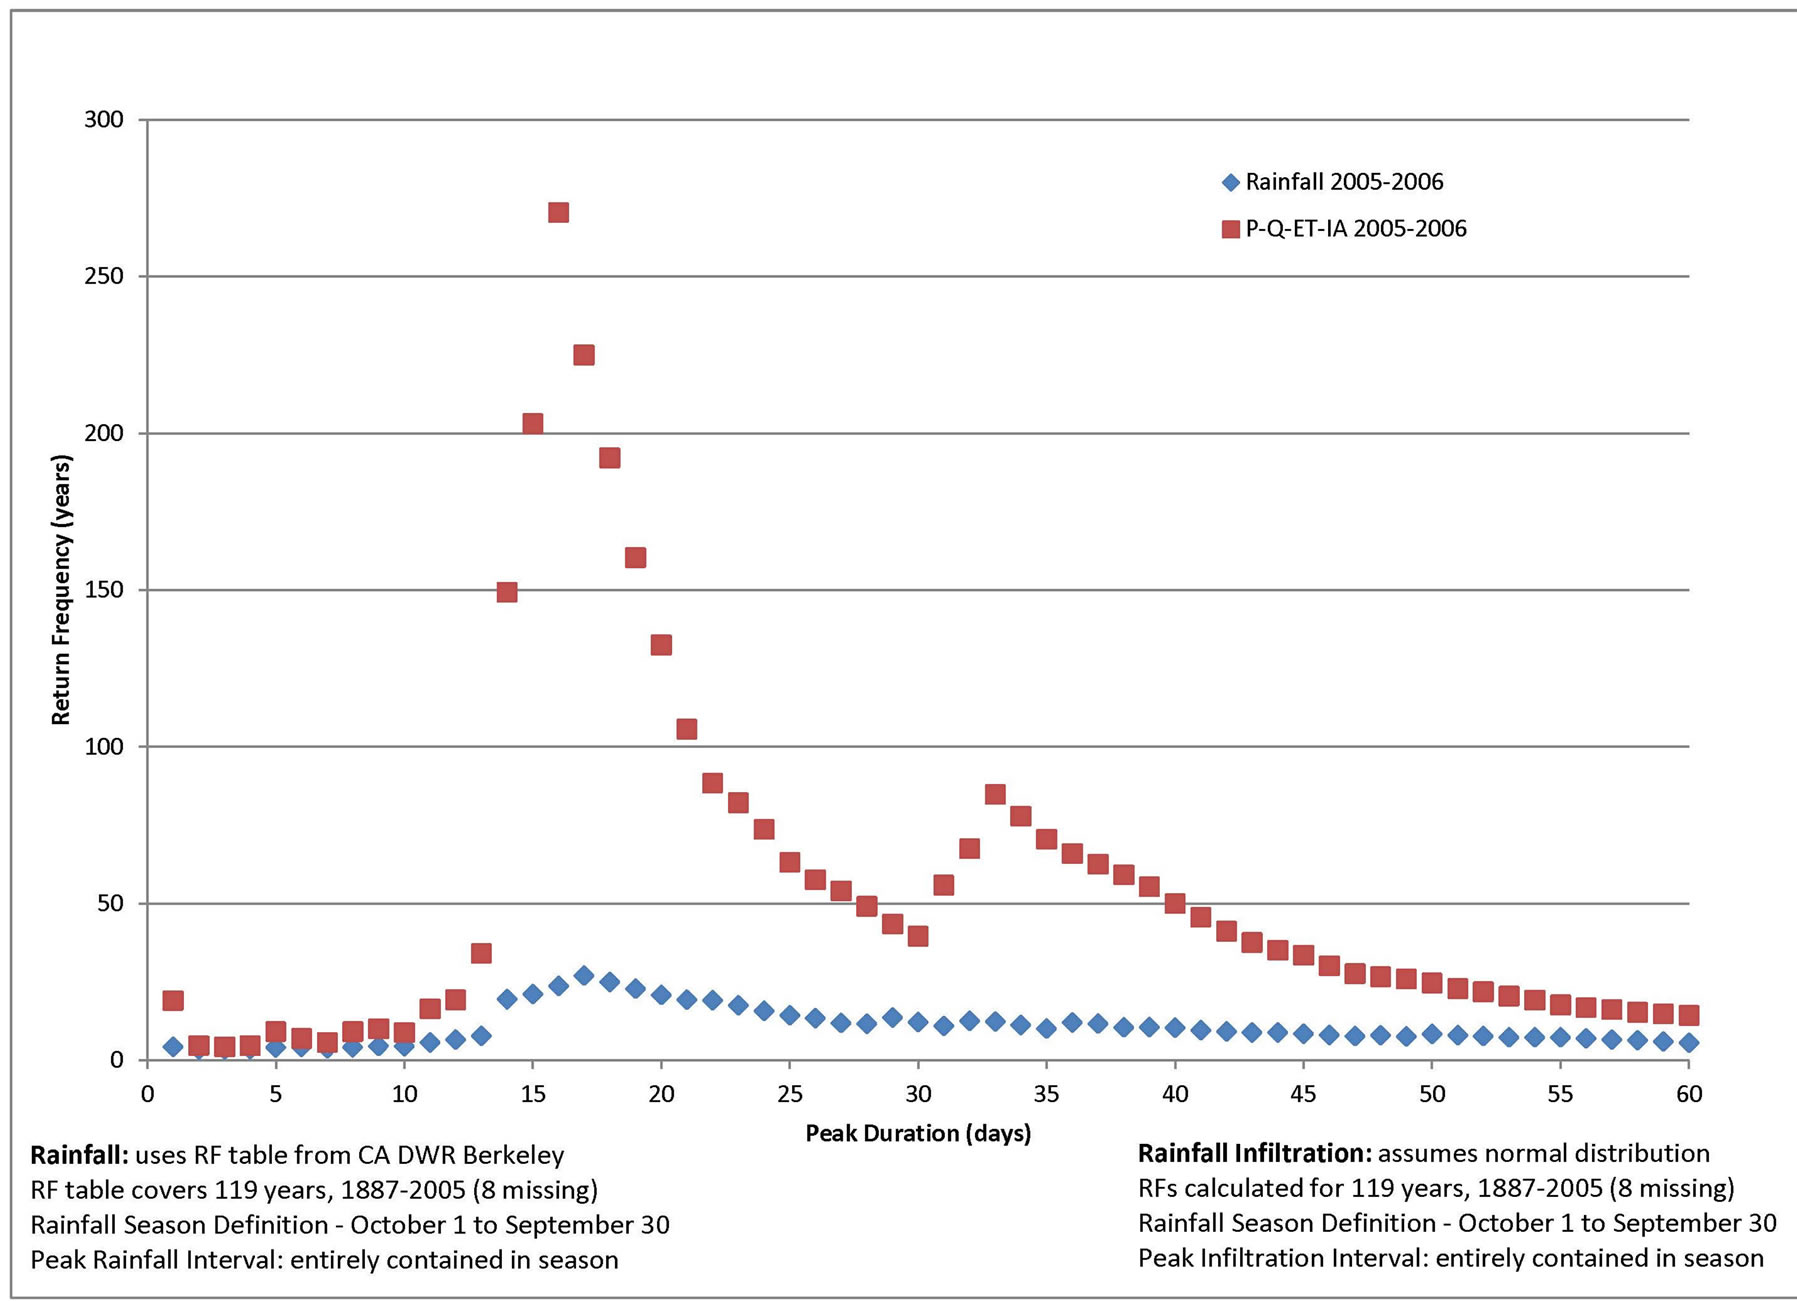
Figure 7. Gage 91 Rainfall and Infiltration (P-Q-ET-IA) Return Frequencies where P = rainfall (available from daily rain gage data), Q = runoff (estimated using the NRCS approach for the specified CN value and ARC), ET = evapo-transpiration, and IA = initial abstraction (estimated from the NRCS approach for the specified CN value and ARC) for n = depth-duration size (days).
common return frequency, with low rainfall intensities, resulting in a large proportion of the rainfall being subject to infiltration, resulting in an unusually large (with respect to the historic data) total infiltration of rainfall into the soil. From the statistical analysis of historic infiltration events (by examining all storms within the available daily rainfall record), a ranking of total infiltration occurring across all the durations plotted in the Figure show that the subject earth movement event can be associated with a very rare infiltration event even though the underlying rainfall event itself is of more common return frequency. From the same Figure, no other infiltration event for any duration stands out as a candidate as being a substantial cause for the subject earth movement event. Therefore, in further investigation of cause of the landslide (or other earth movement event), the identified duration of rainfall may be considered as a good candidate of rainfall whose infiltration into the soil resulted in reducing the relevant factor of safety for slope stability (or other earth movement) to less than a value of 1. Such further investigation may include (but by no means is limited to) the usual groundwater and infiltration models examining pore pressure distributions and related soil water accumulation factors.
The two plots shown in Figure 7 indicate a striking difference between the return frequency estimates of rainfall alone versus the estimate of rainfall infiltration as estimated using Equation (2) and the normal probability distribution to estimate return frequency values of estimated infiltration. For the subject situation, the duration of rainfall that had the highest return frequency value is 17 days, with an associated return frequency value of about 30 years. However, the estimate of infiltration using Equation (2) resulted in a duration of infiltration of 16 days with corresponding highest return frequency of over 250 years. The difference between these two return frequency values, for comparable durations, is explained by the delivery of the rainfall being of mild intensity, resulting in a high proportion of that rainfall being subject to infiltration into the soil. This observation may be made using the same diagram but for a duration of rainfall of one day where the corresponding return frequency corresponds to a common storm intensity. Given that most of the rainfall and also the estimated infiltration duration return frequency values corresponding to various durations are all associated with commonplace storm events, and given that the subject landslide event is of a rare occurrence, it is logical to question whether a common place return frequency infiltration duration event is less likely to be the substantial cause of the landslide than is the rare infiltration event estimated to have occurred for the peak 16 days as indicated in Figure 7. This type of analysis may be helpful for many situations in the assessment of the substantial cause of earth movement events where rainfall is assumed to be the underpinnings of the earth movement event itself. Furthermore, such an analysis may be undertaken for arbitrary durations of T-year return frequency infiltration events in the assessment of engineering designs contemplated in preventing similar earth movement events such as landslides and mud floods or other similar outcomes. Such a consideration is analogous to many aspects of flood control design analysis of flood control engineering works.
10. Discussion
Many earth movement events, such as landslides, mud floods, debris flows, and other such occurrences that are strongly associated with large volumes of rainfall and subsequent infiltration of rainfall, may be explained by use of the well-known rainfall threshold approach. Another approach to explaining such earth movement events is by the return frequency of the various peak duration rainfalls associated with these earth movement events.
For example, in [6], the landslide disaster at La Conchita, California that occurred on January 10, 2005 was analyzed and found to be well suited to such a rainfall duration assessment in terms of the return frequency of the associated rainfalls. For that earth movement event, the application of the rainfall infiltration return frequency method described in this paper was found to be useful to explain not only the year 2005 outcome but also prior earth movement events at the subject landslide location, including severe mass wasting in 1938. Again, as with the Example Application situation, it was not just the severity of the rainfall itself that best explains the occurrence of the earth movement events, but the “packaging” of the rainfall. That is, milder intensities of rainfall typically result in a larger proportion of the rainfall infiltrating into the soils, resulting in the situation that long duration “soaker” type rainfall events produce larger quantities of infiltrated rainfall into the soil, than do larger and more severe rainfall events of rare return frequency. In [6], a plot of duration size versus corresponding return frequency of rainfall showed that the durations of 10 through 30 days in size were particularly severe in rainfall quantities and of rare return frequency for the said La Conchita landslide (see Figure 8 herein, also seen as Figure 7 in [6]). Although such an analysis as shown in Figure 8 is useful to identify likely durations of rainfall that are causal in the subject earth movement event, assessing rainfall alone may not be as explanatory of the earth movement event as use of estimates of rainfall infiltration. This is because severe rainfalls do not necessarily infiltrate into the ground to become causal to an earth movement event, but instead may runoff the land surface to cause flooding events. Furthermore, the arrangement and timing of a large quantity of rainfall distributed over a multiple-day peak duration typically results in significantly different amounts of rainfall infiltration. High intense portions of
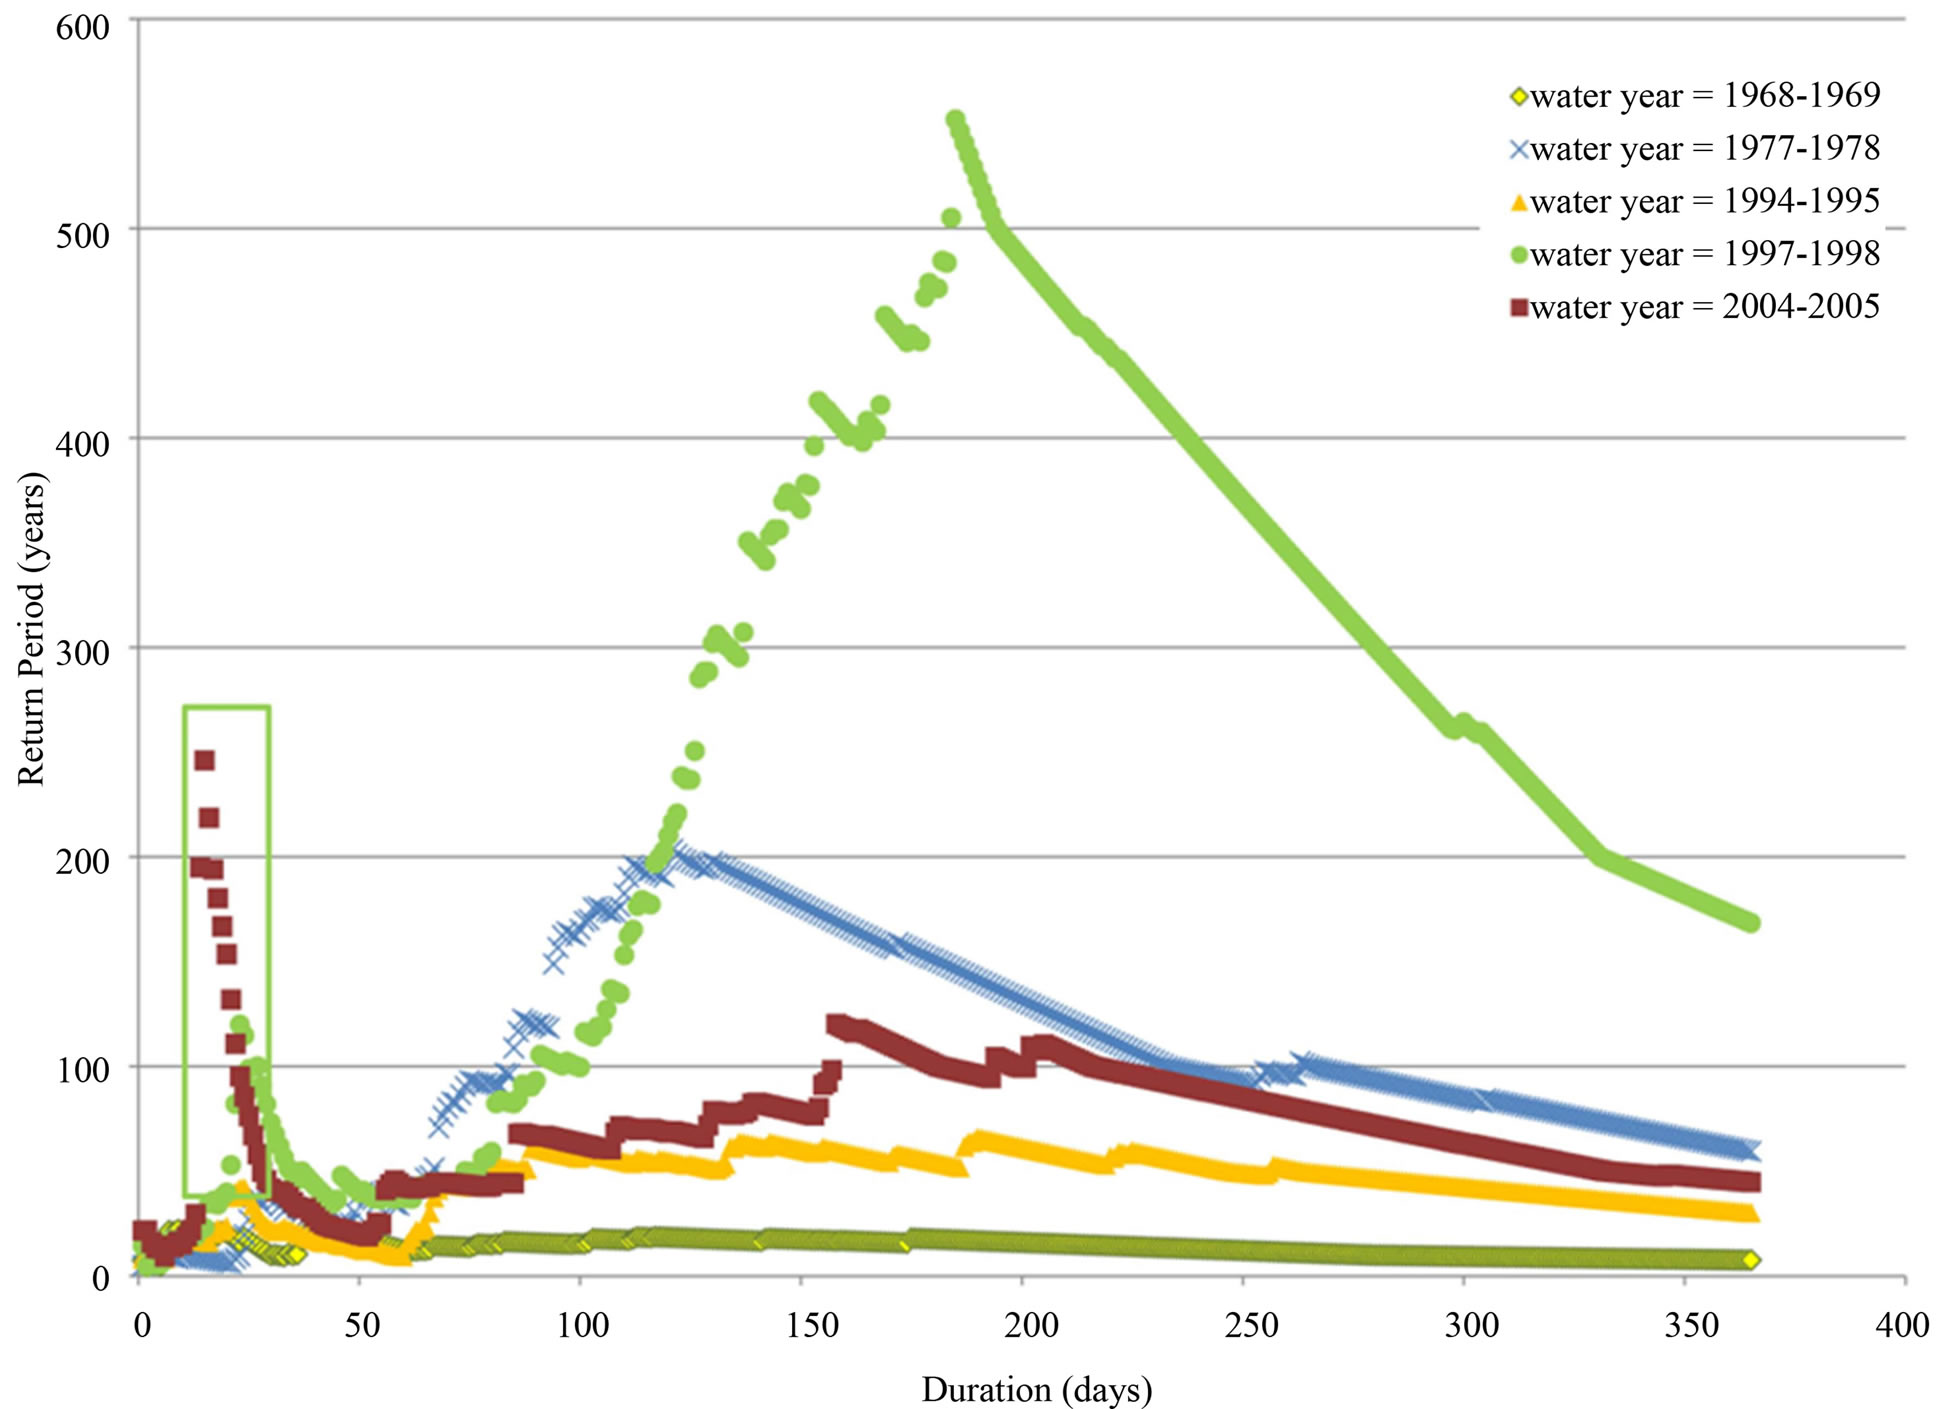
Figure 8. Return frequency estimates for la conchita landslide rainfall analysis.
rainfall tend to result in a larger proportion of the rainfall being runoff whereas a low intensity rainfall tends to become infiltrated rainfall.
Another issue is that of the frequency of occurrence of such earth movement events versus the frequency of occurrence of the causal rainfall infiltration, when rainfall infiltration is the substantial causal factor. Many areas where landslides occur oftentimes have a history of similar earth movement events, and therefore the frequency of occurrence of the historic events may generally be similar to the frequency of occurrence of the causal rainfall infiltration. The above procedure aids in assessing such nearcoincident frequencies.
Future research is needed on several topics including, but by no means limited to: 1) the sensitivity in rare return frequency predictions (e.g. 100-year, 200-year, etc.) of depth-duration infiltration estimates with respect to methodology used for estimating infiltration from rainfall data; 2) determination of underlying distributions, particularly skewed distributions, that may result for long depth-durations of infiltration; 3) use of smaller time intervals for determination of infiltration, such as hourly rainfall data, or 5-minute rainfall data from continuous rain gage recordings or Alert gages, among other small time intervals; 4) multiple year depth-durations, or durations such as 500-day, 1000-day, or longer, for estimation of long term depth-duration infiltration events; 5) application of the presented methodology to other than free draining soils conditions, including perched groundwater or groundwater table conditions, or conditions where soil non-homogeneity effects or anisotropic effects interfere with the free draining soils assumption. Other enhancements for further research include but are no means limited to: a) different infiltration models, b) different probability distribution functions used to fit the estimated infiltration duration outcomes, c) topics involving regionality of the infiltration estimates and also the return frequency estimates due to concerns regarding regional geologic properties, rainfall trends, vegetative trends, among other effects, and d) other topics that influence estimates of rainfall infiltration and the linkage between earth movement events and rainfall infiltration.
11. Conclusions
In this paper, a procedure is examined to estimate rainfall infiltration over a specified duration with a specified return frequency. A possible use of this procedure may be found in the risk analysis of engineering works designed to handle earth movement events, such as mud floods and landslides (among others). Similar to flood control engineering works designed to handle storm runoff events of a prescribed return frequency, instead of handling all possible flooding events, earth movement engineering works may be designed or analyzed with respect to a prescribed return frequency of rainfall infiltration, rather than handling all possible rainfall infiltration events. Additionally, when considering the use of the “rainfall threshold” in describing the occurrence of landslides [5,6], that rainfall threshold is associated with a rainfall infiltration, both effects being describable in terms of return frequency.
In this paper, depth-duration rainfall infiltration is estimated using a relationship based upon the commonly used National Resources Conservation Service (NRCS) Curve Number (CN) approach for estimating daily runoff. By examining the entire history of daily rainfalls from various rain gages located in California, the NRCS CN approach is used to develop estimates of daily runoff continuously through the gage record, and then estimates of infiltration are developed using the components of the CN relationship itself to isolate out the infiltration component of the overall water budget. (Other such infiltration estimation methodologies can be used instead of the CN approach used herein. However, an appropriate probability distribution may be developed that adequately describes the rainfall infiltration depth-duration trends estimated by the selected infiltration model, and therefore the concluded probability distribution may be infiltration model type dependent.) In order to assess uncertainty in infiltration estimates, use of several infiltration modeling analogs may be undertaken and their respective estimates similarly analyzed as described in this paper. Such displays of multiple modeling outcomes are becoming more commonplace in hydrology, meteorology (e.g. prediction of hurricane pathways over future time), among other topics. From the gage history of estimated daily infiltration, a depth-duration analysis is accomplished for all duration sizes from one day in length to 365 days in length (resulting in 365 separate depth-duration analyses). For any selected duration, the estimated infiltration quantities are ranked according to the maximum outcome of the selected duration, with one infiltration outcome for each year, resulting in N “annual” depth-duration estimates of infiltration for a gage record of N years in length. These annual outcomes are then analyzed as to a possible underlying probability distribution by considering various distributions. It is concluded that for the rain gages considered in the current analysis, and for using the CN approach to estimate infiltration quantities as shown in the paper, that the depth-duration infiltration estimates may be distributed normally or log-normally. From the fitted probability distributions, estimates of rare events of infiltration into soil can be made. Furthermore, possible linkage to earth movement events may be made with respect to such estimates of return frequency of infiltration, which in turn can aid in the design and risk assessment of fixed works involving soil water accumulation, such as landslide protection measures, among others. It is envisaged that this approach to infiltration assessment may supplement other approaches such as the Rainfall Threshold approach to analyzing the risk of landslides and similar earth movement events.
12. Acknowledgements
The authors acknowledge the Department of Mathematical-Sciences at the United States Military Academy, New York, for supporting faculty research in inter-disciplinary topics, among other opportunities and support as well as the academic resources available through the department of the Army and the USMA. The authors also acknowledge the Department of Civil Engineering, California State University, Fullerton, for their continued faculty support towards research efforts and associated academic resources.