Natural Science
Vol.4 No.1(2012), Article ID:17030,11 pages DOI:10.4236/ns.2012.41009
Thermal and structural studies of poly(vinyl alcohol) and hydroxypropyl cellulose blends
![]()
Biophysics Department, Faculty of Science, Cairo University, Cairo, Egypt; osiris_wgr@yahoo.com, manal_adnanland@yahoo.com
Received 27 July 2011; revised 28 August 2011; accepted 10 September 2011
Keywords: Poly(Vinyl Alcohol) (PVA); Hydroxypropyl Cellulose (HPC); Differential Scanning Calorimetry (DSC); Thermogravimetric Analysis (TGA); X-Ray Diffraction (XRD)
ABSTRACT
Polymers and polymeric composites have steadily reflected their importance in our daily life. Blending poly(vinyl alcohol) (PVA) with a potentially useful natural biopolymers such as hydroxypropyl cellulose (HPC) seems to be an interesting way of preparing a polymeric blends. In the present work, blends of PVA/HPC of compositions (100/0, 90/10, 75/25, 50/50, 25/75, and 0/100 wt/wt%) were prepared to be used as bioequivalent materials. Thermal analyses [differential scanning calorimetry (DSC) and thermogravimetric analysis (TGA)], and X-ray diffraction (XRD) were employed to characterize and reveal the miscibility map and the structural properties of such blend system. The obtained results of the thermal analyses showed variations in the glass transition temperature (Tg) indicating the miscibility of the blend systems. Moreover, the changes in the melting temperature (Tm), shape and area were attributed to the different degrees of crystallinity and the existence of polymer-polymer interactions between PVA and HPC molecules. The X-ray diffraction (XRD) analysis showed broadening and sharpening of peaks at different HPC concentrations with PVA. This indicated changes in the crystallinity/amorphosity ratio, and also suggested that the miscibility between the amorphous components of homo-polymers PVA and HPC is possible. The results showed that HPC doped in PVA film can improve the thermal stability of the film under investigation, leading to interesting technological applications.
1. INTRODUCTION
In recent years, copolymers and their blends have attracted the attention of material researchers to obtain intermediate properties with respect to homo-polymers for some specific functions. These interesting properties are attributed to the molecular motions in their amorphous phases. The interphase regions in blends and copolymers are very important depending on the chemical nature of the doping substances and the type and extent in which they interact with host matrix.
Poly(vinyl alcohol) (PVA; -[-CH2-CHOH-]n-) is the world’s largest volume synthetic polymer produced for its excellent chemical resistance and physical properties and complete biodegradability, which has led to broad practical applications. PVA is a semi-crystalline polymer whose crystalline index depends on the synthetic process and the physical aging [1,2]. PVA is a water-soluble polyhydroxy polymer, one of the few linear, non-halogenated aliphatic polymers. PVA has a two dimensional hydrogen-bonded network sheet structure. The physical and chemical properties of PVA depend to a great extent on its method of preparation.
Poly(vinyl alcohol) could be considered as a good host material due to good thermo-stability, chemical resistance and film forming ability. PVA is an important material in view of its large scale applications. It is used in surgical devices, sutures, hybrid islet transplantation, implantation, blend membrane and in synthetic cartilage in reconstructtive joint surgery [3-6]. A new type of soft contact lens was developed from PVA hydrogel prepared by low temperature crystallization technique [7]. PVA is also used in sheets to make bags for premeasured soap, for washing machines or the longer bags used in hospitals [8].
Hydroxypropyl cellulose (HPC) belongs to the group of cellulose ethers which has been used already for a year by paper of conservators as glue and sizing material. The material is soluble in water as well as in polar organic solvents (makes it possible to combine aqueous and non aqueous conservation methods) [9]. HPC is used as a topical ophthalmic protectant and lubricant; as a food additive; a thickener and as an emulsion stabilizer with E number E463. In pharmaceuticals, HPC is used as a disintegrant and is a commonly used binder for the wet granulation method of making tablets [10].
In the present work, samples of poly(vinyl alcohol) (PVA), hydroxypropyl cellulose (HPC) and their blends (PVA/HPC) in different weight percents (100/0, 90/10, 75/25. 50/50, 25/75, and 0/100 wt/wt%) were prepared in the form of thin films. Thermal analyses [differential scanning calorimetry (DSC) and thermogravimetric analysis (TGA)] and X-ray diffraction (XRD) techniques were employed to characterize and reveal the miscibility map and the structure property relationship of such blend system.
2. EXPERIMENTAL SETUP
2.1. Materials and Samples Preparation
The PVA granules with molecular weight of 125 kg/mol were supplied from El-Nasr Company, Cairo, Egypt. Hydroxypropyl methylcellulose (HPC; Pharma-coat 606) with molecular weight of 95 kg/mol was supplied by Shin Etsu Chemical Co., Japan.
The solution method [11,12] was used to obtain film samples. This method depends on the dissolution, separately, the weighted amounts of PVA granules and HPC powder in double-distilled water. Complete dissolution was obtained using a magnetic stirrer in a 50˚C water bath to prevent thermal decomposition of polymer. To prepare thin films of the homopolymers (PVA and HPC) and the blend of their samples (PVA/HPC) with different weight percentages 100/0, 90/10, 75/25, 50/50, 25/75, and 0/100 wt/wt%, the solutions were mixed together at 50˚C with a magnetic stirrer. Thin films of appropriate thickness (about 0.01 cm) were cast onto stainless steel petri dishes (10 cm diameter). The prepared films were kept at room temperature (about 25˚C) for 7 days until the solvent completely evaporated and then kept in desiccators containing fused calcium chloride to avoid moisture.
2.2. Differential Scanning Calcorimetry (DSC)
The thermal transition behaviour of the prepared thin films was determined by Differential Scanning Calorimeter model Schimadzu DSC-50 (Kyoto, Japan) from 20˚C to 300˚C. A heating rate of 10˚C/min was used under nitrogen atmosphere and at a flow rate of 30 mL/min. The sample weight was about 1.987 mg.
2.3. Thermogravimetric Analysis (TGA)
Thermal behaviour of the prepared samples was examined by Thermogravimetric Analyzer model Schimadzu TGA-50H (Kyoto, Japan) from 20˚C to 400˚C. A heating rate of 10˚C/min was used under nitrogen atmosphere and at a flow rate of 20 mL/min. Dry sample weighing about 1.596 mg was used. The standard uncertainty of the sample mass measurement is ±1%. The instrument was calibrated using calcium oxalate which was supplied along the instrument.
2.4. X-Ray Diffraction (XRD)
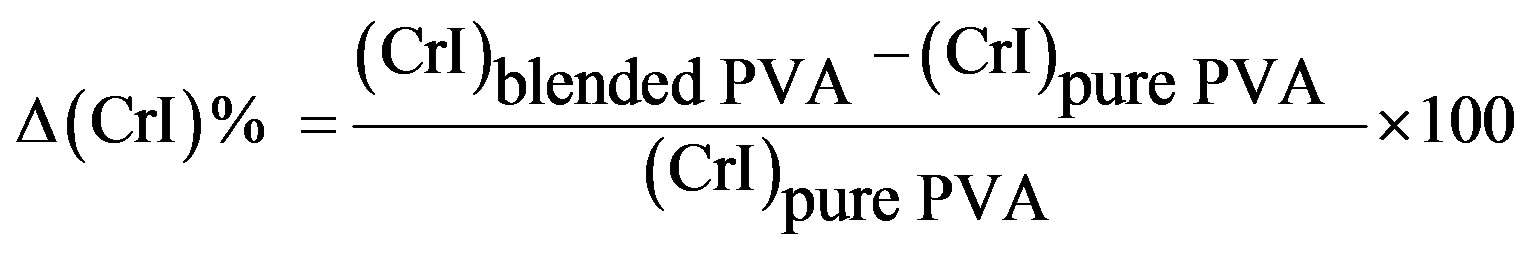
The X-ray diffraction (XRD) measurements of the samples were recorded with a Scintag Irc X-Ray Diffractometer (USA) equipped with Ni-filtered CuKα radiation (λ = 1.5418 Å) and operated at 45 kV and 40 mA. The diffractograms were recorded in the range of 2θ from 3 to 50˚ at a speed rate of 2 degrees/min. The crystallinity index (CrI) was calculated for the different samples using the relation [13]
CrI = [(If – Is)/If] × 100(1)
where If is the peak intensity of the fundamental band at 2θ = 18.5˚ - 20.0˚ and Is is the peak intensity of the secondary band at 2θ = 28.0˚ - 28.5˚. The CrI is a time-save empirical measure of relative crystallinity.
3. RESULTS AND DISCUSSION
3.1. Characterization of PVA/HPMC Blends
3.1.1. Differential Scanning Calorimetry (DSC)
Differential scanning calorimetry (DSC) technique provides information such as glass transition (Tg), melting (Tm) and crystallization (Tc) temperatures, in addition to the associated enthalpy for each process. Figure 1 shows the DSC curves of PVA (a) and HPC (f), homopolymers in the range of temperature from 20˚C up to 300˚C. The pure PVA (curve a) displays two endothermic peaks. The first peak at 88.1˚C is assigned as a thermal effect due to moisture evaporation from the sample and also may be due to a glass transition with an enthalpy 130.9 J/g [11] and a sharp endothermic melting transition at 209.6˚C with an enthalpy 67.4 J/g. The heat, required for melting of 100% crystalline PVA, is 138.60 J/g [14]. It is well known that the calorimetric crystalline is defined as
 (2)
(2)
where  is the weight fraction extent of crystallinity;
  is the enthalpy of fusion at the melting point, Tm and
  is the enthalpy of fusion of the totally crystalline polymer measured at the equilibrium melting point
 . The nominal value of crystallinity, obtained from the DSC curve of pure PVA, is about 48.61%. This value is slightly, relatively, higher than that found by X-ray measurement [47.17%, Table 3] which may be due to changes in the thermodynamic heat of fusion from small crystals in DSC, whereas X-ray diffraction may require a large crystallite size and longer range order. Moreover, the broad glass transition peak is apparently a result of the non-uniform nature of this process. DSC technique has been performed to observe the change in transition temperature that is caused by the doping [15]. The value of Tg (88.1˚C), which has been obtained for PVA, is nearly in agreement with that reported previously in the literatures [16,17]. However, the value obtained for Tm (209.6˚C) is consistent with that found by Sakellariou et al. [18].
The DSC thermogram for pure HPC (curve f) shows only a small broad peak at about 83.9˚C associated with heat of fusion 32.62 J/g.
It is interesting to show how the thermal transition of PVA varies after doping the different concentrations of HPC. One key aspect is the determination of whether the resulting blend samples results miscible or not [19,20].
Figure 1, also, represents the DSC curves for PVA/HPC blended samples. The transition temperature and the heat of fusion (ΔH, J/g) values associated with each transition obtained through analyses of DSC-curves for blend samples are summarized in Table 1. It is clear that, the DSC thermograms of all blend samples of PVA/HPC (curves b-e) show one single broad glass transition peak (Tg) of which increases with increasing HPC content up to 50 wt%. Then, a decrease in Tg value is detected by increaseing HPC content for the blend sample 25/75 wt/wt%. The values of Tg obtained in the blend systems, are found to be in the range of those of the homopolymers indicating the miscibility of the blend systems. The broadening of the peaks depends on the OH content declined. The PVA hydroxyl groups are highly interconnected by hydrogen bonding, leading to high glass transition temperatures (Tg). The introduction of other functional groups may support this bonding and enhance Tg values to maximum in the 50/50 wt/wt% blend samples. In addition, the transition temperature widths (Tg) for the blends are almost identical to that of pure components (curves a and f) which supports single-phase behaviour in the blends.
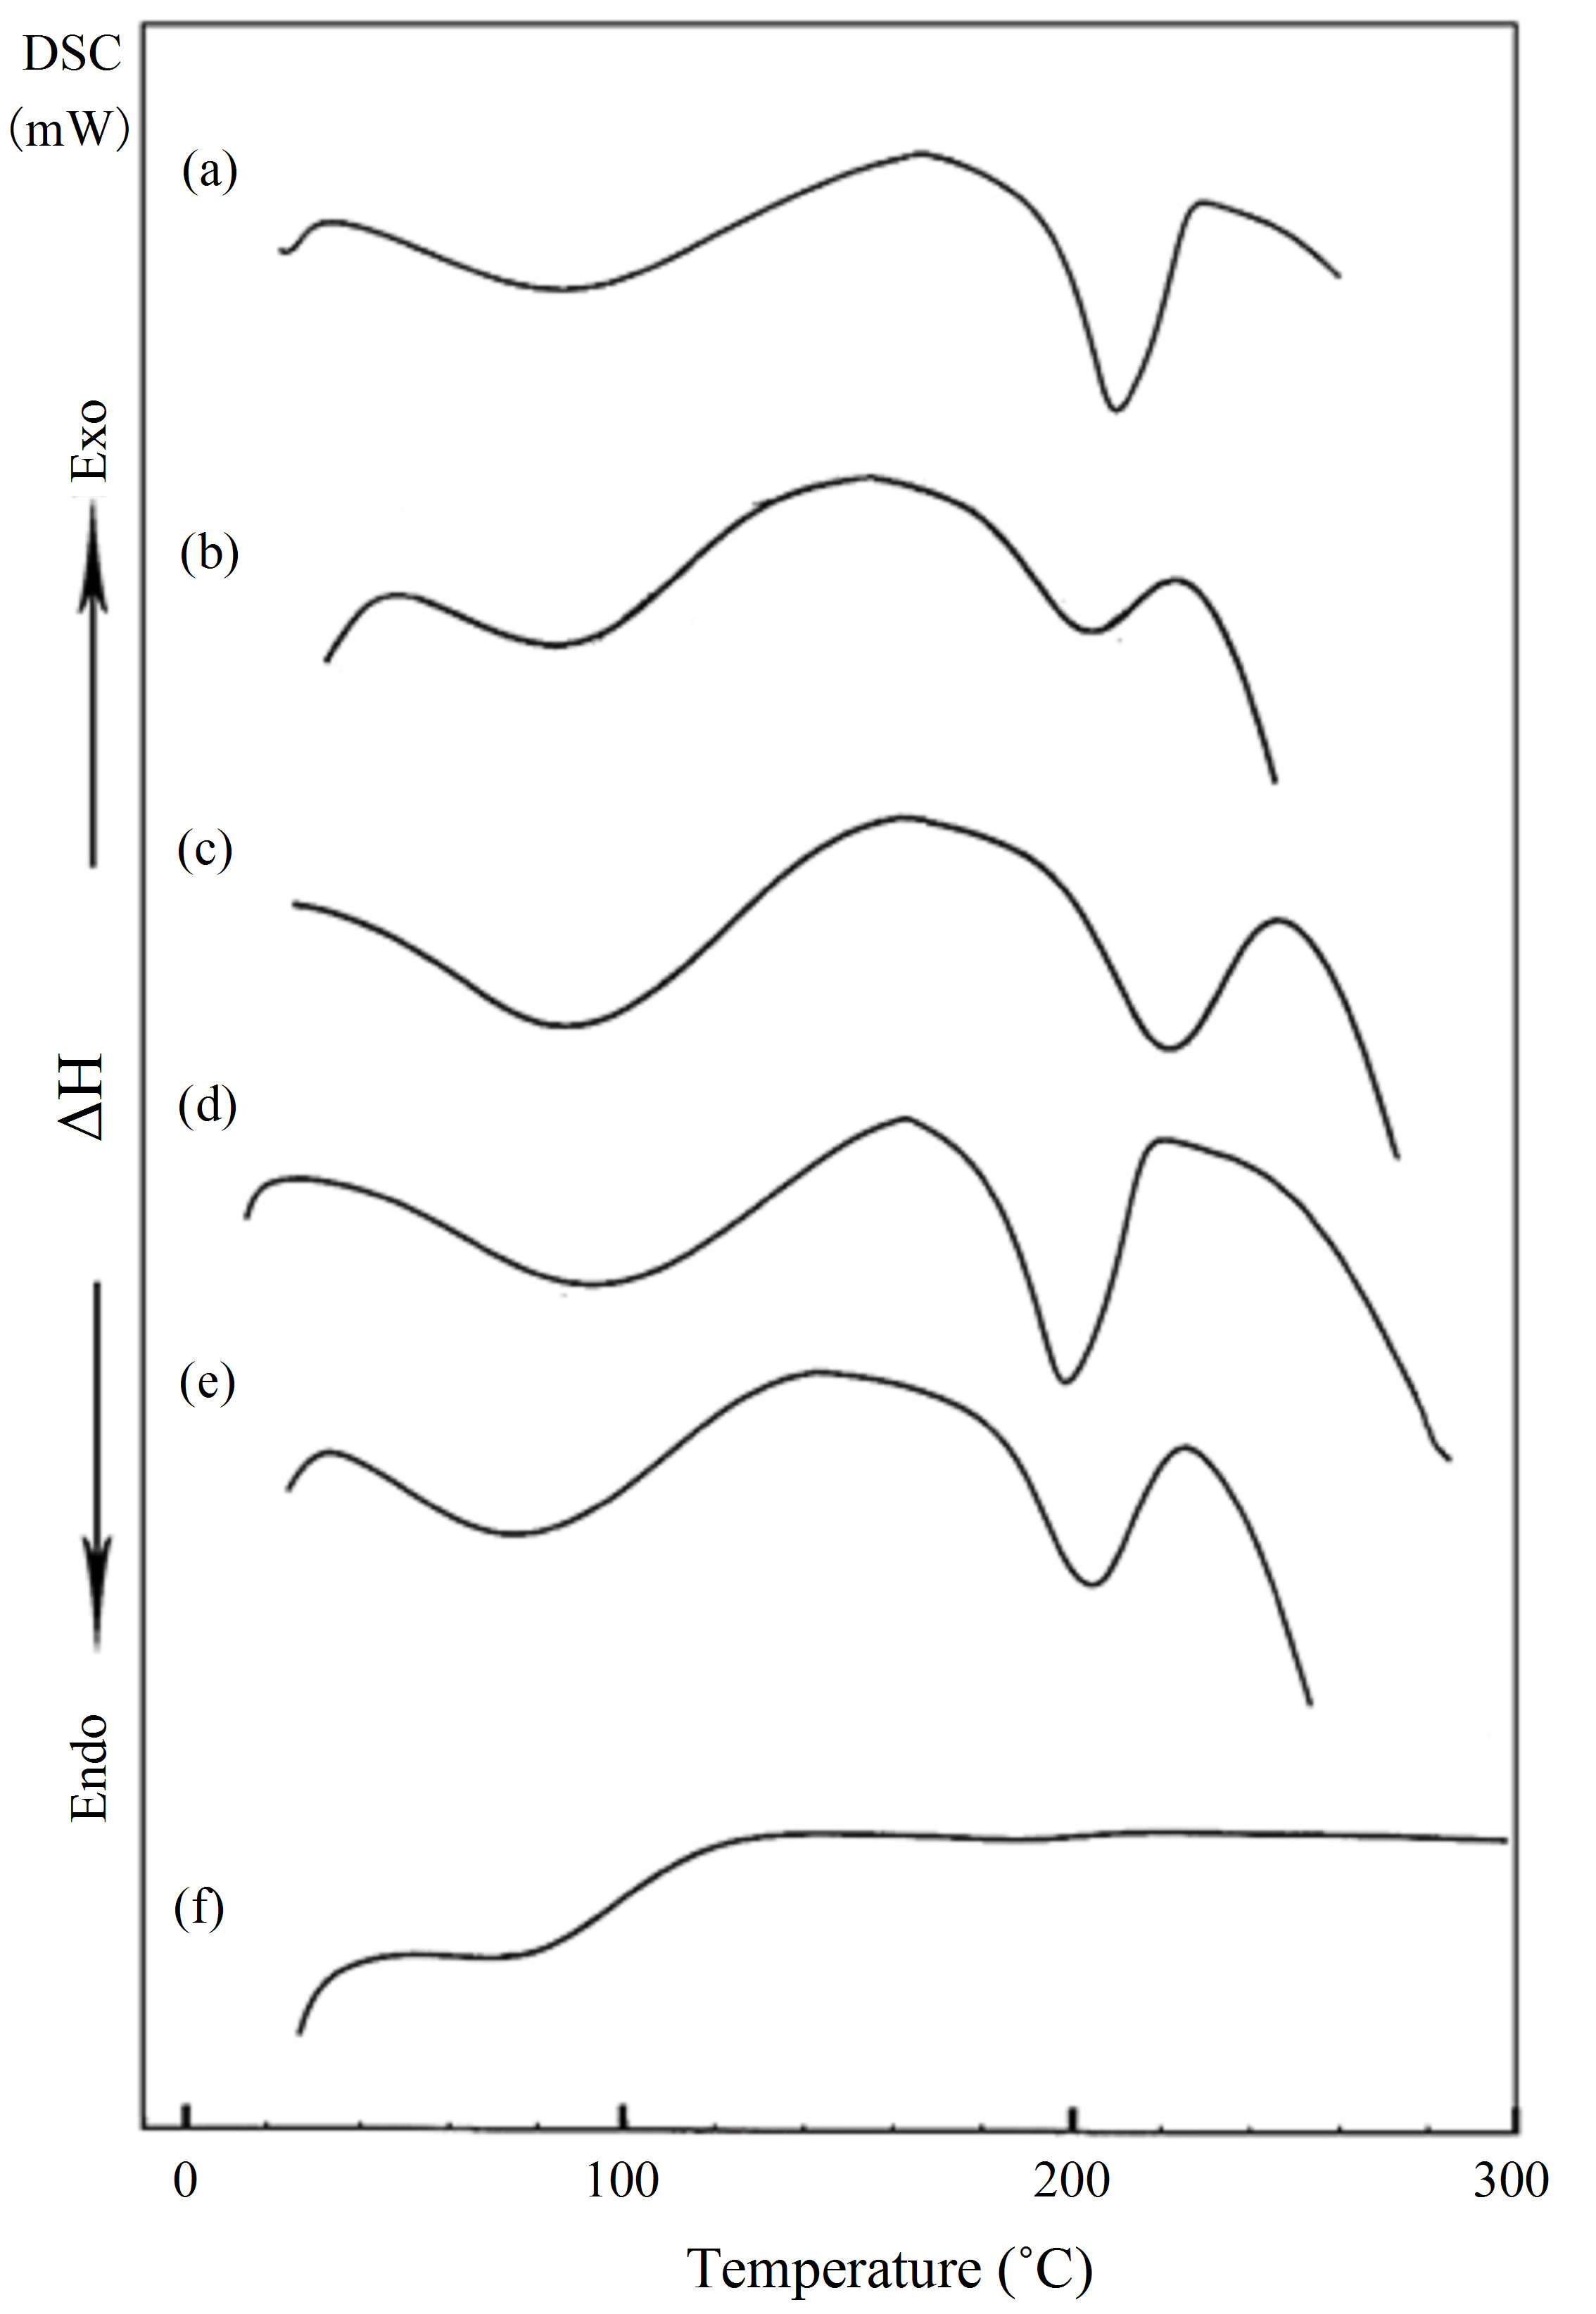
Figure 1. DSC curves for PVA/HPC blends: (a) 100/0; (b) 90/10; (c) 75/25; (d) 50/50; (e) 25/75 and (f) 0/100 (wt/wt%).
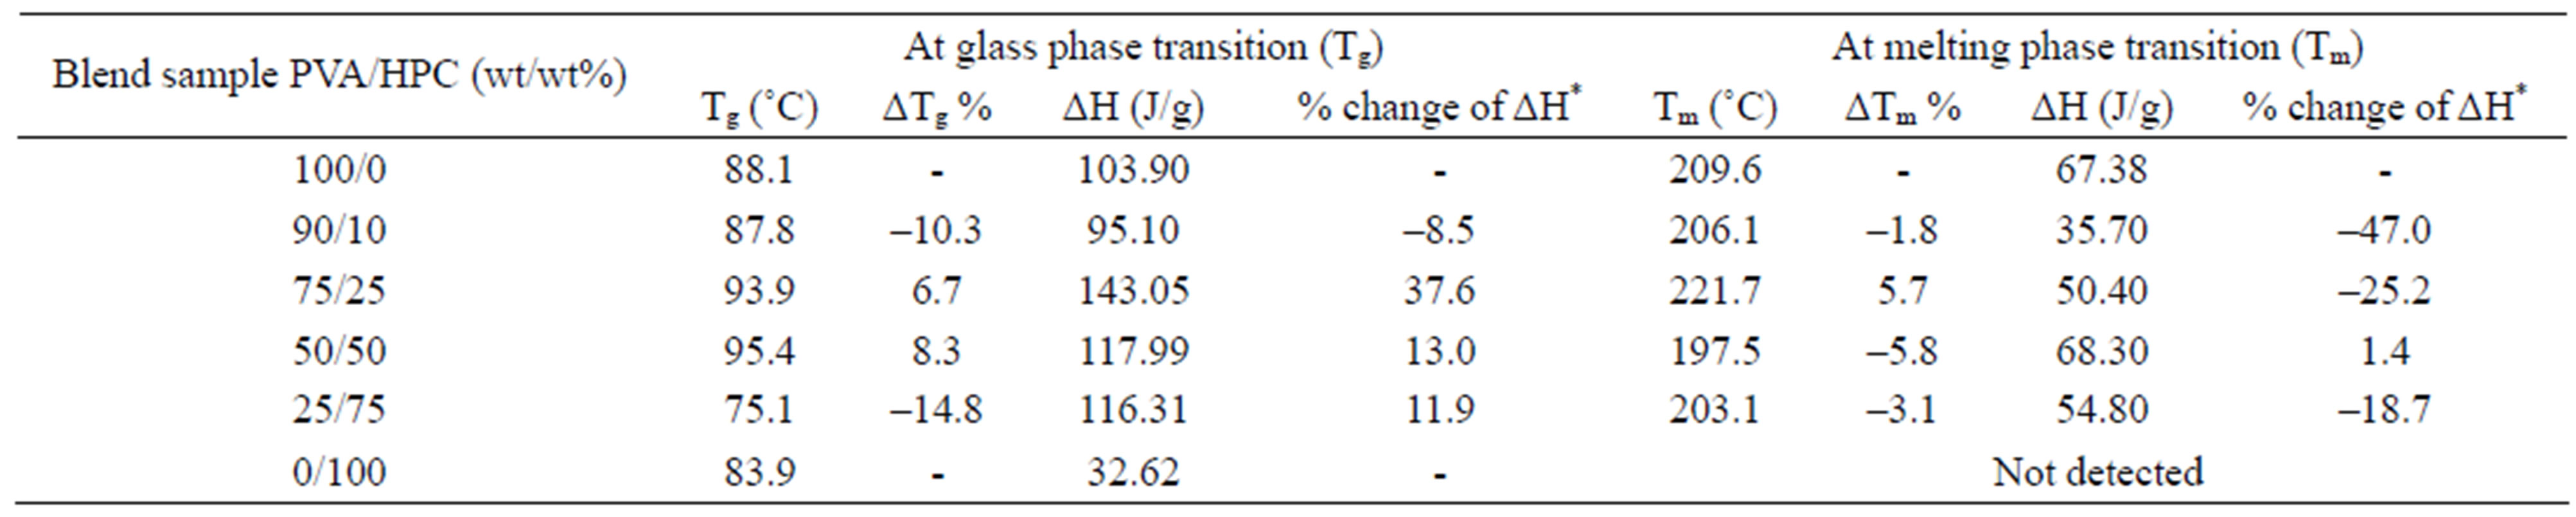
Table 1. Values of transition temperatures and associated heat of fusion for PVA/HPC blends.
* .
.
Differences in shape and area of the melting endotherm are also noticed. The melting point is a physical parameter used to identify the nature of the substance and its degree of purity. The data in Table 1 indicates that the melting points (Tm) for the blend samples are nearly around the value of PVA. The variations in shape and area were attributed to the different degrees of crystallinity found in the samples with different HPC concentrations [21,22]. The decrease in heat of fusion and increase in Tm suggested that the crystallinity and perfection of the crystal structure are reduced with increasing degree of cross-linking. As well known by the previous reported work, a change in the crystalline structure may result from polymer-polymer interactions in the amorphous phase, therefore, disorder in the crystals is created, reducing the enthalpy of the phase change [23,24].
3.1.2. Thermogravimetric (TGA) and Its Derivative (DrTGA) Analyses
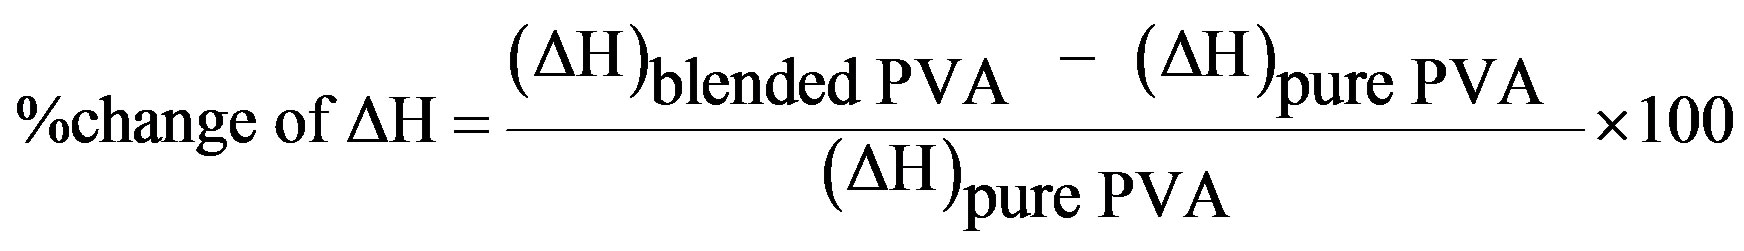
3.1.2.1. Effects of Thermal Gravity Analysis Condition on Samples’ Decomposition Thermal degradation behavior of PVA and HPC homopolymers is examined by thermogravimetric analysis (TGA) as shown in Figure 2. The PVA (curve a) and HPC (curve f) homopolymer samples show 8.988 and 5.691% weight loss (first stage), beginning at about 20˚C, followed by thermal stability (second stage). More significant loss by about 51.159% and 80.474% weight loss for PVA and HPC homopolymers starting above 205˚C and 220˚C, respectively, are detected.
The TGA curves for PVA/HPC blend samples are also shown in Figure 2. It is clear that, the recorded themogravimetric plots for all samples show two degradation regions which suggest the coexistence of more than one degradation process. It is also clear Figure 2 that, all tested samples show % weight loss (12.490 - 2.547) for the first decomposition stage and more significant % weight loss (52.108 - 80.611) for the second decomposition stage of PVA/HPC blend.
Figure 3 represents the deviation of the % weight loss for PVA/HPC blend samples for the first and second decomposition regions as well as the total weight loss. The change in weight loss reaches its maximum value at 75 wt% HPC approximately the value of the pure HPC sample. This means that 25/75 wt/wt% PVA/HPC blend sample becomes more thermally stable.
The lower values of % weight loss in the first stage affirm the presence of a thermal process due to moisture evaporation from samples and also may be due to splitting or volatilization of small molecules and/or monomers in which weight loss varies between 2.5% and 12.4% and begins at near 20˚C. This lower value of weight loss enables one to suggest that the transitions observed in the corresponding temperature range of the earlier DSC spectra explain the existence of physical transition [4]. The latter process in TGA curves covers a wider temperature range (180˚C - 400˚C), which includes the melting points, as physical transition and the degradation temperatures of homopolymers. Therefore, the higher values of weight loss in the second decomposition stage indicate the existence of a chemical degradation process resulting from bond scission (carbon-carbon bonds) in the polymeric backbone. The degradation behavior of the blend films is intermediate between that of the pure components. It must be noted that the sample of composition 25/75 wt/wt% PVA/HPC presents a high strength of the bonding in these polyblend systems due to cross-link formation, since little amounts of weight loss in the first decomposition region are recorded.
On the other hand, the lower temperature loss (i.e., the first stage) may have corresponded to the breaking of the ester linkages, and the second may have corresponded to the degradation of the whole polymer. The second loss is the most important both in the rate of weight loss and in the total weight loss. If PVA is heated above 120˚C water is eliminated to give conjugated double bonds, and it may give a formation of ether cross-links; i.e., on heating PVA above the decomposition temperature, the polymer starts a rapid chain-stripping elimination of H2O [25].
The difference in thermal decomposition behavior of different PVA/HPC blend samples can be seen more clearly from the derivative thermogravimetric (DrTGA)
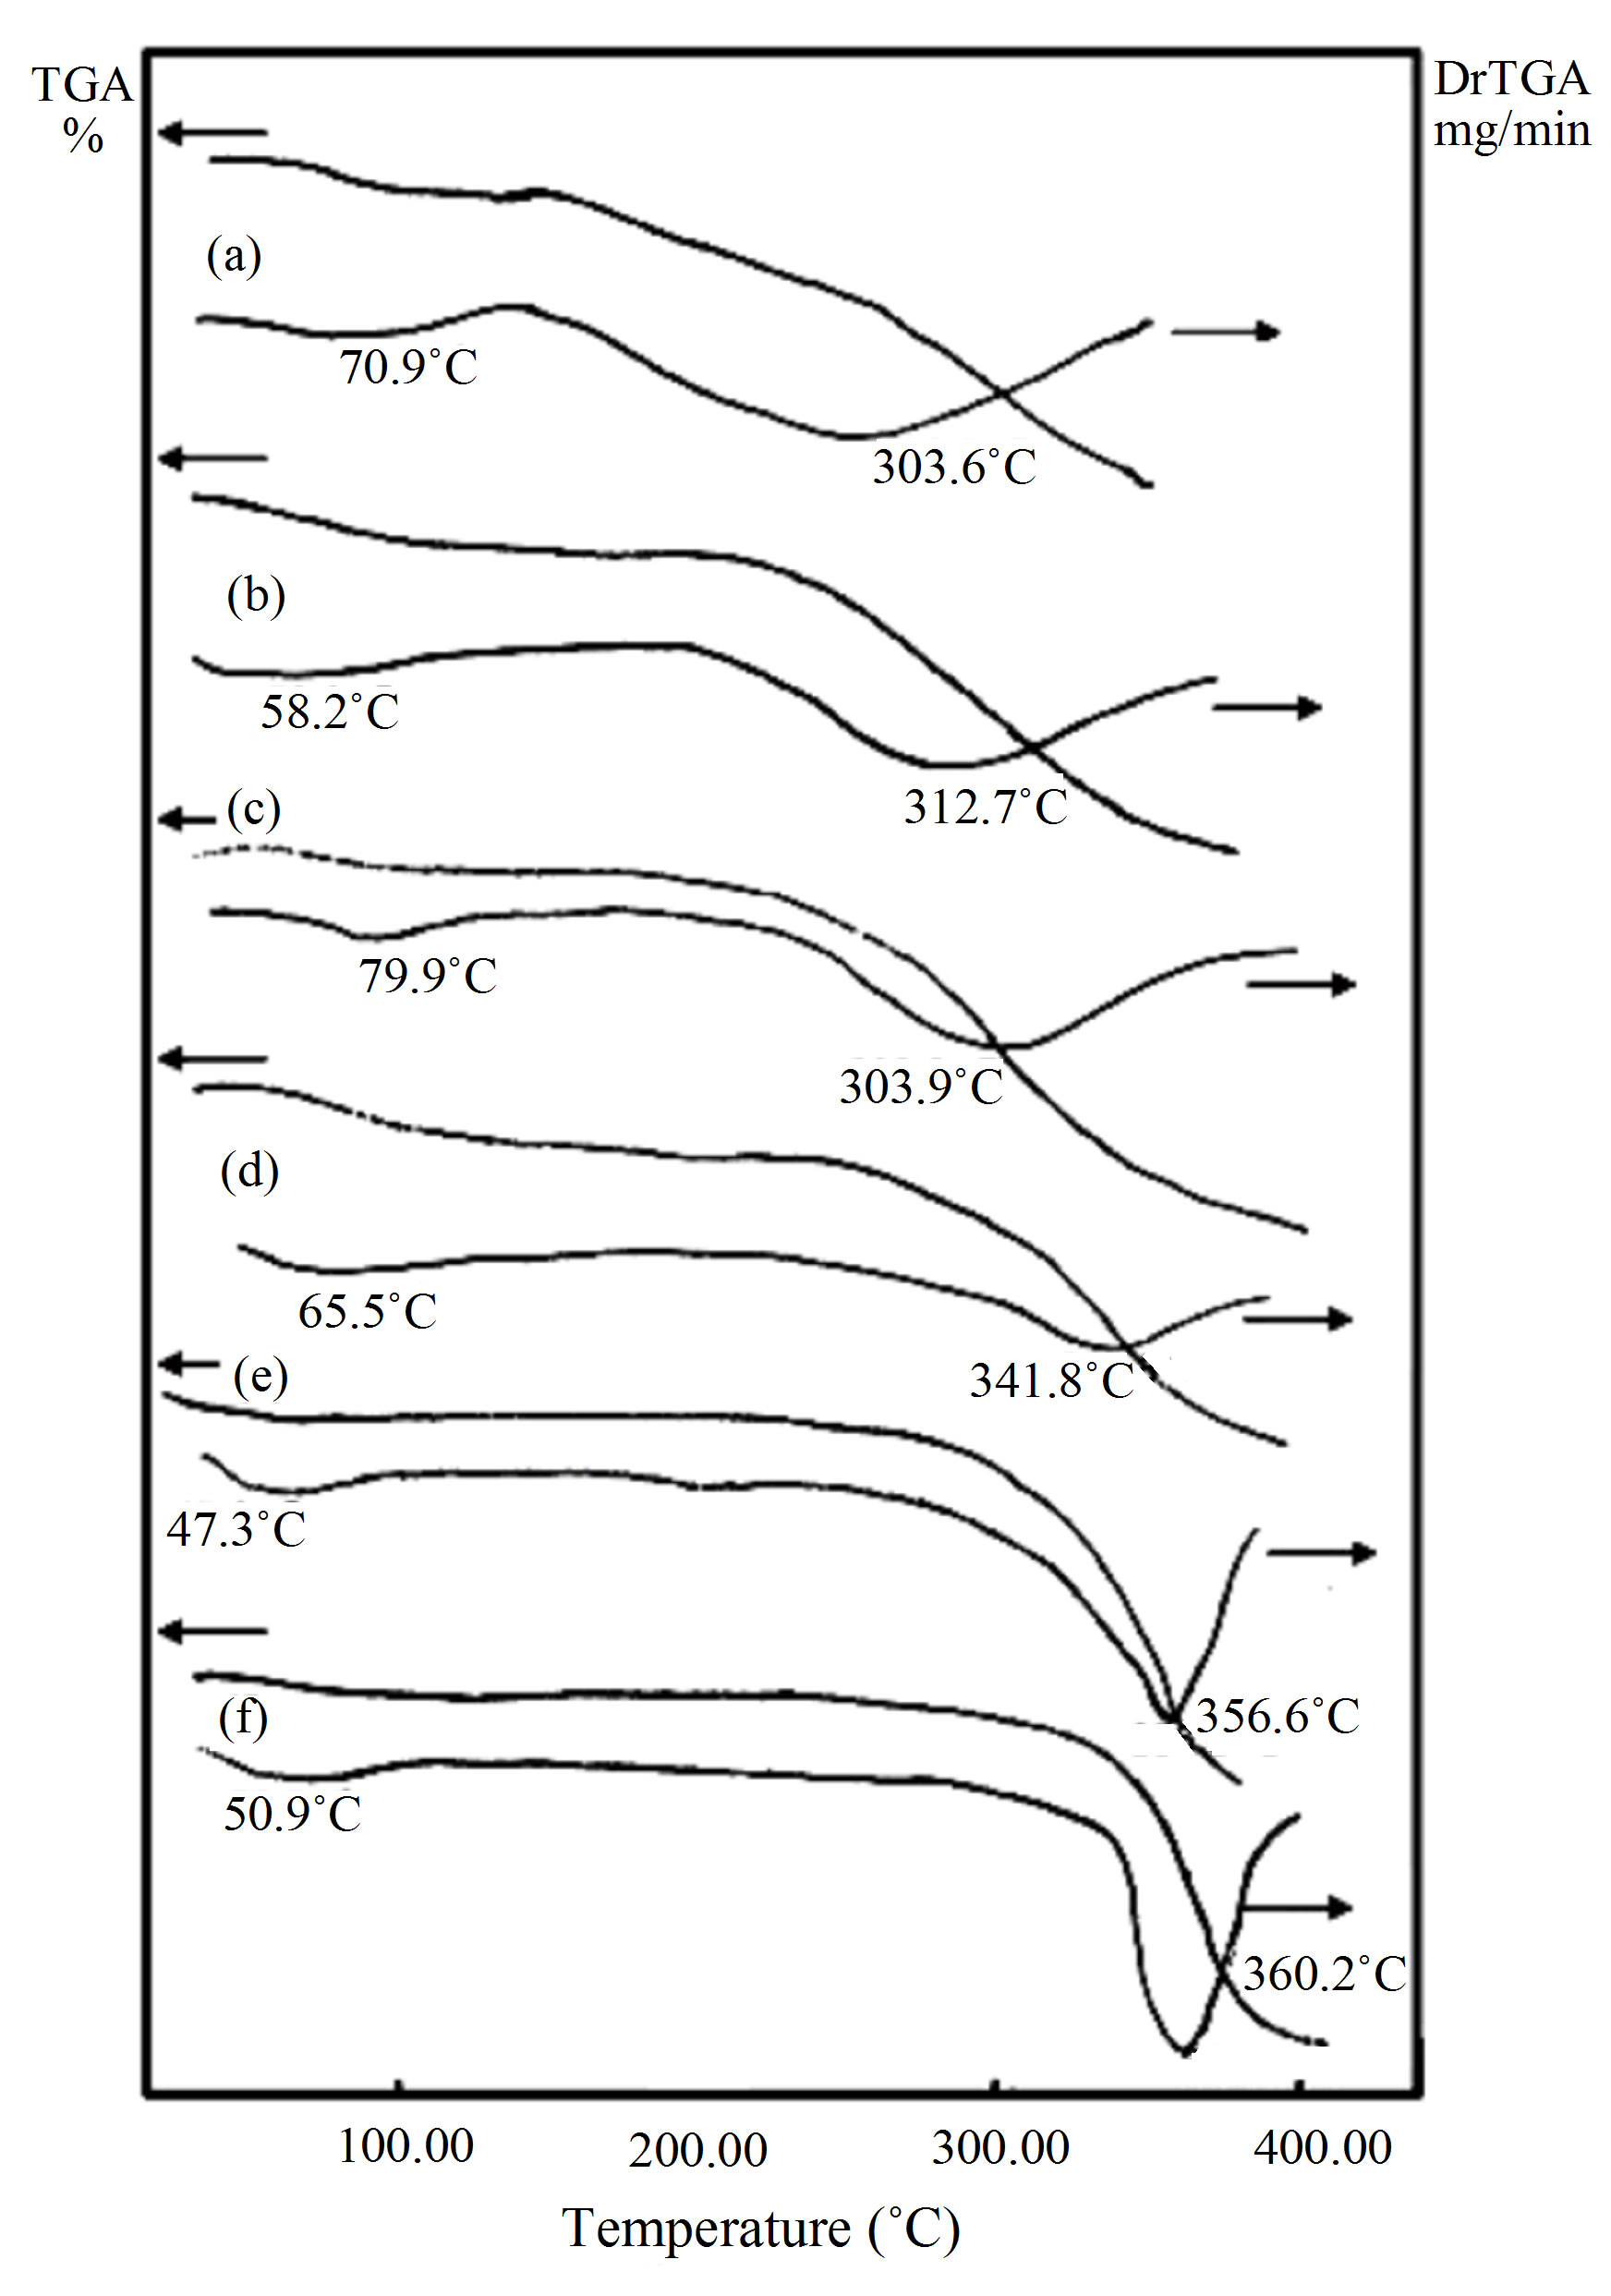
Figure 2. TGA and DrTGA curves of PVA/HPC blends: (a) 100/0; (b) 90/10; (c) 75/25; (d) 50/50; (e) 25/75 and (f) 0/100 (wt/wt%).
Figure 3. Variation in % weight loss for PVA/HPC blends: (■) First stage, (●) second stage and (▲) total % weight loss.
curves shown in Figure 2. DrTGA curves show two broad peak temperatures corresponding to the first and second decomposition regions. It is to be noted that, the peak temperatures of DrTGA curves in both decomposition regions for PVA/HPC blend samples varied from the pure PVA one with increase of HPC concentrations. This indicates that the thermal stabilities of HPC increase by mixing it with PVA. This stability enhances its use for commercial applications for item production via melt processing techniques.
3.1.2.2. Kinetics of Thermal Decomposition The thermal decompositions curves of three temperature rising rates were almost show the same trend. The following equation was used for the kinetic analysis according to the integral method of Coats and Redfern (CR) for non-isothermal thermogravimetric analysis (TGA) data when a first-order is assumed [26,27]
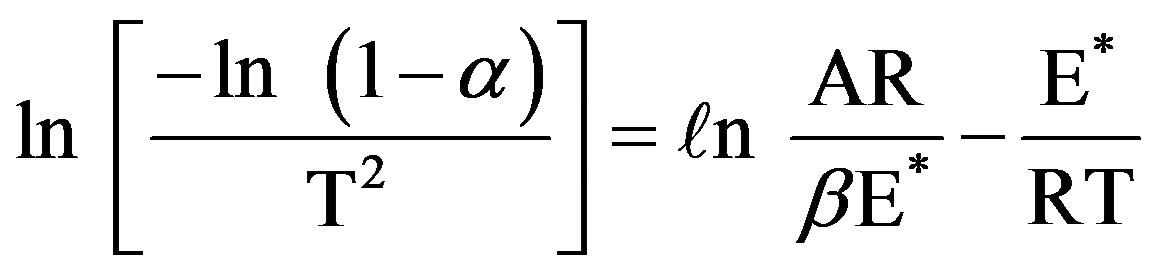 (3)
(3)
where α is the fraction of sample decomposed at time t (the mass loss up to the temperature T), T the temperature (Kelvin), A the pre-exponential factor (Arrhenius constant), R the gas constant, E* the activation energy and β the conversion factor to transfer from a time scale to a temperature scale (the linear heating rate). Plotting of the left hand side of Eq.3 against 1/T gives E* from the slope.
From the relevant data, linearization plots have been drawn in Figures 4 and 5 confirm first order kinetics. Figures 4 and 5 represent the Coats-Redfern (CR) plots of the first and second decomposition regions for PVA/HPC blend samples, respectively. An obtained value of about 0.994 for r2 (correlation coefficient) indicates a good correlation for both decomposition stages.
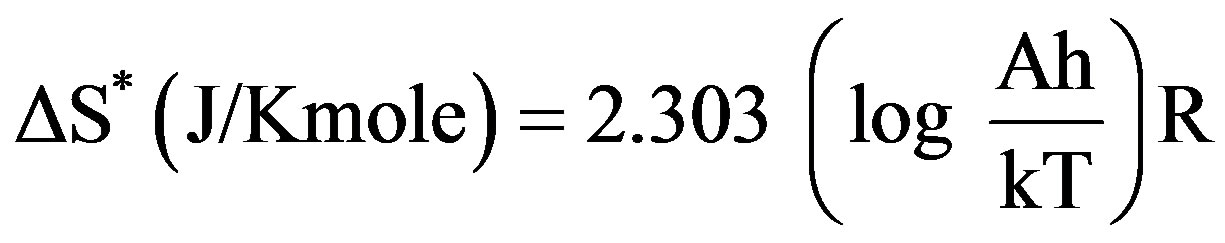
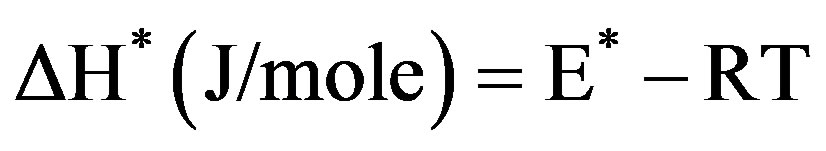
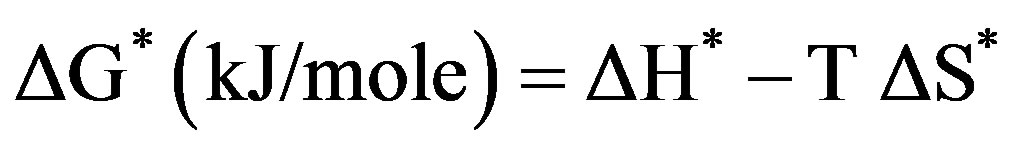
The kinetic analysis parameters such as the entropy of activation (ΔS*), the enthalpy of activation (ΔH*) and the free energy of activation (ΔG*) are calculated using the following equations [28]
 (4)
(4)
 (5)
(5)
 (6)
(6)
where k and h are the Boltzmann’s and Planck’s constants, respectively, T the temperature involved in the calculations selected as the peak temperature of DrTGA (Figure 2). The entropy of activation (ΔS*) gives information about the degree of order of the system; the enthalpy of activation (ΔH*) gives information about the total thermal motion; and Gibbs or the free energy of activation (ΔG*) gives information about the stability of the system.
The calculated thermodynamics parameters (E*, ΔS*, ΔH* and ΔG*) values are given in Table 2. In most blend samples, it is clear from the figure that, values of E*, ΔS*, ΔH* and ΔG* are intermediate between those of homopolymers such blends possess. The blend samples of composition 75/25 and 25/75 (wt/wt%) PVA/HPC, in the first decomposition stage, have activation energy (E*) values less than that of pure HPC. This may be due to bond weakening effects due to mixing PVA with HPC. However, the pronounced deviation of ΔS* values for blend samples compared to individual polymers indicates that the thermal process take place with significant perturbation of the position order of the macromolecules. Also, it is to be mentioned that the values of ΔG* in the first decomposition stage are nearly less than those of the second decomposition stage while E*, ΔS* and ΔH* values are approximately the same in both decomposition stages. The negative values of the entropies of activation are compensated by the values of the enthalpies of activation [28]. The obtained results could be used in thermal decomposition optimization.
DSC and TGA curves provide some information about the various observations during heat treatment. It is important to take into account that TGA curve reveals the variation in weight; but, the DSC is connected with calorific phenomenon which occurs with no detectable weight change. Accordingly, the DSC and TGA studies reveal the miscibility between PVA and HPC as well as the induced fundamental changes in the morphology of the films and thermal stability according to their blend compositions.
3.2. X-Ray Diffraction (XRD) Analysis
X-ray diffraction (XRD) analysis has yielded a great amount of valuable information on the crystal structure, orientation and size of ordered regions in materials. A meaningful interpretation of experimental results requires the determination of the structure of PVA and HPC and their blend samples. The typical X-ray diffraction patterns (XRD) of PVA and HPC homo-polymers, and their blend samples, at room temperature, in the scanning range 3˚ ≤ 2θ ≤ 50˚ are shown in Figure 6. The appearance of sharp reflections and diffuse scattering, observed from the XRD of pure PVA (pattern a), is characteristic of crystalline and amorphous phases of conventional semi-crystalline polymers. However, spectrum of pure HPC (pattern f) shows amorphous features characterized by two halos centered at 2θ = 16.356 and 13.518 degrees, respectively. Moreover, the pattern (a), observed in the figure for pure PVA, shows several distinct crystalline peaks at 2θ = 11.211, 12.687, 15.280, 19.450, 20.654, 23.520, 25.196, 28.148 and 30.741 degrees, assigned to a mixture of (110), (101), (10ī), (200),
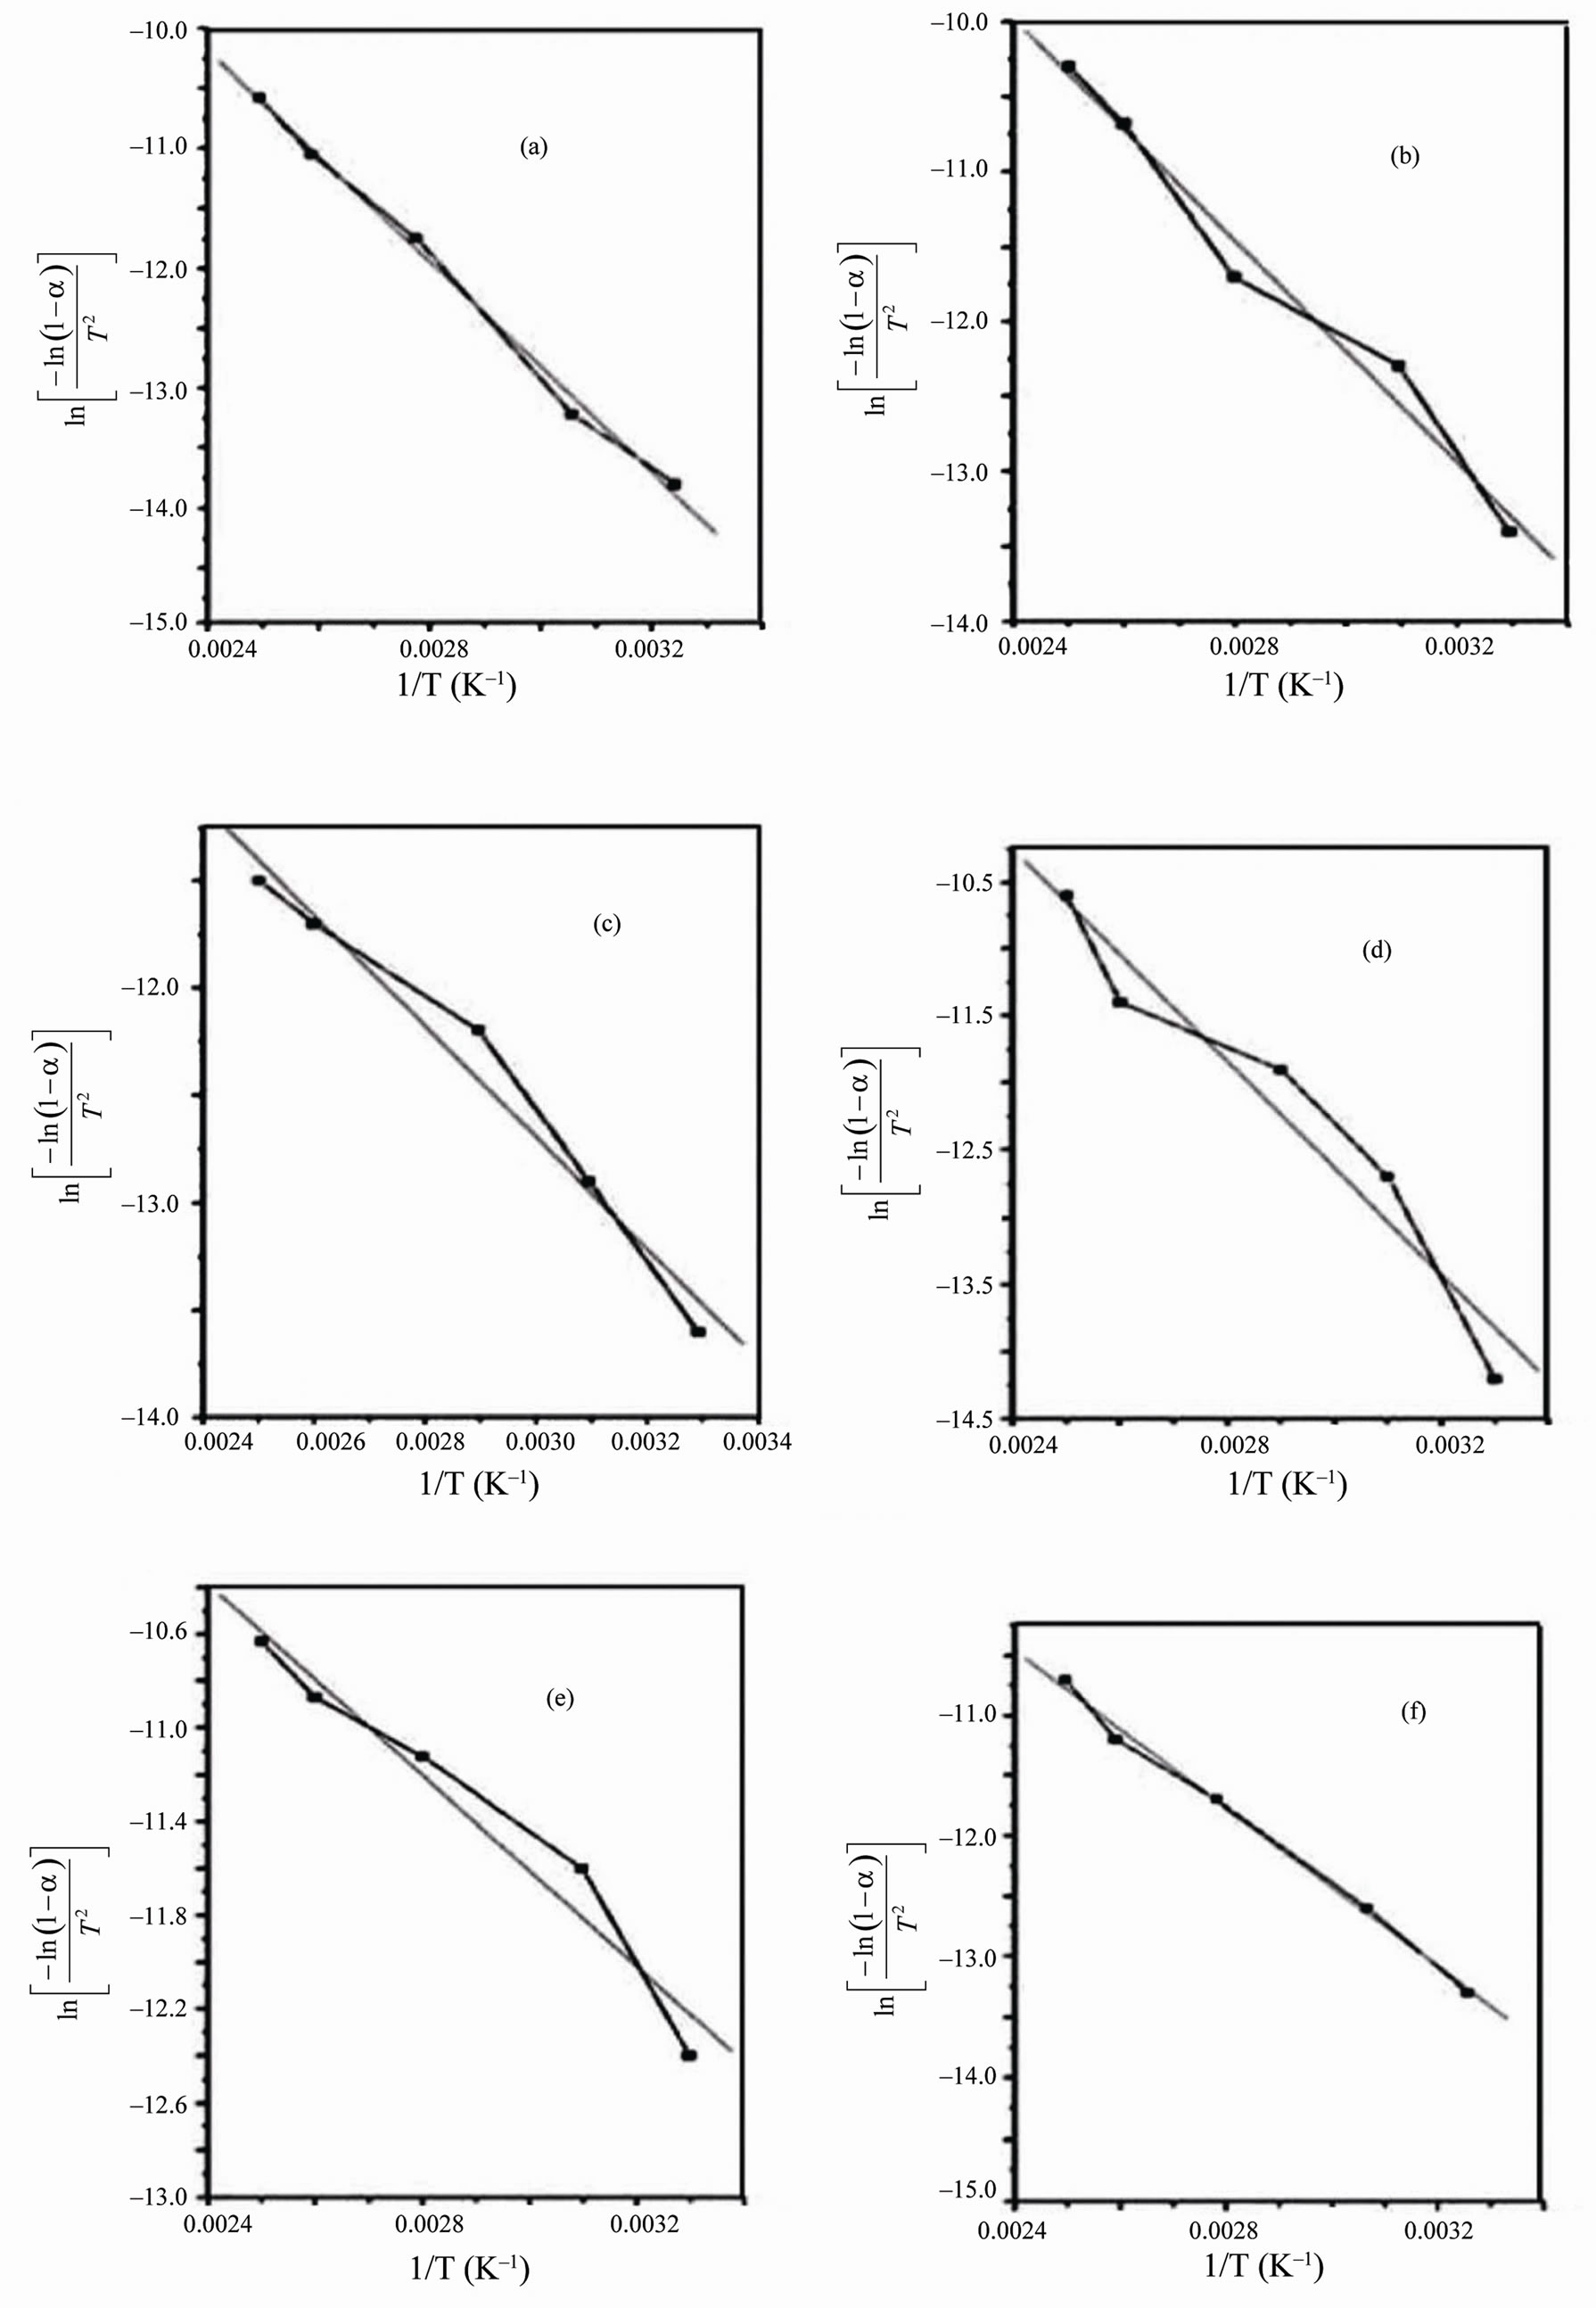
Figure 4. Coats-Redfern linearization plots of the first decomposition stage for PVA/HPC blends: (a) 100/0; (b) 90/10; (c) 75/25; (d) 50/50; (e) 25/75 and (f) 0/100 (wt/wt%).
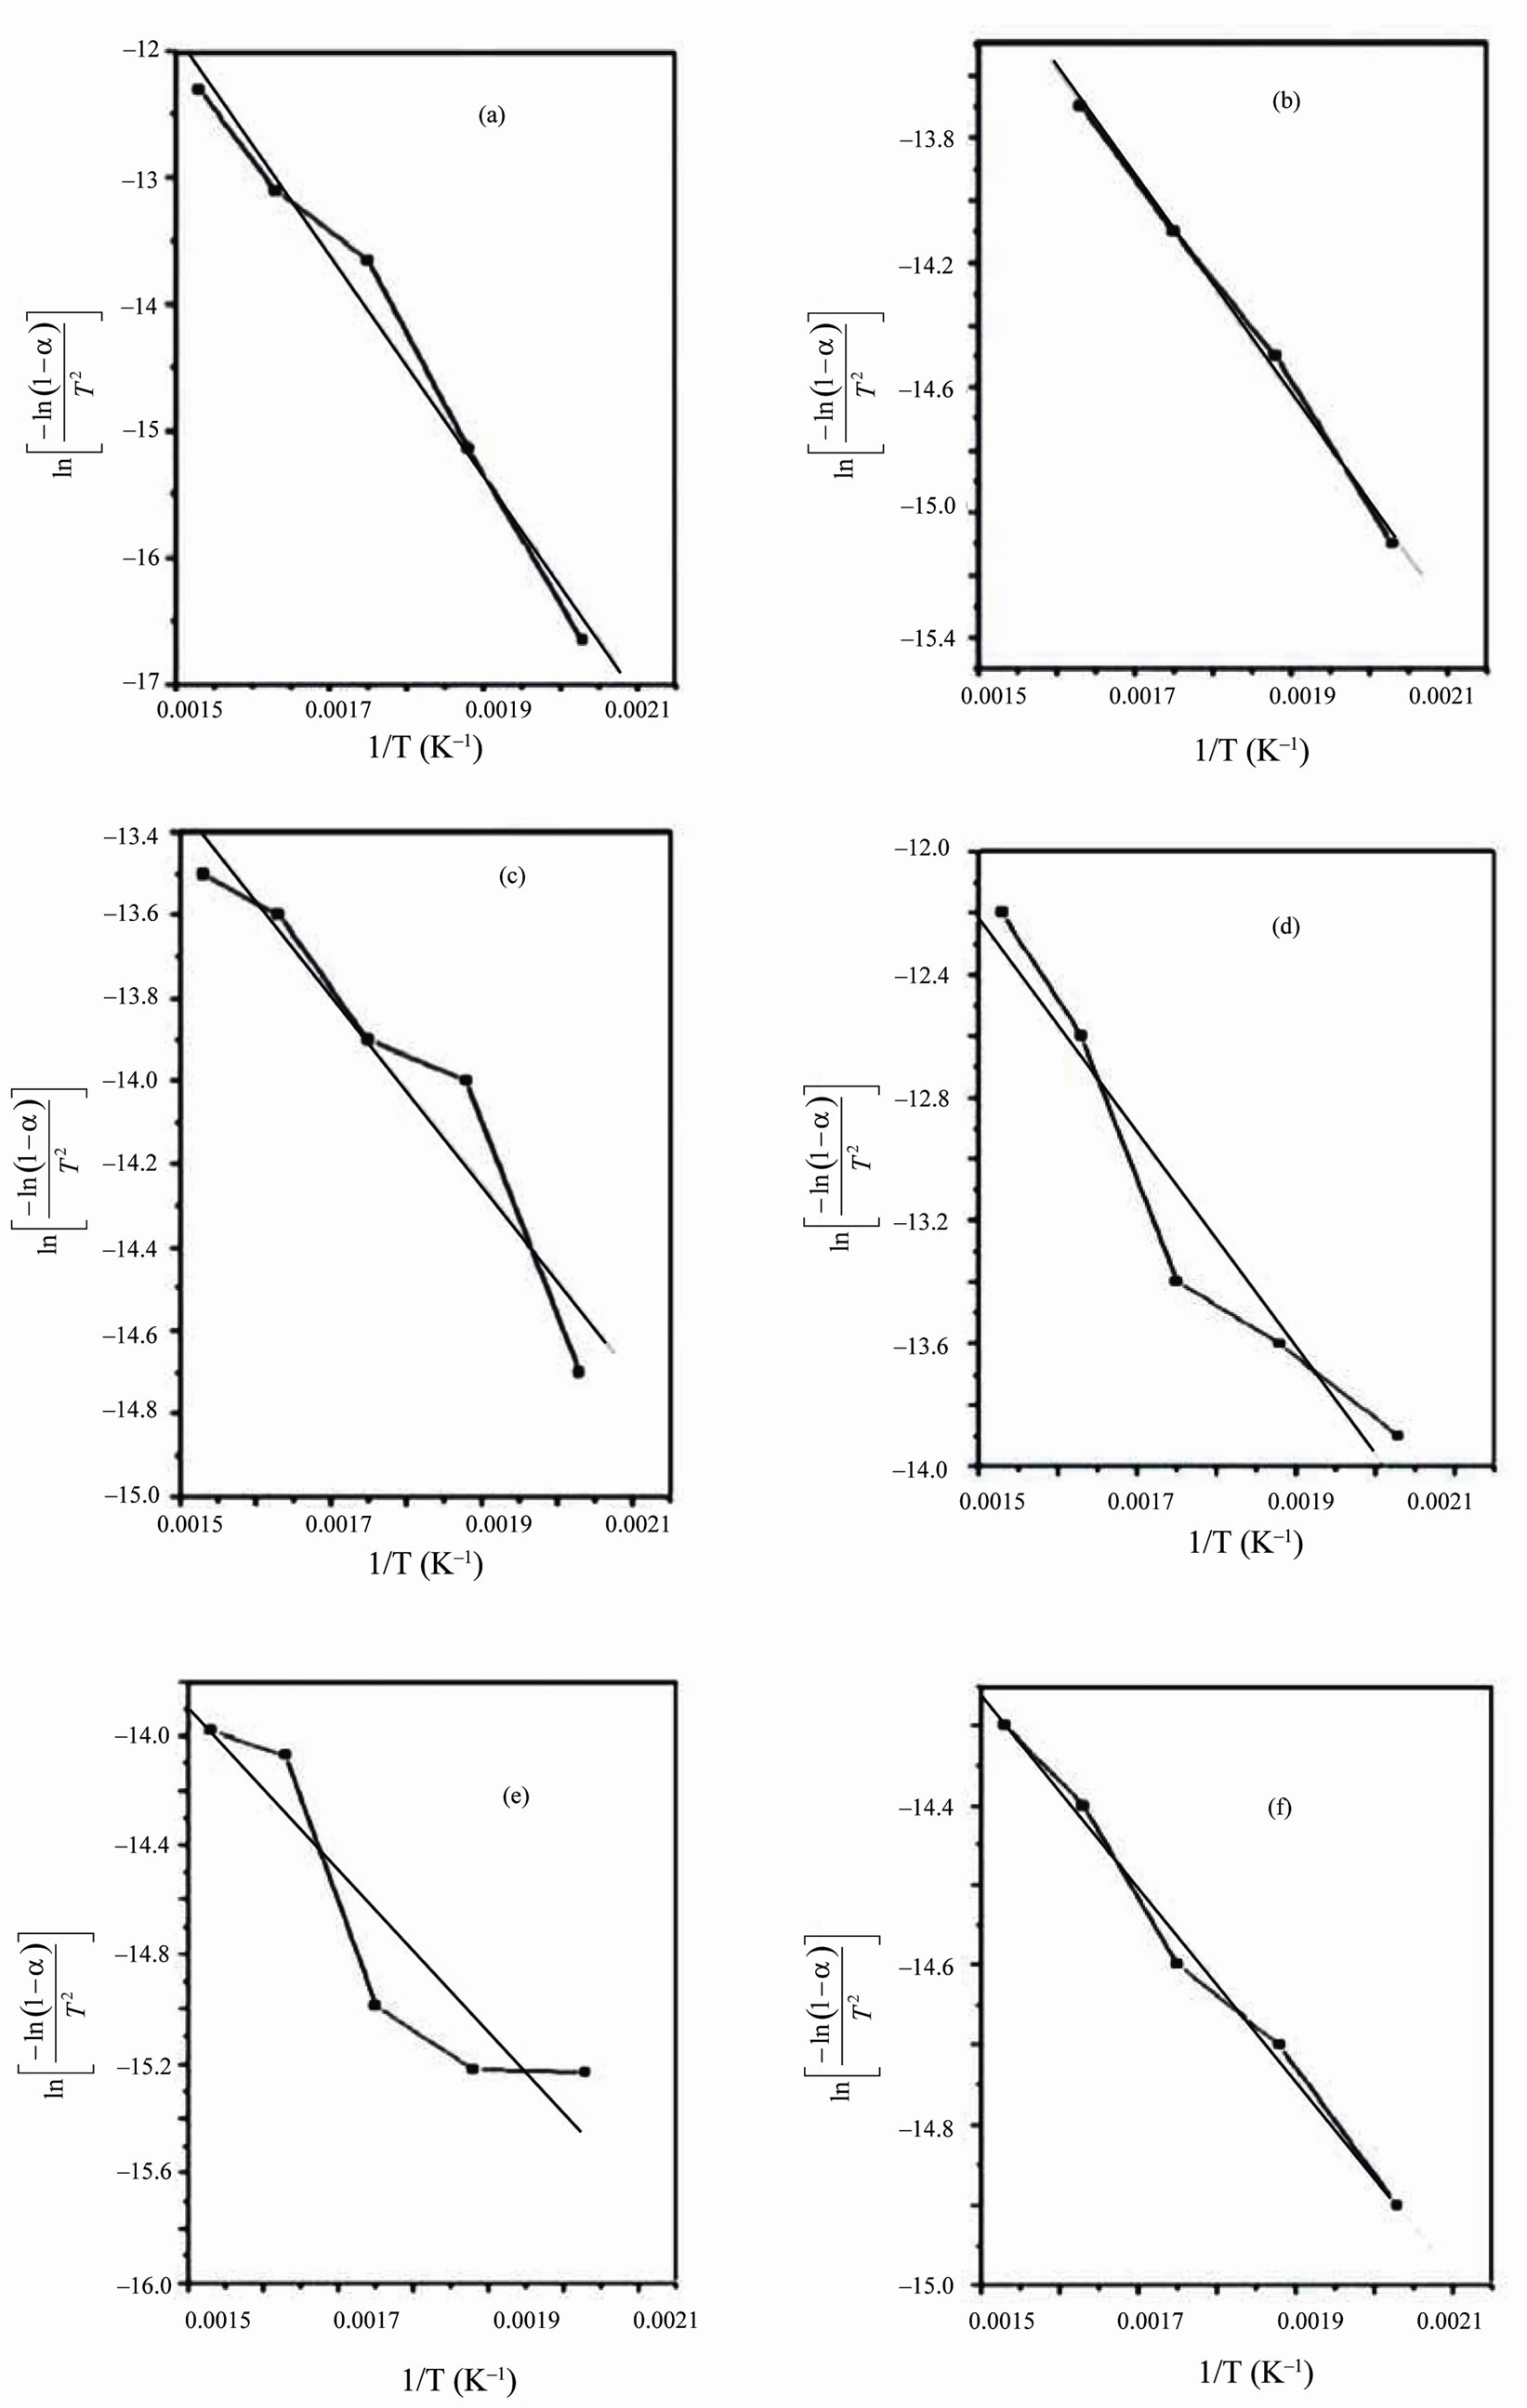
Figure 5. Coats Redfern linearization plots of the second decomposition stage for PVA/HPC blends: (a) 100/0; (b) 90/10; (c) 75/25; (d) 50/50; (e) 25/75 and (f) 0/100 (wt/wt%).
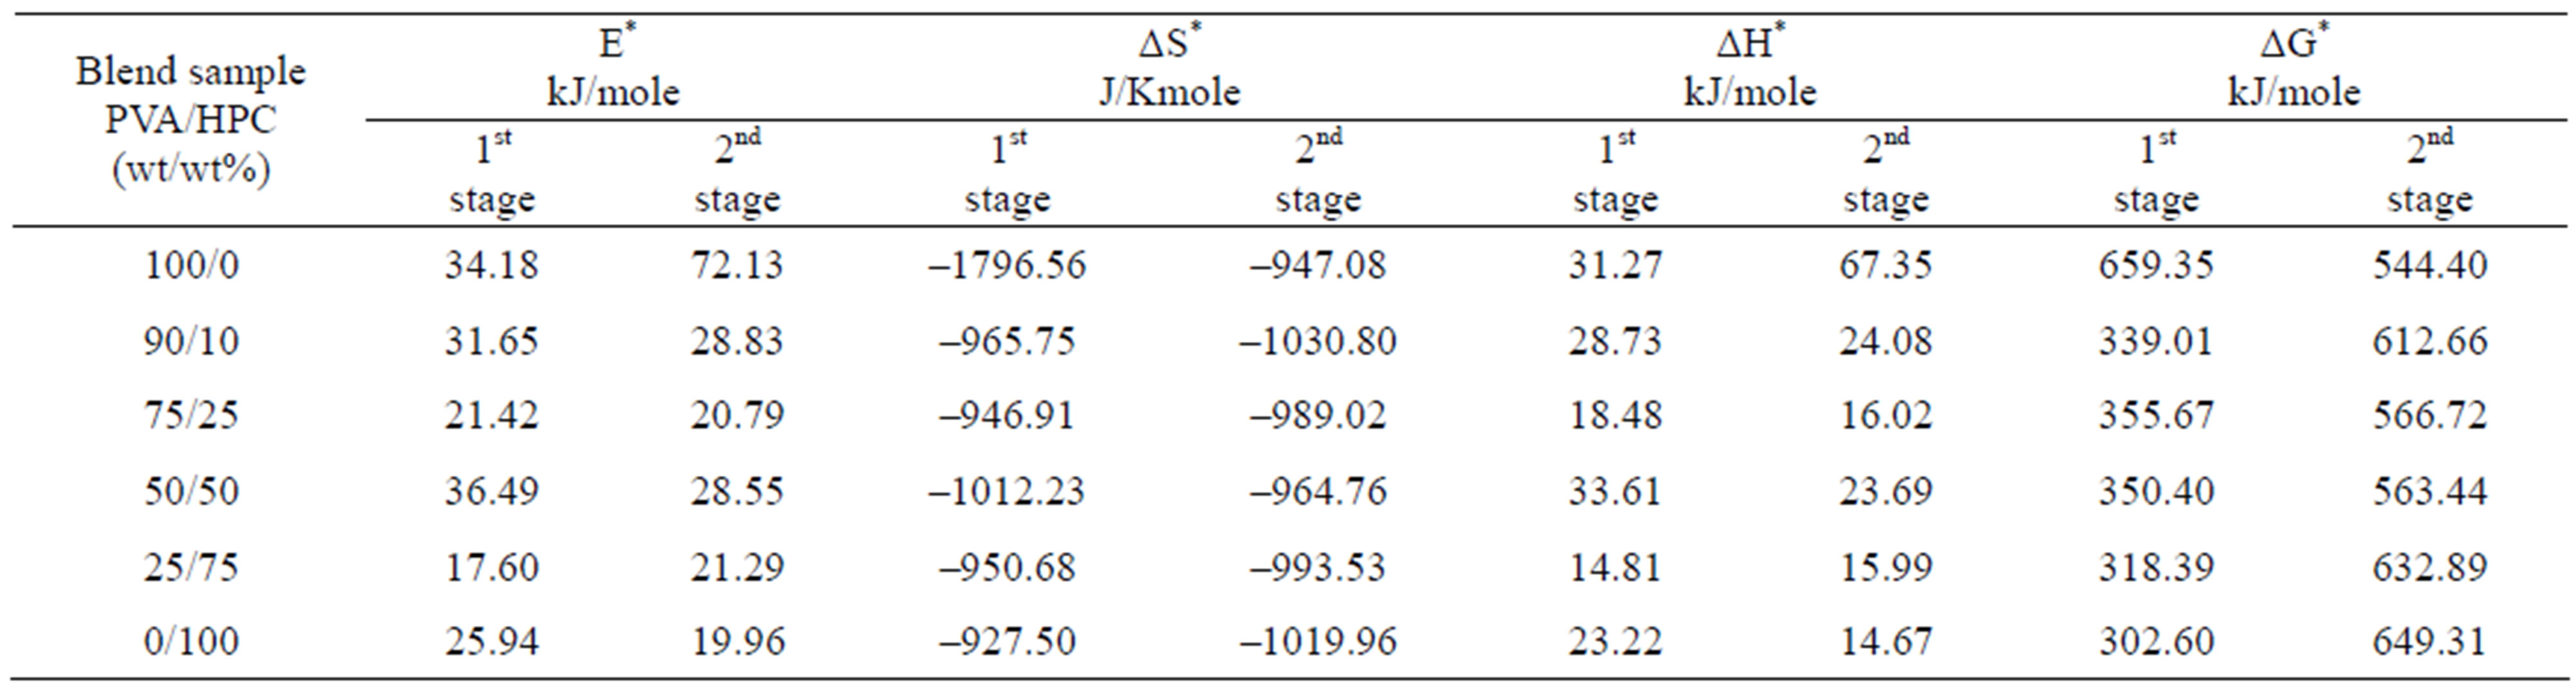
Table 2. Thermodynamic activation parameters extracted from Figures 4 and 5 using CR method of PVA/HPC blends.
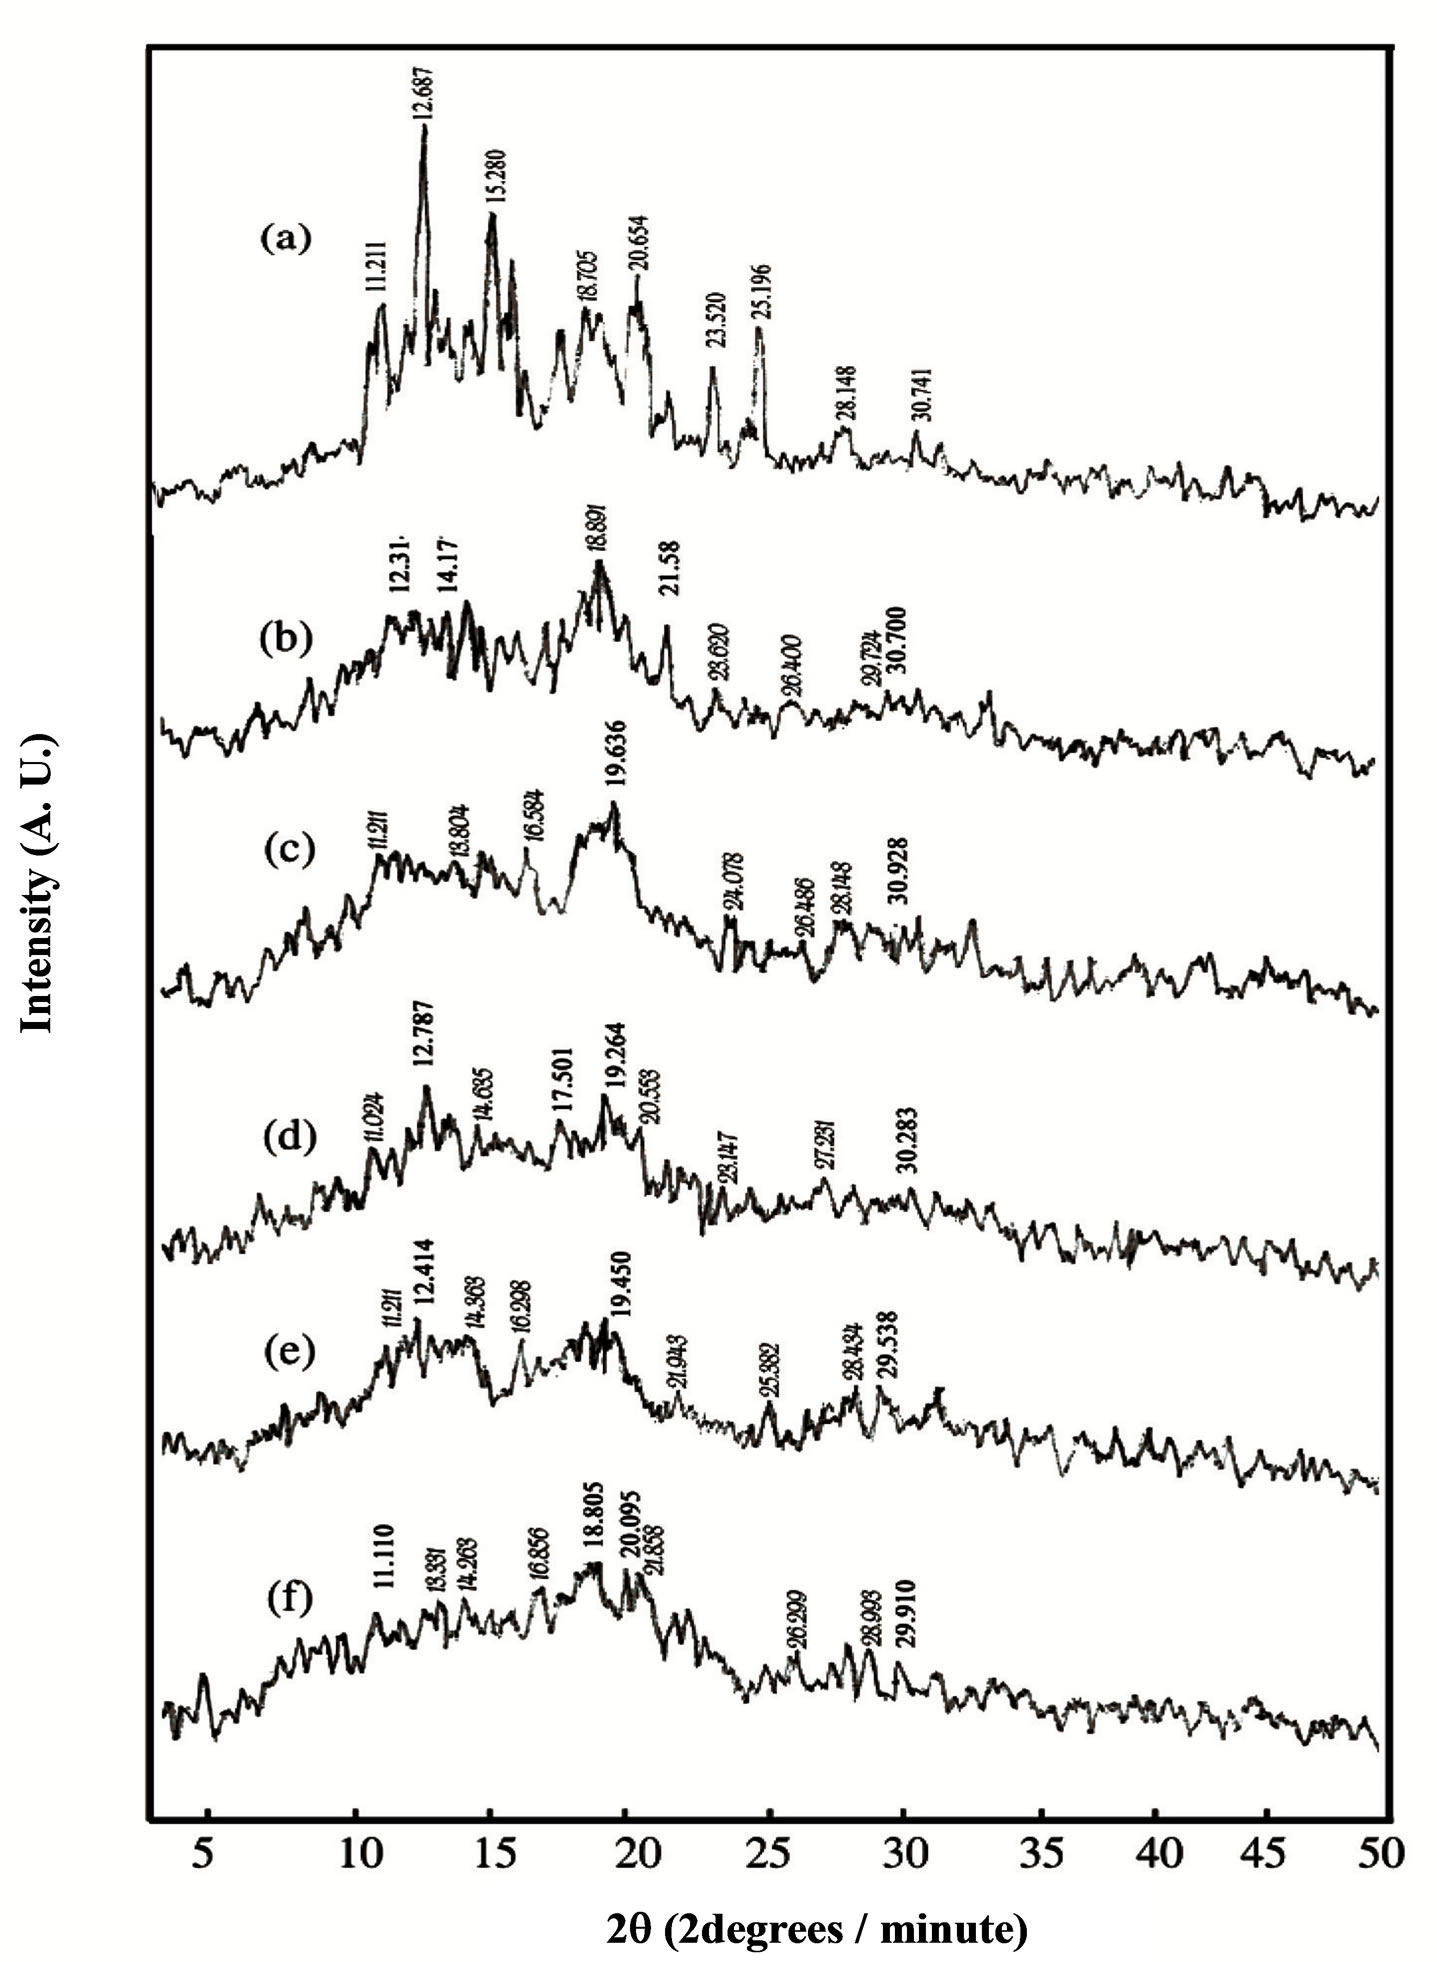
Figure 6. Variation in X-ray diffraction patterns of PVA/HPC blends: (a) 100/0; (b) 90/10; (c) 75/25; (d) 50/50; (e) 25/75 and (f) 0/100 (wt/wt%).
(201) and (20ī) which agree with that previously reported in the literatures [4,29].
It is also clear from Figure 6 that, the XRD patterns of PVA/HPC blend samples exhibited the characteristics of pure PVA but with less intensity for the crystalline peaks. Thus, one can say that the semi-crystalline structure of PVA is decreased upon mixing with different concentrations of HPC. In addition, some crystalline peaks are no longer detectable (2θ = 15.280, 20.654 and 23.520 degrees) since they are of vanishingly small intensity in the XRD pattern of homo-polymers. This is attributed to weak reflections from the ordered structure.
For the semi-crystalline amorphous blends, the noncrystallizing component could strongly modify the crystallization behavior of crystallizing component. The phase morphology of these systems of blends is governed by the compatibility of the amorphous phase and nature of the crystalline phase [19]. For such blends, miscibility between the amorphous components of both homo-polymers PVA and HPC is possible. Thus, it can be suggested that the crystal forms in PVA do not prevent the miscibility between amorphous regions of the homo-polymers in the blend systems.
Two distinguished bands are centered at 2θ = 18.805 - 19.636 degrees as a fundamental band and at 2θ = 28.148 - 28.434 as a secondary one for the PVA/HPC blend samples. The intensities for both fundamental and secondary bands observed in Figure 6 decreases as the concentration of HPC increases.
Crystallinity is defined as the weight fraction of the crystalline portion of a polymer. The physical and mechanical properties of polymers are considerably dependent on that parameter. XRD is most frequently used to measure the crystallinity in the polymers. Table 3 illustrates the variation of crystallinity index (CrI) as a function of different concentrations of the HPC as calculated from the X-ray patterns (Figure 6) by using Eq.1. It is clear from the table that, maximum value for the blend sample 90/10 wt/wt% PVA/HPC is detected. The values of crystallinity index (CrI) of PVA/HPC blend samples decreases with increasing HPC concentration up to 75 wt%. This implies changes in the structural regularity of the main chains of the polymeric molecules on doping.
4. CONCLUSION
The results indicate that structural changes occurred in the polymer matrix as the dopant diffused. The hydroxyl ions of HPC are coordinated through hydrogen bonds with the hydroxyl groups belonging to the different chains in PVA. A decrease in crystallinity has been proposed as one or another aspect of the complicated molecular and crystalline structure induced in doping. It has been recognized that the doping concentration plays a dominant role in both morphological and micro-structural change in the
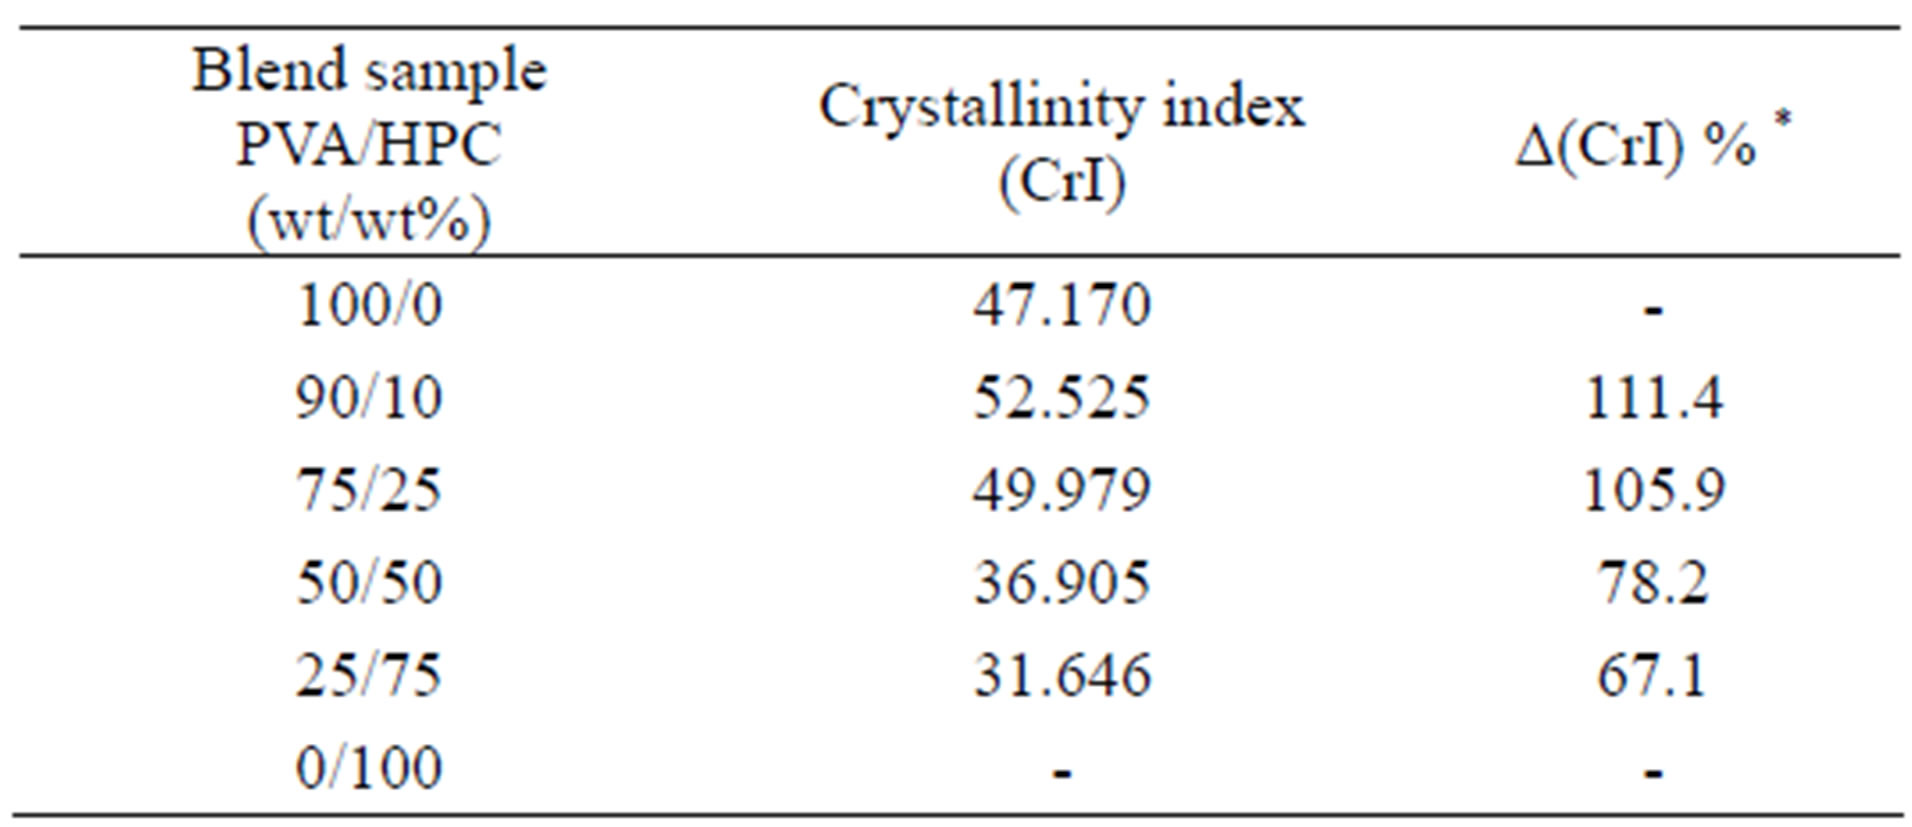
Table 3. Variations in the crystallinity index (CrI) of PVA/HPC blends.
*
polymer matrix. This may be attributed to variations in the internal mechanisms that occurred by the induced effect of doping on the structure of PVA. As a result, it produces variations in the macromolecular and micromolecular structure of the PVA network. The DSC and TGA studies reveal the miscibility between PVA and HPC as well as the induced fundamental changes in the morphology of the films and thermal stability according to their blend compositions.
5. ACKNOWLEDGEMENTS
The authors are very grateful to Prof. Dr. Anwar A. Elsayed and the late Prof. Dr. El-Sayed A. Gaafar, Professors of Biophysics, Biophysics Department, Faculty of Science, Cairo University, Giza, Egypt, for their kind help to bring this work to its best form.
REFERENCES
- Prichard, G.J. (1970) Poly(vinyl alcohol): Basis principles and uses. Gordon and Breach, New York.
- Brunelli, D.D., Barboza, V.C., Joekes, I. and Atvars, T.D.Z. (1998) Mapping phases of poly(vinyl alcohol) and poly(vinyl acetate) blends by Ft-Ir microspectroscopy and optical fluorescence microscopy. Journal of Applied Polymer Science, 69, 645-655. doi:10.1002/(SICI)1097-4628(19980725)69:4<645::AID-APP3>3.0.CO;2-J
- Garrel, D.R., Gaudreau, P., Zhanf, L.M., Reeves, I. and Brazeau, P. (1991) Chronic administration of growth hormone-releasing factor increases wound strength and collagen maturation in granulation tissue. The Journal of surgical research, 51, 297-302. doi:10.1016/0022-4804(91)90111-X
- Kim, J.H., Kim, J.Y., Lee, Y.M. and Kim, K.Y. (1992) Properties and swelling characteristics of cross-linked poly(vinyl alcohol)/chitosan blend membrane. Journal of Applied Polymer Science, 45, 1711-1717. doi:10.1002/app.1992.070451004
- Saxena, A.K., Marler, J., Benvenuto, M., Willital, G.H. and Vacanti, J.P. (1999) Skeletal muscle tissue engineering using isolated myoblasts on synthetic biodegradable polymers: Preliminary studies. Tissue Engineering, 5, 525-532. doi:10.1089/ten.1999.5.525
- Peppas, N.P. and Merril, E.W. (1977) Development of semicrystalline poly(vinyl alcohol) hydrogels for biomedical application. Journal of Biomedical Materials Research, 11, 423-434. doi:10.1002/jbm.820110309
- Hyon, S.H., Cha, W.I., Ikada, Y., Kita, M., Ogura, Y. and Honda, Y. (1994) Poly(vinyl alcohol) hydrogels as soft contact lens material. Journal of Biomaterial Science, 5, 397-406. doi:10.1163/156856294X00103
- Dumoulin, M.M., Carreau, P.J. and Utracki, L.A. (1987) Rheological properties of linear low density polyethylene/polypropylene blends. Part 2: Solid state behavior. Polymer Engineering & Science, 27, 1627-1633. doi:10.1002/pen.760272109
- Hofenk-de Graaff, J. (1981) Central research laboratory for objects of art and science. Gabriel Metsustroat and 1071 EA, Amsterdam.
- Ishikawa, T., Mukai, B., Shiraishi, S., Utoguchi, N., Fuji, M., Matsumota, M. and Watanabe, Y. (2001) Preparation of rapidly disintegrating tablet using new types of microcrystalline cellulose (PH-M series) and low substitutedhydroxypropylcellulose or spherical sugar granules by direct compression method. Chemical and Pharmaceutical Bulletin, 49, 134-139. doi:10.1248/cpb.49.134
- El-Zaher, N.A. and Osiris, W.G. (2005) Thermal and structural properties of poly(vinyl alcohol) doped with hydroxypropyl cellulose. Journal of Applied Polymer Science, 96, 1914-1923. doi:10.1002/app.21628
- Osiris, W.G. and Moselhey, M.T.H. (2011) Optical study of poly(vinyl alcohol)/hydroxypropyl methylcellulose blends. Journal of Materials Science, 46, 5775-5789. doi:10.1007/s10853-011-5533-5
- Segal, L., Creely, I.J., Martin, A.E.Jr. and Conrad, C.M. (1959) An empirical method for estimating the degree of crystallinity of native cellulose using the X-ray diffractometer. Textile Research Journal, 29, 786-794. doi:10.1177/004051755902901003
- Peppas, N.A. and Merrill, E.W. (1976) Differential scanning calorimetry of crystalline PVA hydrogels. Journal of Applied Polymer Science, 20, 1457-1465. doi:10.1002/app.1976.070200604
- Zhang, S.H., Painter, P.C. and Runt, J. (2002) Dynamics of polymer blends with intermolecular hydrogen bonding: Broad-band dielectric study of blends of poly(4-vinyl phenol) with poly(vinyl acetate) and EVA70. Macromolecules, 35, 8478-8487. doi:10.1021/ma021010i
- Kong, Y. and Hay, J.N. (2002) The measurement of the. crystallinity of polymers by DSC. Polymer, 43, 3873- 3878. doi:10.1016/S0032-3861(02)00235-5
- Vijaya Kumar Naidu, B., Bhat, S.D., Sairam, M., Wali, A.C., Sawant, D.P., Halligudi, S.B., Mallikarjuna, N.N. and Aminabhavi, T.M. (2005) Comparison of the pervaporation separation of a water-acetonitrile mixture with zeolite-filled sodium alginate and poly(vinyl alcohol)- polyaniline semi-interpenetrating polymer network membranes. Journal of Applied Polymer Science, 96, 1968- 1978. doi:10.1002/app.21653
- Sakellariou, P., Hassan, A. and Rowe, R.C. (1993) Phase separation and polymer interactions in aqueous poly(vinyl alcohol)/hydroxypropyl methylcellulose blends. Polymer, 34, 1240-1248. doi:10.1016/0032-3861(93)90780-E
- Cheung, Y.W. and Guest, M.J. (2000) A study of the blending of Ethylene-Styrene copolymers differing in the copolymer styrene content: Miscibility considerations. Journal of Polymer Science Part B: Polymer Physics, 38, 2976-2987. doi:10.1002/1099-0488(20001115)38:22<2976::AID-POLB130>3.0.CO;2-5
- Wang, H., Hobbie, E.K., Shimizu, K., Wang, G.Z.G., Kim, H.D. and Han, C.C. (2002) Competing kinetics in simultaneously crystallizing and phase-separating polymer blends. Journal of Chemical Physics, 116, 7311-7315. doi:10.1063/1.1464537
- Gireco, R. (1985) Polymer blends and mixtures. In: Walsh, D.J., Higgins, J.S. and MacOnnachie, A., Eds., NATOASI Series E, Applied Science No. 89, Nijhoff, Hague.
- Ciemniecki, S.L. and Glasser, W.G. (1988) Multiphase materials with lignin: 2. Blends of hydroxypropyl lignin with poly(vinyl alcohol). Polymer, 20, 1030-1036. doi:10.1016/0032-3861(88)90011-0
- Hammel, R., MacKnight, W.J. and Karasz, F.E. (1975) Structure and properties of the system: poly(2,6-dimethyl-phenylene oxide) isotactic polystyrene. Wide-angle x-ray studies. Journal of Applied Physics, 46, 4199- 4203. doi:10.1063/1.321432
- Wenig, W., Karasz, F.E. and MacKnight, W.J. (1975) Structure and properties of the system: poly(2,6-dimethyl-phenylene oxide) isotactic polystyrene. Small-angle x-ray studies. Journal of Applied Physics, 46, 4194- 4198. doi:10.1063/1.321431
- Gullis, C.F. and Hirshler, M.M. (1981) In the combustion of organic polymers. Claredon, Oxford.
- Coats, A.W. and Redfern, J.P. (1964) Kinetic parameters from thermogravimetric data. Nature, 201, 68-69. doi:10.1038/201068a0
- Ebrahimi-Kahrizsangi, R. and Abbasi, M.H. (2008) Evaluation of reliability of Coats-Redfern method for kinetic analysis of non-isothermal TGA. Transactions of Nonferrous Metals Society of China, 18, 217-221. doi:10.1016/S1003-6326(08)60039-4
- Singh, B.K., Kumari, P., Prakash, A. and Adhikari, D. (2009) Thermal decomposition kinetics of peanut shell. Nature and Science, 7, 73-78.
- Lee, Y.M., Kim, S.H. and Kim, S.J. (1996) Preparation and characteristics of p-chitin and poly(vinyl alcohol) blend. Polymer, 37, 5897-5905. doi:10.1016/S0032-3861(96)00449-1