Psychology
Vol.10 No.02(2019), Article ID:90456,22 pages
10.4236/psych.2019.102017
Validation of the Questionnaire of Students’ Attitudes toward STEM-PBL: Can Students’ Attitude toward STEM-PBL Predict their Academic Achievement?
Mahnaz Shojaee1, Ying Cui1, Mehrdad Shahidi2,3, Xinxin Zhang1
1University of Alberta, Edmonton, Canada
2Mount Saint Vincent University, Halifax, Canada
3Department of Psychology, Tehran Central Branch, Islamic Azad University, Tehran, Iran

Copyright © 2019 by author(s) and Scientific Research Publishing Inc.
This work is licensed under the Creative Commons Attribution International License (CC BY 4.0).
http://creativecommons.org/licenses/by/4.0/


Received: December 19, 2018; Accepted: February 9, 2019; Published: February 12, 2019
ABSTRACT
The interdisciplinary curriculum of science, technology, engineering, math, and project-based learning (STEM-PBL) has currently received deep contemplation for its diverse benefits. This major attention has been focused on optimizing the curriculum by developing tools for assessing the diverse aspects of STEM in relation to teaching methods (e.g., PBL, teacher-centered learning, and game-based teaching), and students’ attitude. Following the principle of fallibility, the current research examined psychometric properties of the scale of students’ attitudes toward STEM-PBL. Also, the power of predictability of academic achievement by means of students’ attitude, and the mediating role of demographic factors were aimed to explore. The scale was completed by 337 students who were selected randomly. Using confirmatory factor analysis, Graded Response Modeling (GRM) based on Item Response Theory (IRT) provided technical informative details about each item of scale. Examining the items of scale displays reasonable psychometric properties including the validity of Student Attitude toward STEM-PBL Questionnaire. However, the analysis revealed that the removal of one of the items (item 22) may result in a better fit of the questionnaire. The results also showed that attitude toward STEM-PBL can predict students’ academic achievement using grade point average (GPA). Exploring the role of some mediating and demographic factors in this prediction revealed that self-learning had a high significant unique contribution in predicting GPA among respondents. The results displayed the significant association between GPA and students’ father education level. Also, students whose GPA and their fathers’ educational levels were high showed more positive attitude toward self-learning. Furthermore, the time of using technology and hands-on activity as a component of the students’ attitude toward STEM-PBL showed indirect relationship.
Keywords:
STEM-PBL, Science, Mathematics, Technology, Students’ Attitude, Validation

1. Introduction
Contemporary history of educational research reveals that leading students to success in science, technology, engineering, and mathematics (STEM) have received unprecedented local and international special attention (Han, Rosli, Capraro, & Capraro, 2016; Capraro & Slough, 2013; Hamaideh & Hamdan-Mansour, 2014; Najafi, Ebrahimitabass, Dehghani, & Rezaei, 2012) . This unique attention is mostly for diverse proliferated educational benefits in this interdisciplinary curriculum. Embedded vital skills (e.g., creativity, critical thinking, and problem-solving), students’ liberty to form their learning strategies, promoting self-regulated learning, and facilitating the process of career are some of important benefits of STEM that make it central to research (Kumari & Nandal, 2016; Wallace & Webb, 2016; Han et al., 2014; LaForce, Noble, & Blackwell, 2017) . To increase and optimize such benefits, researchers have focused on: 1) diverse teaching methods for STEM (Wallace & Webb, 2016; Shahin & Top, 2015) , and 2) the role of students’ cognitive attitude to achieve in STEM (Han, Rosli, Capraro, & Capraro, 2016; Han & Carpenter, 2014; Shahin & Top, 2015; Kumari & Nandal, 2016; Lou, Liu, Shih, & Tseng, 2011; Mohr-Schroeder et al., 2014; Najafi, Ebrahimitabass, Dehghani, & Rezaei, 2012) . Aligned with the second trend in the literature of STEM, providing a reliable tool to assess students’ attitude toward STEM education and the corresponding teaching strategy have also been central to study.
1) Diverse Teaching Methods: Regarding the first research trend, different teaching strategies for STEM education such as teacher-centered learning (TCL), game-based teaching or learning (GBL, Hoge, 2013 ), problem-based learning, and project-based learning (PBL) have been studied. Of these teaching strategies, project-based learning (PBL) has been recommended for STEM by the reason of being authentic, cooperative, feasible, and motivational (Wallace & Webb, 2016; Shahin & Top, 2015) . Thus, the combination of STEM-PBL refers to a type of science, technology, engineering, and mathematics education in which PBL has been used as a teaching strategy.
STEM-PBL is considered as an interdisciplinary education in which students are encouraged to complete some projects with respect to integrating knowledge, experiences, and problem-solving methods in a real world through which they enhance student involvement, engagement, cooperation, and motivation (Shahin & Top, 2015) . PBL, similar to problem-based learning, is sometimes considered as a learner-centred approach and is defined as an instructional method that focuses on higher-order learning in which students endeavor to resolve ill-structured or ill-defined projects by combining knowledge and authentic experiences in a real-world setting (Capraro & Corlu, 2013; Capraro & Jones, 2013; Tawfik & Trueman, 2015) . Capraro et al. (2013) argued that PBL is a model for class activity in which teachers are just facilitators and practices are rooted in a real-world context and designed in the frame of projects for long-term learning.
The application of PBL for STEM programs reveals that PBL’s common features such as higher level of instructional feedback, inquiring strategies, integrated subject areas, students’ discussions, and peer and self-assessment lead students to acquire the higher level of learning and positive attitude toward subjects (Hall & Miro, 2016) . Tseng and his colleagues (2013) found that STEM-PBL can affect students’ academic performance positively. Using a pre and post-test method (Tseng et al., 2013) , they concluded that using PBL for STEM education not only increased meaningful learning, it also enhanced students’ tendency for future careers since STEM courses integrated knowledge, concepts, and skills systematically. One of the important findings of their study was that PBL was more effective in changing students’ attitude toward engineering rather than mathematics. This reveals that students who participate in STEM-PBL education may have the propensity to choose science and mathematics courses in their final years of high school.
Also, several benefits were reported in K-12 schools in which STEM-PBL was adopted (Han et al., 2014; Tsigarides, Wingfield, & Kulendran, 2017) . These benefits include increased self-confidence, increased self-efficacy, being effective in professional learning, facilitating the process of career, promoting lifelong learning, increased critical thinking, and particularly increased students’ positive attitude that enhances their academic achievement (Kumari & Nandal, 2016; Wallace & Webb, 2016; Han et al., 2014) . Specifically, creating positive attitude toward learning, which affects academic achievement, was emphasized by different researchers (Vanessa, 2015 cited in Kumari & Nandal, 2016 ).
Other findings indicated that students learn better when they are authentically involved in meaningful activities and are engaged in a real-world problem, which makes the learning context more relevant for them (Stearns, Morgan, Capraro, & Capraro, 2012) . In their study, Karaman and Celik (2008 cited in Tseng, Chang, Lou, & Chen, 2013 ), demonstrated that those students participated in PBL classes performed better in skill development, knowledge retention and general abilities comparing with those were not in PBL classes. Students also acquire different skills such as collaborative, technical, problem-solving, and leadership skills that enhance their positive attitude toward STEM. These characteristics are more effective when students are provided with diverse, ill-defined, nonroutine, and authentic tasks in the frame of projects (Han, 2017) .
However, diverse teaching strategies for STEM education have been used in educational curriculum and PBL as a teaching strategy in STEM education is seemingly novel (Asghar, Ellington, Rice, Johnson, & Prime, 2012; Duke, Halvorsen, & Strachan, 2016) . Thus, its characteristics and applicability through assessing students’ perspectives (attitude) toward STEM need to be more researched.
2) Students’ Attitude toward STEM-PBL: Students’ attitude toward STEM-PBL refers to the way students think and feel about the STEM and the way they involved themselves in the process of learning through PBL. This phenomenon is characterized by three major cognitive, affective and behavioral components that are organized toward STEM. Attitude in this regard reflects how students evaluate learning subjects and environments, and how they react affectively to such learning (Han et al., 2014) . Generally, attitude acts through the ABC model (Veresova & Dana Mala, 2016) ; that is, when attitude is positive, a) students have more positive thoughts and opinions about the subjects (cognitive element), b) they feel about the subjects enthusiastically (affective element), and c) show inner tendency to be involved and engaged fruitfully (behavioral element). It is assumed that positive attitudes increase students’ academic achievement.
Studying the impact of positive attitude on different types of phenomena such as school connectedness, school environment, and academic success resulted in different range of findings (Henning, 2013; Veresova & Dana Mala, 2016) . However, there are few studies regarding the impact of students’ attitude on STEM and its relationship with academic achievement (Han et al., 2014, Han, 2017) . Han (2017) demonstrated that students who had positive attitude toward STEM-PBL components showed increased tendency to pursue STEM-PBL. Such findings were reported by previous studies (Han et al., 2014; Sahin, 2013) . In Turky, researchers demonstrated that STEM-PBL has effective capacities to be an integrated model to promote innovations (Corlu, Capraro, & Capraro, 2014) .
The major factor in reliable and valid assessing students’ attitude toward STEM-PBL is using an appropriate tool since there have been different scales and questionnaires designed to assess students’ attitude toward education, school, learning, or science such as the Questionnaire of Attitude Toward School and Learning (Veresova & Dana Mala, 2016) , Relevance of Science Education Questionnaire (ROSEQ) (Schreiner & Sjoberg, 2004; Oscarsson, Jidesjo, Karlsson, & Stromdahl, 2009) , Student Academic Attitude Survey (SAAS, Henning, 2013 ) and other scales.
However, the Questionnaire of Students’ Attitude toward STEM-PBL (Han et al., 2014; Han, 2017) with remarkable validity and reliability is a scale that designed specifically for assessing students’ attitudes toward STEM-PBL. According to Han and Carpenter (2014) , this scale assesses five major factors including self-regulated learning, collaborative learning environment, interdisciplinary learning environment, technology-based learning and hands-on activity. The scale was designed to cover the main features of STEM-PBL namely high levels of content involvement, class engagement, group cooperation, and personal motivation, authenticity, reflection, success skills, and critical thinking. The scale was found to show high reliability in a study with 785 Korean middle-grade students (Figure 1).
Additionally, it is demonstrated that this scale can reflect the multidisciplinary characteristics of STEM-PBL (Han et al., 2014; Han, 2017) . Although it is postulated by Han et al., 2014 ; Han, 2017 that this scale is reliable in their statistical population, these characteristics should be assessed in diverse statistical population such as Iranian students. Apart from one study in Iran that focused on students’ attitude toward science and technology in middle schools (Najafi, Ebrahimitabass, Dehghani, & Rezaei, 2012) , there was no study regarding a) the applicability of the scale in Iranian population, and b) the impact of students’ attitude toward STEM-PBL on their academic achievements.
Additionally, since the study of students’ reluctance has important implications for the stability of scientific endeavor and for the scientific literacy of forthcoming generations, the development of positive attitudes towards learning science and math is a center of attention in Iran in recent years (Najafi et al., 2012) . Recently, The Ministry of Education in Iran has provided secondary students with some incentives to increase their positive attitude toward math programs and encourage them to choose math and engineering programs (Islamic Republic News Agency, 2016) . This decision reveals that students’ attitude toward a particular instructional program and teaching strategy is a crucial factor
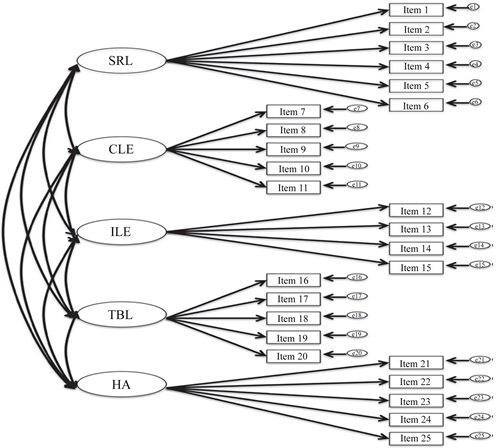
Figure 1. Five Factor Model of Student Attitude toward STEM PBL. (SRL = self-regulated learning, CLE = collaborative learning environment, ILE = interdisciplinary learning environment, TBL = technology-based learning, HA = hands-on activity) (Han & Carpenter, 2014: p. 32) .
not only for their academic achievement, but also for educational policy makers. Also, educational literature supported such roles for students’ attitude as it may influence their learning style, which is the way they adopt and respond to not only to instructional program, but also to instructional strategies in schools (Han & Carpenter, 2014) .
Moreover, studies in Iran revealed that students in traditional classroom in which PBL is not prominent have less desire to study math (Najafi et al., 2012) . This issue may have produced negative attitude that influences their direction of study. Therefore, the current study was designed not only to verify whether the Han et al., 2014; Han, 2017 questionnaire is valid and reliable in Iranian educational context, it also focused on the degree to which students’ academic achievement can be predicted through their attitudes toward STEM-PBL. Also, we aimed to examine some major demographic features of the students such as gender, parents’ educational levels and others. To reach these purposes the following research questions were designed:
a) What are the validity evidences of the Questionnaire of Students’ Attitudes toward STEM-PBL (Han & Carpenter, 2014) ?
b) To what degree students’ attitudes toward the five components of STEM-PBL can predict their academic achievement measured by grade point average (GPA)?
c) Are there any relationships of the five components of students’ attitudes toward of STEM-PBL and with student age, parents’ education, and amount of time that they spend on technology?
2. Method
2.1. Participants
Three secondary Iranian schools from urban area in Alborz province were randomly selected and 337 middle-grade students responded to the questionnaire. Of 337 students, 232 were females (68.8%) and 105 were males (31.2%), with the age mean of 14.25 (SD = 1.013). Since the participants of this study included middle-grade students, who are typically about 13 - 14 years of age and below the age of consent, parental or guardian consent was also needed before students could participate in the study. One week before the study was administered, parental/guardian consent forms were sent home with students so that approval could be received in time for students to participate in the study. The authors explained for students that participating in the study is completely voluntary. All these students have been working on different projects collaboratively or individually in their classes and school labs in which they have integrated their knowledge of science, technology, engineering, and mathematics.
2.2. Ethics
Ethical protocols were undertaken for the school board identified by the author as potential candidates for inclusion in the research. By the time data collection was scheduled to start, school board had approved this study. Hence principals, teachers, and students from schools within that district were invited to participate. The ethical protocols of particular interest to school district ethic board were the following: informed consent letters for both students and their parents or guardians to indicate voluntary involvement in the research.
2.3. Measures
The questionnaire of students’ attitudes toward STEM-PBL was a 25 Likert-formatted items to measure student attitude toward varied aspects of STEM-PBL. The scale has five sections including student self-regulated learning, collaborative learning environment, interdisciplinary learning environment, technology-based learning and hands-on activity (Han & Carpenter, 2014; Najafi et al., 2012) . Figure 1 illustrates the features of the STEM-PBL as were explained in the previous section.
To prepare the scale for this study, translation and back translation was independently conducted by two expert reviewers; both were fluently bilingual in English and Persian language. Following confirmation of translation accuracy, the scale was administrated, and participants were asked to choose one of the options in 5-point scale, ranging from strongly disagree to strongly agree, to show their attitude for each item. Most of the participants were able to complete the questionnaire within 15 minutes.
Besides the above-mentioned instrument, a demographic survey (See appendix)was administered that had ten items, regarding their gender, age, GPA, parents’ education, and also some information about their interests in technology and the amount of time that they usually spend in using different types of technology.
2.4. Procedure
The collected data were explored for the basic statistical assumptions such as normality. Then, to acquire the confirmation regarding the factors, which Han and Carpenter had found in 2014 and the position of each item in relation to above noted factors in the questionnaire, a confirmatory factor analysis using the Structural Equation Modeling through AMOS software 18.0.0 version used.
In addition, to validate the STEM-PBL questionnaire the researchers focused on item analysis using R software version 3.4.1. The multidimensional form of Graded Response Modeling (GRM; Samejima, 1969; Ackerman et al., 2003; Bartolucci, Bacci, & Gnaldi, 2012 ) was utilized in order to find the relationship between item responses and the latent trait. GRM is one of well-developed IRT models designed for polytomous graded responses (Jansen & Roskam, 1986 as cited in Rubio et al., 2007; Muraki & Carlson, 1993 ), and it also works well when the items in a test have different levels of discrimination. The goal of the GRM is to model the relationship between item responses and the latent trait when the ratings include two or more ordered categories (Muraki & Carlson, 1993) .
Cronbach Alpha was used for internal consistency of all questions. Also, the bivariate correlation was used to determine the degree of association between students’ attitude toward STEM-PBL and their key demographic variables.
Through two-steps sequential multiple regression, the degree of predicting role of students’ attitude was also examined. In the first step, demographic variables were included in the model to predict GPA and in the second step attitudes variables were added to see whether students’ attitudes toward STEM-PBL can predict above and beyond demographics,
3. Results
Descriptive information for the demographic variables is shown in Table 1. Female students who participated in this study were 232 (68%), whereas males were 105 (32%). Students’ GPA were categorized into five categories from very low to very high, which more than half of the students had high and very high GPA. Parents’ education was categorized into four categories, including under diploma, diploma, bachelor, and above bachelor. Close to 50% of parents’ education was at diploma level. Finally, the amount of time that students spend on using technology during a day were categorized into three categories, one hour or less, two to three hours, and 4 hours or more.

Table 1. Descriptive information.
3.1. Validation of the STEM-PBL Measure
1) Confirmatory Factor Analysis of STEM-PBL Questionnaire
To answer the first research question regarding the underlying factors in the questionnaire, a confirmatory factor analysis was employed by using AMOS 18.0.0. The results from AMOS showed that the five factors of STEM-PBL questionnaire fit well with our data. However the analyses revealed that the removal of one of the items (item 22) may result in a better fit of the questionnaire (see Figure 2). Since discrimination of the item 22 for factor 5 is negative, −0.563, and also, difficulty level of this item for all four choices are too low, 0.955, −0.239, −0.959, −2.071, indicated that this item does not contribute enough information to the scale.
Several indicators of fit were used to test the goodness of fit of the model including Tucker-Lewis index (TLI = 0.888), comparative fit index (CFI = 0.911), root mean square error of approximate (RMSEA = 0.046), goodness of fit index (GFI = 0.911). Considering these fit indices were all within acceptable range, we concluded the model is fit for this data set (Ghasemi, 2011) . Even though chi-square (χ2 = 410.289, p > 0.000, df = 238) is significant and not in the acceptable range, according to Hooman (2012) when sample size is between 75 to
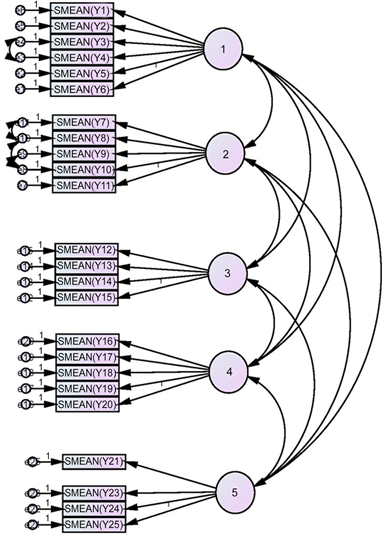
Figure 2. Confirmatory factor analysis by using AMOS 18.0.0 for five factors of STEM-PBL (1. Self-Learning, 2. Group Learning, 3. Interdisciplinary, 4. Technology, 5. Activity).
200 this index is reliable to use and upper than this range, because of impact of the sample size and also the amount of exitance correlations in the model, the chi square will be significant anyway. Thus, considering other indices would be more reliable to check the model fit examination.
As Table 2 shows, each of the variables or components has a significant correlation with the total of the scale showing an acceptable internal reliability, range from 0.606 to 0.730 at 0.001 significant level. The Cronbach’s Alpha as the reliability of the scale for 25 items was high (α = 0.803). The correlations among factors together were significant but not very high ranging from 0.145 to 0.443. This result suggested that the factors are correlated in general, but each factor is associated with some uniqueness.
2) Item Analysis
Dimensionality of STEM-PBL Questionnaire: Since factor analysis indicated 5 dimensions, for this instrument, we conducted a multidimensional IRT analysis for this data. The analysis was completed with MIRT package (Chalmers, Pritikin, Robitzsch, & Zoltak, 2015) in R. Results indicated that the proportion variance explained by these five factors was 30% of the total variability. Also, the correlations between five factors were ranged from 0.145 to 0.730 indicating a reasonable and significant association between the factors (Tabachnick & Fidell, 2007) .
Parameterization: Item parameters of the STEM-PBL questionnaire were shown in Table 3. Regarding item discriminations (a-values), all the items displayed a very rational level of discriminant ranging from 0.471 (for item 6) to 1.79 (for item 9).
Regarding the item difficulties (b-values), there are four thresholds or boundaries (b-values) in IRT for each item with 5-point Likert format (see Figure 3 for item 25). Also, in the psychological instruments, the extreme bi1 shows the least amount of the trait needed for choosing first option, and bi4 indicates the maximum level of the trait needed to move from pervious category to last category (Shojaee, Bulut, & Shahidi, 2016) . For example, for question 25, to choose the category 1 a maximum trait level (5.205) with the probability of 0.5 is required; whereas, approximately a low trait level (−0.598) with the probability of 0.5 is needed to choose the category 4, the lowest level of the trait.
Model fit: Inspecting whether GRM is an appropriate model for this type of
Table 2. Means, standard deviations, correlations, and reliabilities of study variables.
Note. N =337. Internal reliabilities are in parentheses. Reliability estimated. *p < 0.05. **p < 0.01.
Table 3. Estimated item parameters of STEM-PBL questionnaire.
data, accuracy of person parameters, expected total score diagram and the standard error of measurement were examined. In regard to person parameter (ability for participants), theta θ for all 337 participants along with their standard measurement error was computed. The theta values ranged from −2.91 to 2.21 with the standard error of 0.31 for the lowest and 0.72 for the highest theta. Statistically, this range represents a normal distribution of the students’ attitude. Thus, the person parameters supported this idea that most of the participants are in the mid-level of the trait distribution, also the level of the standard errors were reasonable. Additionally, since measuring factors are correlated to each other, this multidimensional data is categorized in compensatory model. The model indicates that if an examinee has high ability in one dimension, this high
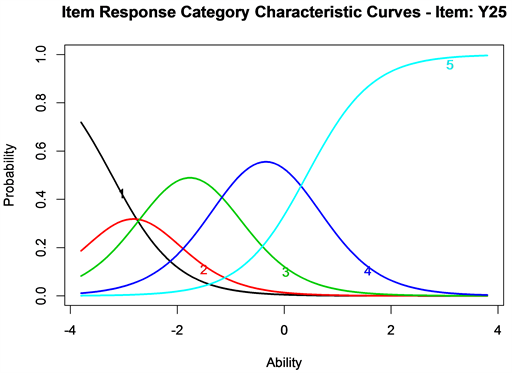
Figure 3. Item Response Category Characteristic Curves of Item 25 in the STEM-PBL Questionnaire: The curves in black, red, green, blue, and aqua blue are item difficulties for boundaries of choices from one to five respectively.
ability may compensate his or her low ability in other dimensions. Supporting this idea, the “expected total score diagram” was depicted, and it displayed that people with low level of one factor tend to choose the options (categories) with the low loading of other factors (see Figure 4).
The diagram of “Test Standard Error” displayed that when there are not enough responses in a specific level of theta, the level of error goes up. That is, there are very small amount of error in estimating the low and moderate level of positive attitude, and there is considerable amount of error to estimate the higher degree of the trait. Therefore, the precision of estimation tends to be low (De Champlain, 2010) . Moreover, comparing the plot of Test Information and simple SEM plot supports the abovementioned idea. This plot showed that most gained information come from about middle level of the trait, which is between −3 and +3, and the lowest level of measurement error occur in this interval (see Figure 5).
3.2. Predicting GPA through Students’ Attitude toward STEM-PBL and Demographic Variables
To examine the degree of GPA prediction via the students’ attitude toward STEM-PBL, a two-step sequential linear regression analysis was run. In the first step, demographic variables were included in the model to predict GPA and in the second step students’ attitudes variables were added to see whether attitudes can predict above and beyond demographics variables (see Table 4).
In Model 1, after entry of the variables in the equation, R2 = 0.182, F (6, 283) = 10.529, p ≤ 0.000. Gender (Beta = −0.857, p ≤ 0.000) followed by technology hours (Beta= −0.136, p ≤ 0.04) had a high significant contribution in predicting
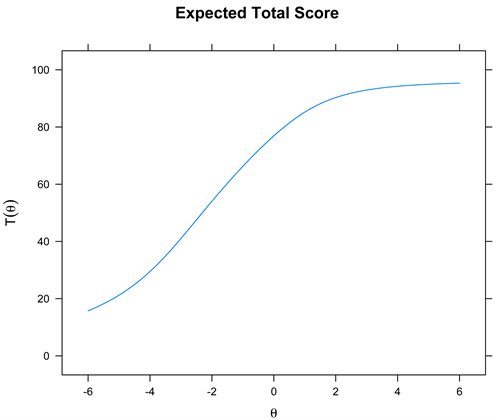
Figure 4. Expected total score for all participants.
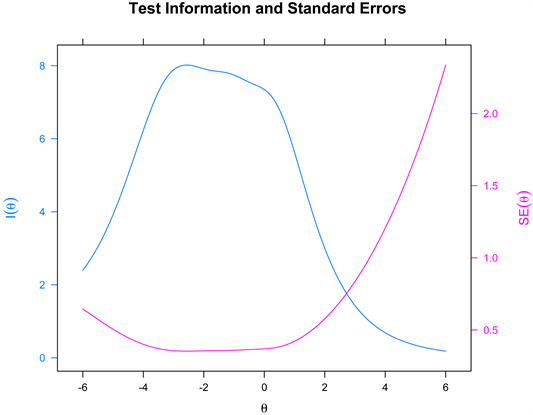
Figure 5. Test information function (the blue line) and the standard error of measurement (the red line) in KADS-11.
GPA among respondents. Adding STEM-PBL variables in Model 2, R = 0.508, F (6, 283) = 8.791, p ≤ 0.000. Self-learning (Beta = 0.074, p ≤ 0.000) had a high significant unique contribution in predicting GPA among respondents. After all, five components along with demographic variables could predict about 25.8% of variation in GPA.
Table 4. Regression results.
3.3. Investigation of Demographic Factors
The correlation coefficients between 5 factors of the STEM-PBL and demographic variables indicated that there are some relationships between these variables (see Table 5). Self-Learning as an important variable in this study has a direct correlation with students’ GPA and students’ father education. That is, the students who have a higher GPA and their father have a higher educational level, their attitude regarding self-learning is more positive. The plot of students’ means of self-learning confirmed the results (Figure 6 and Figure 7). This factor, “self-Learning”, has indirect correlation with the students age, and the number of hours that they spend using technology. This study also showed that the girls have more positive attitude about self-learning and older students have lower self-learning mark. The last thing that worth to mention about this factor is that students with the higher hours spending for technology have less tendency regarding the self-learning (Figure 8).
In addition, students’ attitude towards “Hands-on Activity” has indirect significant correlation with number of hours that they spend on technology (Figure 9). That is, as number of technology hours increases, their attitudes towards hands-on activity decrease. Other components did not show any significant relationships with different demographic variables.
4. Discussion
This study is the first study in Iran to examine the validity and psychometric
Table 5. Correlations between 5 components & demographic variables.
**Correlation is significant at the 0.01 level (2-tailed); *Correlation is significant at the 0.05 level (2-tailed).
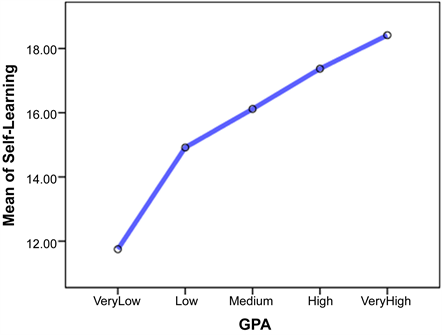
Figure 6. Relationship between GPA and self-learning as a component of students’ attitude toward STEM-PBL.
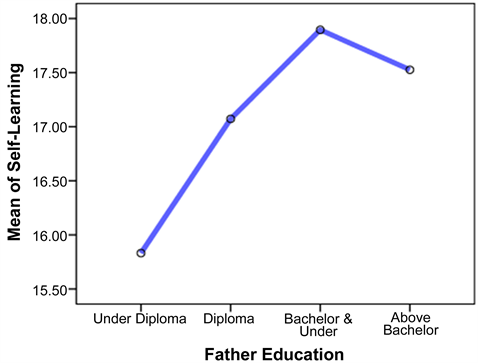
Figure 7. Relationship between fathers’ education and self-learning as a component of students’ attitude toward STEM-PBL.
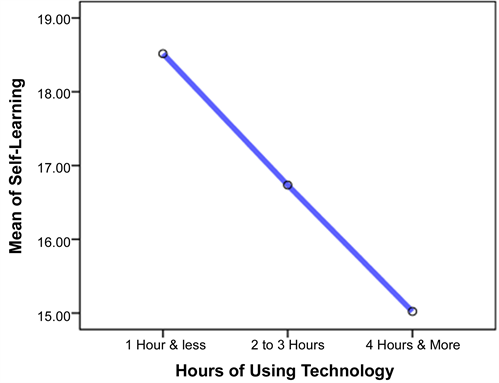
Figure 8. Relationship between use of technology and self-learning as a component of students’ attitude toward STEM-PBL.
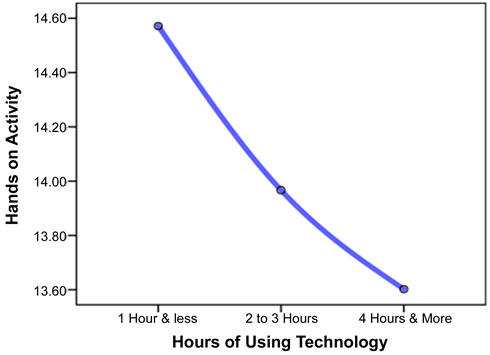
Figure 9. Relationship between use of technology and hands on activity as a component of students’ attitude toward STEM-PBL.
properties of the Questionnaire of the Student Attitude toward STEM-PBL. Although, different investigations about the factors of STEM-PBL have been conducted around the world, such study in Iran supports the use of the Questionnaire of the Student Attitude toward STEM-PBL as a tool to measure student attitudes towards STEM-PBL, and the findings of this study may show educational policy makers the benefits of STEM-PBL in the progression of educational curriculum. Revealing that all five components of STEM-PBL questionnaire (including self-learning, group learning, interdisciplinary, technology, and activity) were matched with the new sample, the findings of this replication was in the line of other previous studies (Han et al., 2016; Han et al., 2014; Shahin & Top, 2015; Lim, Cha, & Noh, 2001) . However, the result of confirmatory factor analysis through using AMOS showed that item 22 of the questionnaire should be removed or reconsidered from the list of questions (Table 3 & Figure 2). Moreover, this study reveals the higher reliability for all components of Student Attitude toward STEM-PBL Questionnaire, which aligns with other previous studies (Han et al., 2016; Han et al., 2014; Han, 2017; Shahin & Top, 2015) . Using IRT-GRM to analyze data provided the researchers with more technical information regarding the psychometric properties of each item. All questionnaire items display reasonable psychometric properties, which further support the use of Student Attitude toward STEM-PBL Questionnaire.
In this study, the second research question was focused on the prediction of students’ GPA by means of the components of students’ attitude toward STEM-PBL. GPA represents the degree of academic performance to which a student has accomplished specific goals of learning such as the acquisition of knowledge and understanding in a specific intellectual domain which generally called discipline (Steinmayr, Meissner, Weidinger, & Wirthwein, 2015) . That also refers to the degree of learning or a specific level of expertise in different areas of inquiry or research that was accomplished through formal education at schools, colleges, or universities (Corsini, 2002; Cigdem, 2015; Hamaideh & Hamdan-Mansour, 2014) . The degree of prediction of GPA through using student’s attitude towards STEM-PBL can reveal the effectiveness of STEM-PBL in students’ academic achievements. Thus, considering GPA as an index of academic progression and learning, the current study also showed that attitude toward STEM-PBL can predict students’ academic achievement using GPA. This result was derived from a regression analysis, and the finding aligns with Han’s (2017) study in which students that had positive attitude toward STEM-PBL components showed increased tendency to pursue their learning and also, with Tseng et al.’s, (2013) study in which more academic progression in STEM-PBL was reported. However, the role of demographic variables in predicting GPA was prominent too.
The third question was focused on the relationships among five factors of the STEM-PBL and student demographic variables including age, GPA, mother’s education, father’s education, and the hours using technology. Of all five components of STEM-PBL, self-Learning has a direct association with students’ GPA and students’ father education. It means that the students who have a higher GPA and their father have a higher educational level, their attitude regarding self-learning is more positive. This factor, self-Learning, has indirect correlation with students age, and the number of hours that they spend using technology (Figure 8). One of the important findings of this research is about the relationship between the time of using technology and hands-on activity as a component of the students’ attitude toward STEM-PBL. The result showed that this relationship is indirect. That is, the more time in using technology such as computer, cell phone or others, the more negative attitude toward hands-on activity in STEM-PBL (Figure 9).
5. Conclusion
Generally, the study not only corroborated the beneficial role of STEM-PBL as an interdisciplinary curriculum, but also revealed that the Questionnaire of the Student Attitude toward STEM-PBL has reasonable reliability to use in Iranian samples. However, the question 22 in this questionnaire should be revised and refined to fit the scale. Also, the power of this questionnaire to predict students’ academic achievement increased the applicability of the scale in different learning settings; hence, researchers can confidently utilize the questionnaire for assessing students’ academic progression. The study displayed that fathers’ educational levels have direct impact on students’ academic performance. Unlike previous studies, the current research revealed that spending more time in using technology such as cell phone will increase more negative attitude toward applied activities in STEM-PBL.
Implications
The findings of this research provide evidence of using a reliable and valid scale for assessing students’ attitude toward STEM-PBL in Iranian student population. Additionally, the results in this paper can be used in educational settings to monitor students’ attitude and offer proper interventions to enhance academic achievement.
Regarding our finding related to indirect relationship between students’ attitude towards hands on activity and the number of hours using technology, it is recommended that educators, educational policy makers, and even families encourage students to balance technology use and activities that promote students to be active and involve.
Conflicts of Interest
The authors declare no conflicts of interest regarding the publication of this paper.
Cite this paper
Shojaee, M., Cui, Y., Shahidi, M., & Zhang, X. X. (2019). Validation of the Questionnaire of Students’ Attitudes toward STEM-PBL: Can Students’ Attitude toward STEM-PBL Predict their Academic Achievement? Psychology, 10, 213-234. https://doi.org/10.4236/psych.2019.102017
References
- 1. Ackerman, T. A., Gierl, M. J., & Walker, C. M. (2003). Using Multidimensional Item Response Theory to Evaluate Educational and Psychological Tests. Educational Measurement: Issues and Practice, 22, 37-53. https://doi.org/10.1111/j.1745-3992.2003.tb00136.x [Paper reference 1]
- 2. Asghar, A., Ellington, R., Rice, E., Johnson, F., & Prime, G. M. (2012). Supporting STEM Education in Secondary Science Contexts. Interdisciplinary Journal of Problem-Based Learning, 6, 85-125. https://doi.org/10.7771/1541-5015.1349 [Paper reference 1]
- 3. Bartolucci, F., Bacci, S., & Gnaldi, M. (2012). MultiLCIRT: An R Package for Multidimensional Latente Class Item Response Models. arXiv:1210.5267v1 [stat.AP]. [Paper reference 1]
- 4. Capraro, M. M., & Jones, M. (2013). Interdisciplinary STEM Project-Based Learning. In R. M. Capraro, M. M. Capraro, & J. R. Morgan (Eds.), Project-Based Learning: An Integrated Science, Technology, Engineering, and Technology (STEM) Approach (pp.51-58). Rotterdam, The Netherlands: Sense Publishers. https://doi.org/10.1007/978-94-6209-143-6_6 [Paper reference 1]
- 5. Capraro, R. M., & Corlu, M. S. (2013). Changing Views on Assessment for STEM Project-Based Learning. In R. M. Capraro, M. M. Capraro, & J. R. Morgan (Eds.), Project-Based Learning: An Integrated Science, Technology, Engineering, and Technology (STEM) Approach (pp.109-118). Rotterdam, The Netherlands: Sense Publishers. https://doi.org/10.1007/978-94-6209-143-6_12 [Paper reference 1]
- 6. Capraro, M. R., & Slough, W. S. (2013). Why PBL? Why Stem? Why Now? An Introduction to Stem Project-Based Learning: An Integrated Science, Technology, Engineering, and Mathematics (Stem) Approach. In R. M. Capraro, M. M. Capraro, & J. R. Morgan (Eds.), Project-Based Learning: An Integrated Science, Technology, Engineering, and Technology (STEM) Approach (pp.1-6). Rotterdam, The Netherlands: Sense Publishers. https://doi.org/10.1007/978-94-6209-143-6_1 [Paper reference 1]
- 7. Chalmers, P., Pritikin, J, Robitzsch, A., & Zoltak, M. (2015). Mirt: Multidimensional Item Response Theory. (Computer Software) http://CRAN.Rproject.org/package=mirt [Paper reference 1]
- 8. Cigdem, H. (2015). How Does Self-Regulation Affect Computer-Programming Achievement in a Blended Context? Contemporary Educational Technology, 6, 19-37. [Paper reference 1]
- 9. Corlu, M. S., Capraro, R. M., & Capraro, M. M. (2014). Introducing STEM Education: Implications for Educating Our Teachers for the Age of Innovation. Education and Science, 39, 74-85. [Paper reference 1]
- 10. Corsini, R. (2002). The Dictionary of Psychology. New York: Brunner-Routledge. [Paper reference 1]
- 11. De Champlain, A. F. (2010). A Primer on Classical Test Theory and Item Response Theory for Assessments in Medical Education. Medical Education, No. 44, 109-117. https://doi.org/10.1111/j.1365-2923.2009.03425.x [Paper reference 1]
- 12. Duke, N. K., Halvorsen, A.-L. & Strachan, S. L. (2016). Project-Based Learning Not Just for STEM Anymore. Phi Delta Kappan: SAGE Journal, 98, 14-19.https://doi.org/10.1177/0031721716666047 [Paper reference 1]
- 13. Ghasemi, V. (2011). Structural Equation Modeling in Social Research Using Amos Graphics. Iran: Jameeshenasan. [Paper reference 1]
- 14. Hall, A., & Miro, D. (2016). A Study of Student Engagement in Project-Based Learning across Multiple Approaches to STEM Education Programs. School Science and Mathematics, 116, 310-319. https://doi.org/10.1111/ssm.12182 [Paper reference 1]
- 15. Hamaideh, S. H., & Hamdan-Mansour, A. M. (2014). Psychological, Cognitive, and Personal Variables That Predict College Academic Achievement among Health Sciences Students. Nurse Education Today, 34, 703-708. https://doi.org/10.1016/j.nedt.2013.09.010 [Paper reference 2]
- 16. Han, S. (2017). Korean Students’ Attitudes toward STEM Project-Based Learning and Major Selection. Educational Sciences: Theory & Practice, 17, 529-548. https://doi.org/10.12738/estp.2017.2.0264 [Paper reference 9]
- 17. Han, S., & Carpenter, D. (2014). Construct Validation of Student Attitude toward Science, Technology, Engineering, and Mathematics Project-Based Learning: The Case of Korean Middle Grade Students. Middle Grades Research Journal, 9, 27-41. [Paper reference 18]
- 18. Han, S., Capraro, R. M., & Capraro, M. M. (2016). How Science, Technology, Engineering, and Mathematics Project-Based Learning Affects High-Need Students in the U.S. Learning and Individual Differences, 51, 157-166. https://doi.org/10.1016/j.lindif.2016.08.045 [Paper reference 4]
- 19. Han, S., Capraro, R., & Capraro, M. M. (2014). How Science, Technology, Engineering, and Mathematics (STEM) Project-Based Learning (PBL) Affects High, Middle, and Low Achievers Differently: The Impact of Student Factors on Achievement. International Journal of Science and Mathematics Education, 13, 1089-1113.
- 20. Han, S., Rosli, R., Capraro, M. M., & Capraro, R. M. (2016). The Effect of Science, Technology, Engineering and Mathematics (STEM) Project-Based Learning (PBL) on Students’ Achievement in Four Mathematics Topics. Journal of Turkish Science Education, 13, 3-29. http://www.tused.org
- 21. Henning, K. J. (2013). Attitude and Achievement: A Study of Parent and Student Attitudes towards Education and Their Effects on Achievement. Master’s Thesis, Wichita: Wichita State University. [Paper reference 3]
- 22. Hoge, B. (2013). Authentic Learning through GBL: Using Inquiry and PBL Strategies to Accomplish Specific Learning Outcomes through Smart Games in Formal and Informal Settings. In International Conference on Cognition and Exploratory Learning in Digital Age (pp. 363-366). International Association for Development of the Information Society. [Paper reference 1]
- 23. Hooman, H. (2012). Multivariate Data Analysis in Science Research (3th ed.). Tehran: Peyke Farhang. [Paper reference 1]
- 24. Islamic Republic News Agency (2016). Restriction of Educational Programs: Opportunity or Threat of Employment. http://www.irna.ir/fa/News/82161605 [Paper reference 1]
- 25. Kumari, S., & Nandal, S. (2016). Emergence of Project-Based Learning in Professional Education. Scholedge International Journal of Multidisciplinary & Allied Studies, 3, 208-214. https://doi.org/10.19085/journal.sijmas031001 [Paper reference 4]
- 26. LaForce, M., Noble, E., & Blackwell, C. (2017). Problem-Based Learning (PBL) and Student Interest in STEM Careers: The Roles of Motivation and Ability Beliefs. Education Sciences, 7, 92. https://doi.org/10.3390/educsci7040092 [Paper reference 1]
- 27. Lim, H., Cha, J., & Noh, T. (2001). The Relationships of Verbal Behaviors with Learning Variables in Cooperative Learning Environments, and Middle School Students’ Perceptions of Cooperative Learning. Journal of the Korean Association for Research in Science Education, 21, 487-496. [Paper reference 1]
- 28. Lou, S. J., Liu, Y. H., Shih, R. C., & Tseng, K. H. (2011). The Senior High School Students’ Learning Behavioral Model of STEM in PBL. International Journal of Technology Design Education, 21, 161-183. [Paper reference 1]
- 29. Mohr-Schroeder, M. J., Jackson, C., Miller, M., Walcott, B., Little, D. L., Speler, L., Schooler, W., & Schroeder, D. C. (2014). Developing Middle School Students’ Interests in STEM via Summer Learning Experiences: See Blue STEM Camp. School Science and Mathematics, 114, 291-301. https://doi.org/10.1111/ssm.12079 [Paper reference 1]
- 30. Muraki, E., & Carlson, E. J. (1993). Full-Information Factor Analysis for Polytomous Item Responses. In Annual Meeting of the American Educational Research Association (pp. 1-33). Atlanta, GA, 12-16 April 1993. [Paper reference 2]
- 31. Najafi, M., Ebrahimitabass, E., Dehghani, A., & Rezaei, M. (2012). Students’ Attitude towards Science and Technology. Interdisciplinary Journal of Contemporary Research in Business, 3, 129-134. [Paper reference 5]
- 32. Oscarsson, M., Jidesjö, A., Karlsson, K.-G., & Strömdahl, H. (2009). Science in Society or Science in School: Swedish Secondary School Science Teachers’ Beliefs about Science and Science Lessons in Comparison with What Their Students Want to Learn. Nordina, 5, 18-34. https://doi.org/10.5617/nordina.280 [Paper reference 1]
- 33. Rubio, V., Aguado, D., Hontangas, P. M., & Hernindez, J. M. (2007). Psychometric Properties of an Emotional Adjustment Measure: An Application of the Graded Response Model. European Journal of Psychological Assessment, 23, 39-46. https://doi.org/10.1027/1015-5759.23.1.39 [Paper reference 1]
- 34. Sahin, A. (2013). STEM Project-Based Learning: Specialized form of Inquiry-Based Learning. In R. M. Capraro, & W. W. Slough (Eds.), Project-Based Learning: An Integrated Science, Technology, Engineering, and Technology (STEM) Approach (pp. 59-64). Rotterdam: Sense Publishers. [Paper reference 1]
- 35. Samejima, F. (1969). Estimation of Latent Trait Ability Using a Response Pattern of Graded Scores. Psychometrika Monograph, 34, 1-100. https://doi.org/10.1007/BF03372160 [Paper reference 1]
- 36. Schreiner, C., & Sjøberg, S. (2004). ROSE: The Relevance of Science Education. Sowing the Seeds of ROSE. Background, Rationale, Questionnaire Development and Data Collection for ROSE—A Comparative Study of Students’ Views of Science and Science Education. Oslo: Department of Teacher Education and School Development, University of Oslo. http://www.ils.uio.no/forskning/rose [Paper reference 1]
- 37. Shahin, A., & Top, N. (2015). STEM Students on the Stage (SOS): Promoting Student Voice and Choice in STEM Education through an Interdisciplinary, Standards-Focused, Project-Based Learning Approach. Journal of STEM Education, 16, 24-33. [Paper reference 6]
- 38. Shojaee, M., Bulut, O., & Shahidi, M. (2016). Examining Psychometric Properties of the Kutcher Adolescent Depression Scale (kads-11) Using Multidimensional Item Response Theory. International Journal of Current Research, 8, 27120-2713. [Paper reference 1]
- 39. Stearns, L. M., Morgan, J., Capraro, M. M., & Capraro, R. M. (2012). A Teacher Observation Instrument for PBL Classroom Instruction. Journal of STEM Education, 13, 7-16. [Paper reference 1]
- 40. Steinmayr, R., Meissner, A., Weidinger, A. F., & Wirthwein, L. (2015). Academic Achievement. Oxford Bibliographies. https://doi.org/10.1093/obo/9780199756810-0108 http://www.oxfordbibliographies.com/view/document/obo-9780199756810/obo-9780199756810-0108.xml [Paper reference 1]
- 41. Tabachnick, B. G., & Fidell, L. S. (2007). Using Multivariate Statistics (5th ed.). Boston: Allyn & Bacon. [Paper reference 1]
- 42. Tawfik, R., & Trueman, R. (2015). Effects of Case Libraries in Supporting a Problem-Based Learning STEM Course. Journal of Educational Technology Systems, 44, 5-21. https://doi.org/10.1177/0047239515596724 [Paper reference 1]
- 43. Tseng, K.-H., Chang, C.-C., Lou, S.-J., & Chen, W.-P. (2013). Attitudes towards Science, Technology, Engineering and Mathematics (STEM) in a Project-Based Learning (PjBL) Environment. International Journal of Technology Design Education, 23, 87-102. https://doi.org/10.1007/s10798-011-9160-x [Paper reference 4]
- 44. Tsigarides, J., Wingfield, L. R., & Kulendran, M. (2017). Does a PBL-Based Medical Curriculum Predispose Training in Specific Career Paths? A Systematic Review of the Literature. BMC Research Notes, 10, 24. https://doi.org/10.1186/s13104-016-2348-0 [Paper reference 1]
- 45. Veresova, M., & Dana Mala, D. (2016). Attitude toward School and Learning and Academic Achievement of Adolescents. The European Proceedings of Social & Behavioral Sciences, 870-876. https://doi.org/10.15405/epsbs.2016.11.90 [Paper reference 3]
- 46. Wallace, M. F. G., & Webb, A. W. (2016). In the Midst of a Shift: Undergraduate STEM Education and “PBL” Enactment. Journal of College Science Teaching, 46, 47-55. https://doi.org/10.2505/4/jcst16_046_02_47 [Paper reference 4]
Appendix: Demographic Survey
Gender: girl  boy
boy 
Age: 
GPA: 
Mother’s Education: Drop out  Diploma
  Bachlor
  Master and more
Father’s Education: Drop out  Diploma
  Bachlor
  Master and more
How many hours a day do you spend with technology? 1 or less  2 to 3
  4 and more
Please rank these activities in order of their time consumption (least 1 to most 4).
Games  Chatting
  academic Activities
  Social Networking