Journal of Electromagnetic Analysis and Applications
Vol. 2 No. 7 (2010) , Article ID: 2344 , 7 pages DOI:10.4236/jemaa.2010.27059
Return Signal Intensity Ratio Modulates the Impact of Background Signal on Ozone DIAL Night Time Measurement in the Troposphere
![]()
1School of Atmospheric Physics, Nanjing University of Information Science and Technology, Nanjing, China; 2 Electrical Physics Department, Komae Research Laboratory, Central Research Institute of the Electric Power Industry, Tokyo, Japan.
Email: nwcao@yahoo.com.cn
Received December 14th, 2010; revised March 22nd, 2010; accepted April 15th, 2010.
Keywords: Differential absorption lidar (DIAL), Ozone
ABSTRACT
This paper discusses the uncertainty of ozone differential absorption lidar (DIAL) measurements due to the impact of background signal. The impact of background signal on ozone concentration profiles is proportional to the background intensity and the ratio of return signal intensities at “on” and “off” wavelength ( ) (hereinafter we call it the return signal intensity ratio). Analysis suggests that an appropriate return signal intensity ratio can make the impact of background signal very small, negligible. The simulations based on the analysis coincide with the experimental results. The experimental results show that the impact of background signal is negligible at an appropriate return signal intensity ratio of 0.96 at wavelength pair (280,285 nm). In case of unknown background intensity, we can adjust the laser pulse energy levels at the two wavelengths to obtain an appropriate return signal intensity ratio on the oscilloscope to suppress the impact of background signal and ensure the accuracy of night time ozone measurements.
1. Introduction
Measurements of ozone in troposphere by differential absorption lidar (DIAL) should be corrected for the impact of aerosol and other species [1-6]. The uncertainty of ozone DIAL measurements is related to aerosol optical properties and aerosol loading [7]. The uncertainty due to impact of other species can be removed by optimizing the wavelength pairs [8]. In order to get rid of both of the impacts of the aerosol and other species, multi-wavelength DIAL and Raman DIAL have been developed [9-10]. The uncertainty due to SO2 impact in UV region is considerable in case of high SO2 concentration from volcanic emission; but it is very small, negligible, in case of background SO2 value, 1 ~ 2 ppb [8].
Although DIAL measurements of ozone in troposphere has been developed and performed for tens years, how to treat the background intensity is still an open question. In general, background intensity is very small, and difficult to ascertain. Usually, the PMT (Photo-multiplier tube) signal before laser shots is taken as background intensity. Some researchers also take the signal at the most distance as background intensity [11]. The uncertainty of ozone DIAL measurement is sensitive to background intensity; and unknown background intensity can cause huge error. In ozone measurements the measurement wavelengths is always set as close to 300 nm (UV region). Wavelength pair (280 nm, 285 nm) is just an example. In night time ozone measurements, the background value wavelength dependence is negligible and the background is caused by dark current of PMT, or thermal noise. Therefore, investigation on how to reduce the impact of background signal is valuable. This paper focuses on discussion of the impact of background signal on ozone measurement. It includes theoretical analysis, simulations, and experiments on this issue. The aerosol and other species (such as SO2) impact on ozone measurement are not discussed here.
2. Theoretical Analysis
The results of ozone DIAL measurements are susceptible to the background intensity. During data processing, the background intensity should be subtracted from the signal. The resulting ozone concentration is very sensitive to the magnitude of the subtracted background intensity. Unknown background intensity can cause larger measurement error. How to determine the background intensity precisely is important. The impact of background signal is analyzed in this section. The focus is placed on the factors that determine the impact of background signal and the way to suppress the impact. This analysis is based on very weak background signal at night time ozone measurement.
According to lidar equation, ozone concentration can be calculated by [11]
 (1)
(1)
where, ![]() is the ozone concentration,
is the ozone concentration,  is the range resolution,
 ![]() is differential absorption cross-section,
is differential absorption cross-section,  is the return signal intensity. Because we can consider
  as constant for a given DIAL instrument, ozone concentration only depends on the later part of the equation, which we define as
 (2)
(2)
Thus, we focus on W instead of n in the following analysis.
None of the background value criterion is made. PMT signal before laser shots can be taken as background intensity; PMT signal at high altitude also can be taken as background signal, it due to the measurements condition. Assume don and doff as background intensities for the return signals at “on” and “off” wavelength, so the uncertainty for W can be explained as
 (3)
(3)
where  is the ozone concentration including the impact of background signal, and
  is the real ozone concentration without the impact of background signals.
In night time ozone measurement; usually background intensity is much smaller than lidar signal at lower distance. Therefore, we have
 (4)
(4)
Wavelength separation between the “on” and “off” wavelength is sufficiently small (usually, differential wavelength between two wavelengths pair is governed as less than 5nm) so that the background intensities and receiver optical efficiency at the “on” and “off” wavelengths can be considered to be approximately equal, respectively. Thus, single background intensity can be adopted in the calculation of the uncertainty. At night time measurement, the background intensities at two UV wavelengths with small wavelength separation can be assumed as identical![]() , with assumption
, with assumption . Using the value obtained from the PMT signal before laser shots, Equation (4) is reduced to
 (5)
(5)
Theoretically, we have  where, a is attenuation at l.
In case of , Equation (5) becomes
 (6)
(6)
We introduce A and B to represent the two terms  and
and , respectively. Usually, during the measurement time the variation of atmospheric temperature is neglected, even although the absorption cross section dependence on the temperature exists. Conventional lidar measurements represents the background value of ozone concentration profile as 45 ~ 60 ppb with 10% measurement error, and as stable over the range from 1000-4000 km [11,12]. Therefore, the extinction coefficient is almost constant over the range between 1000 km ~ 4000 km, The ozone measurements are always carried out in clear fine day, the aerosol loading is very small, especially in Japan. Most of extinction coefficient is caused by molecular. In Japan, in lidar measurements, the range correct signal (I*r2) is always smooth, and decay at constant ratio, it due to the clear fine weather condition, aerosol loading is weak and almost homogeneous. If the return signal not smooth, inhomogeneous aerosol loading occur, the ozone measurement data is not reliable, it due to aerosol error. The aerosol error topic is out of the scope of this paper. The range resolution
  is usually taken as 75 m or 150 m [11,13]. The extinction coefficients dependence on the range is very small than the return signal. So we treated A and B as constants.
Therefore we have
 (7)
(7)
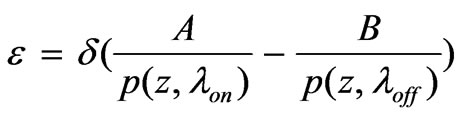
It shows that the impact of background signal depends on background intensity (d), and the quantity in the parentheses. In order to reduce the impact of background signal, we can make the background intensity smaller or make the ratio of return signal intensities at “on” and “off” wavelength  close to the value of
 .
.
A and B can be calculated with the attenuation aon and aoff which are given as [13]
 (8)
(8)
 (9)
(9)
where, n is the ozone number density (concentration), sO3(lon), sO3(loff) is ozone absorption cross section at “on” and “off” wavelength, respectively; am,on and am,off are molecule extinction at “on” and “off” wavelength, respectively; aa,on and aa,off are aerosol extinction at “on” and “off” wavelength, respectively.
According to Equations (6)-(9) with assumption of homogeneous background value of ozone concentration over range 1000 ~ 4000 km and homogeneous aerosol loading, the value of A/B dependence on range is small (~1%), and negligible.
Combine Equations (1), (2) and (7) we obtain the impact of background signal:
 (10)
(10)
From Equation (10), it can be seen that the impact of background signal depends on two factors, one is signal to noise ratio ( ) (or background intensity), the other is return signal intensity ratio (
 ). When the return signal intensity ratio equals A/B, the impact of background signal tend to be zero, in case of faint the background intensity. At high backgrounds and low signal levels the background count rate does matter even if the above condition is met. The value of A/B vary with the wavelength pairs, in other words, it is variable at different wavelength pairs (this can be seen in the following simulation with Table 1 and Figure 1), it is 1 at null profile measurement (
 ) to investigate the systematic uncertainties associated with measurements. So we can make return signal intensity ratio (
 ) close to A/B to minimize the impact of background signal, even though background intensity is not known precisely. If the signal is much larger than background signal then the background signal has little impact on the ozone retrievals, especially, in the night time measurement.
3. Simulation
Based on the theoretical analysis, we simulate the impact of background signal for four different wavelength pairs. In this simulation, we assume the error due to homogeneous aerosol loading, the statistic error due to atmospheric condition and laser stability, and the instrument systematical error due to beam alignment are all small, negligible. The simulation parameters are listed in table 1. The cross sections were taken from value in the literature [14], even although the absorption cross sections are temperature dependent, usual ozone measurements by DIAL regard the variation of atmospheric temperature as negligible during the measurement time over the range from 1000 km - 4000 km [11,13].  or Signal to Noise Ratio (SNR) is assumed as 1000 at 1000 m, 500 at 1250 m,
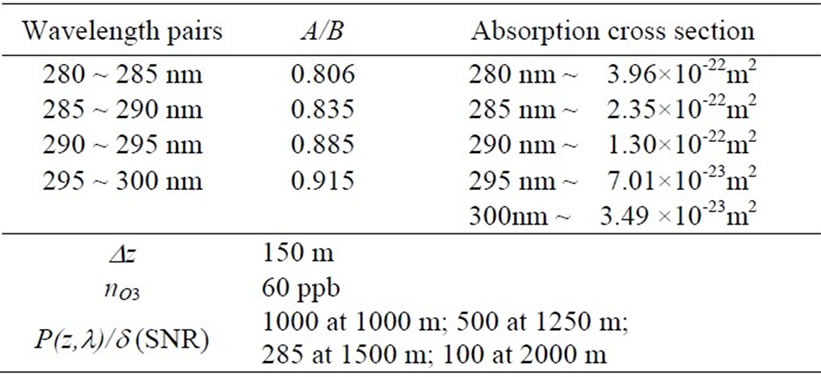
Table 1. Simulation parameter
285 at 1500 m, 100 at 2000 m. The value of 1000, 500, 285, 100 decay as the same rate of 0.28, 0.14, 0.08, 0.02 which taken from actual lidar return signal as height sequence of 1000 m, 1250 m, 1500 m, 2000 m.
The results are shown in Figure 1(a) and (b). Figure 1(a) present the relation between effects of background signal ratio at wavelength pair and SNR at different height. The lines represent the impact of background signal as a function of the return signal intensity ratio
( ) and Signal to Noise Ratio (SNR). The differential wavelength between wavelength pair is set as less than 5 nm, therefore, the aerosol scatter property of the two wavelengths should be almost same, and the differential intensity between two return signals is only due to the differential ozone absorption, the decay ratio of the return signal intensity at two wavelength dependence with height should be identical, in this case, the return
 (a)
(a)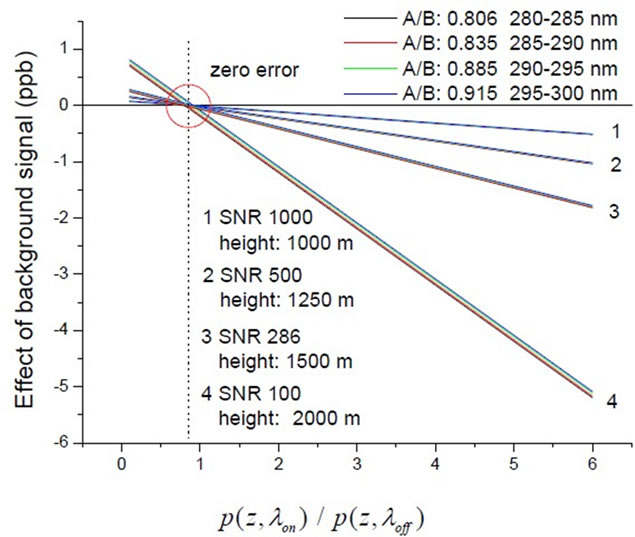 (b)
(b)
Figure 1. (a) Simulation results: the relation between effects of background signal and return signal intensity ratio at wavelength pair and Signal to Noise Ratio (SNR) at differential height. Simulation parameter is as follows: SNR 1000, height 1000m; SNR 500, height 1250 m; SNR 285, height 1500 m; SNR 100, height 2000 m; (b) Simulation result corresponding to Figure 1(a), combination of four panels of Figure 1(a).
signal intensity ratio at wavelength pair  should be constant, almost independent of height. Lidar return signal intensity at two wavelengths is impossible to be zero. Before ozone measurement, we do beam alignment associated with oscilloscope to ensure the laser beam located in the field of view (FOV) of telescope. If the lidar return intensity at any wavelength of the DIAL pair is zero, it means the beam misalignment happens, the laser beam is out of the FOV of telescope, or the laser energy drop, in this case the measurement should be meaningless, the measurement result should be nothing, it should be stopped and redo the beam alignment until the optimum lidar return occur on oscilloscope, unequal to zero. The lines all cross the x axis (y = 0) at A/B. Note that the definition of y is the impact of background signal, we call the point (x = A/B) as zero error point. This means that when the return signal ratio approaches to A/B, the impact of background signal becomes minimum (close to zero). The value of A/B is close to 1, equals 1 at null profile measurements. Therefore, we can adjust laser power levels at two wavelengths to make the return signal intensity ratio close to (A/B) to suppress the impact of background signal. In Figure 1(a) and (b), it is shown that the background error will become larger when return signal intensity become very smaller, but in case of very weak return signal the measurement result should be nothing (no physical meaning), in this case we talk about error at none measurement result is meaningless at all.
The simulation result also shows that the impact of background signal is related to the choice of wavelength pairs, the value of A/B is changeable at different wavelength pairs. Figure 1(b) corresponds to Figure 1(a), combination of four panels of Figure 1(a). The four group lines 1, 2, 3 and 4 decay at different slope which vary with SNR at different height.
4. Experimental Result
The DIAL system incorporates two tunable dye lasers pumped by two Nd: YAG lasers and a 50-cm –diam Newtonian telescope. The Nd: YAG lasers operate at a repetition rate of 10 Hz, and each dye laser can emit two wavelengths ( ,
, ) on alternate pulses, tunable within oscillation range of the dye. For ozone measurement, the wavelengths 280 nm and 285 nm were used for the on and off wavelengths, respectively. Each measurement consisted of a sequence of five profiles, each with a 2- min integration time for a measurement time of 10 min. The measurement was carried out at Komae Research Laboratory, Central Research Institute of Electric Power Industry, in Komae City, Japan (35o, 38’N, 139o, 35’E), selected from 24hours measurements data in November 2000.
The range-resolved ozone concentration profile was obtained by Equation (1). The absorption cross section of ozone was taken to be 3.96 × 10⁻²² m2 at 280 nm and 2.35 × 10⁻²² m2 at 285 nm, so .[14] The obtained return signal are processed as followings:(1) the background intensity, which was obtained from the PMT signal before laser shots, was subtracted, (2) all signals were averaged over 20 time bins corresponding to a range resolution of
 , and (3) the concentration was calculated by Equation (1).
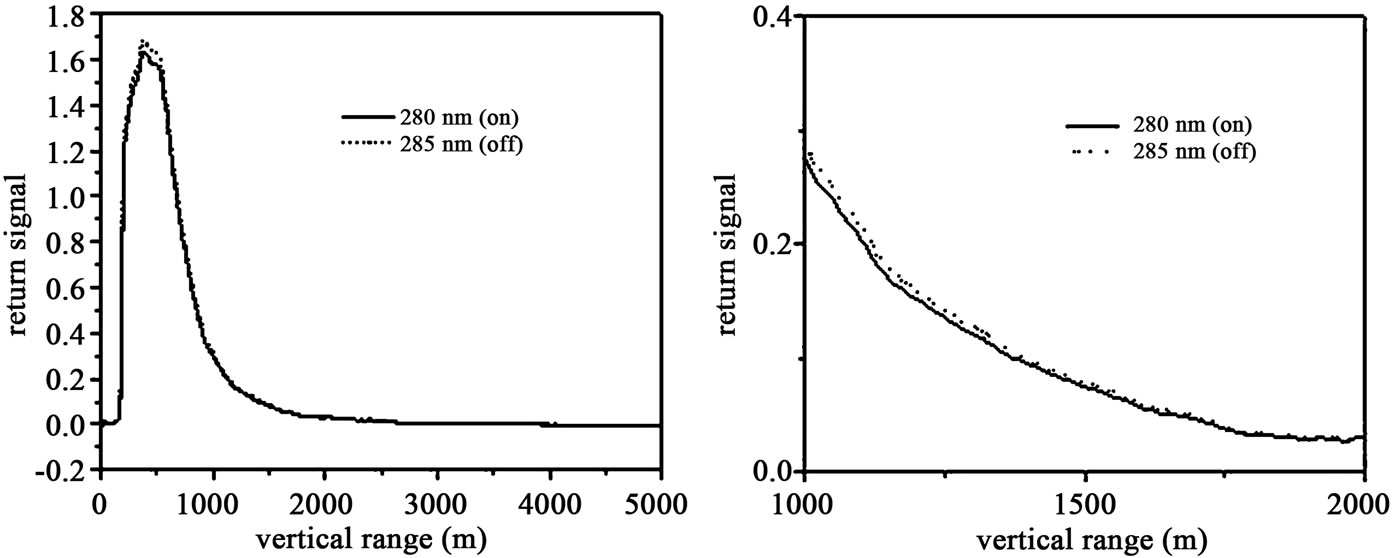
Figure 2 is the return signal for ozone measurement at  and
and . In Figure 2(a), the intensities of return signals at on and off wavelengths almost equal. Corresponding to Figure 2(a) and Figure 2(b) is enlarged over the range from 1000m to 2000 m. In Figure 2(b) the peak return signal intensity ratio
 (a) (b)
Figure 2. Return signals of on and off wavelengths at 280nm and 285nm. (a) Return signal intensity ratio is 0.96; (b) Corresponds to (a), enlarged during the range from 1000m to 2000m. (This measurement was carried out at Komae Research Laboratory, Central Research Institute of Electric Power Industry, in Komae City, Japan (35o, 38’N, 139o, 35’E), selected from 24hours measurements data in November 2000.)
( ) is 0.96. The background intensity is uncertain. We tried to take different value as background intensity for data processing. For example, the PMT signal before laser shots or the signal at the most distance have been used as the background intensity. In Figure 2(a) and (b), the intensities of the PMT signal before the laser shots were almost same as 0.009 mV, and the signal at the most distance (5 km) were about 0.0093 mV. Thus, based on Figure 2(a) and (b), we take 0.009 mV, 0.00915 mV, 0.0093 mV as background intensity. Figure 3 is the ozone concentration profiles calculated by the Equation (1) corresponding to Figure 2(a) and (b). The right panel of the Figure 3 corresponds to the left one, and is enlarged over the range from 1000 m to 2000 m. In Figure 3, the ozone concentration profiles represented by symbols (a), (b) and (c) correspond to background intensity at 0.009 mv, 0.00915 mv, and 0.0093 mv, respectively. And the profile shown by symbol (d) was obtained without subtraction of background intensity. Profiles (a), (b), (c), (d) is colored differently for easy to distinguish. From the right panel of Figure 3, we can see the four profiles represented by symbol (a), (b), (c), and (d) are almost identical. They overlap over the range from 1000 m to 2000 m. It means that in case of an appropriate return signal ratio (
 , 0.96) the impact of background signal is small, negligible. An appropriate return signal intensity ratio makes the impact of background signal on ozone concentration profiling small, and negligible, even if background intensity in unknown. In other words, an appropriate return signal intensity ratio ensures the accuracy of the ozone measurements. We adjust the laser energy to make the return signal ratio at wavelength pair (280, 285) close to 0.96 by oscilloscope; the impact of background signal is suppressed. It is showed in Figure 3. The background error is negligible (the measurements result almost has nothing to do with background value) at appropriate return ratio, therefore, in Figure 3 the ozone profiles are almost same whether background is subtracted or not.
5. Discussion and Implementation Methodology
The impact of background signal on ozone concentration profiling depends on the background intensity and return signal intensity ratio ( ). The impact of background signal is related to the choice of the wavelengths pair, we can suppress the impact of background signal according to the value of
  associated with the wavelengths pair. The small wavelengths separation minimizes the impact of hard to characterize aerosols and a judicious wavelength pair minimizes the impact of SO2 [12]. Usually, the wavelength separation is governed as less than 5 nm, and the background of SO2 concentration is about 1~2 ppb [8], very weak, in this case the SO2 impact on ozone measurement can be neglected. If in day time ozone measurement, as wavelength drops below ~300 nm the solar background rapidly falls off which has a major impact of background. This issue is not discussed in this paper and will be considered in future research. In night time ozone measurements, the background intensity is weak and also the dependence on wavelengths is negligible. Therefore, the background intensities at two wavelengths are assumed as identical.
Using an appropriate return signal intensity ratio, the impact of background signal on ozone concentration profiling is small, and negligible.
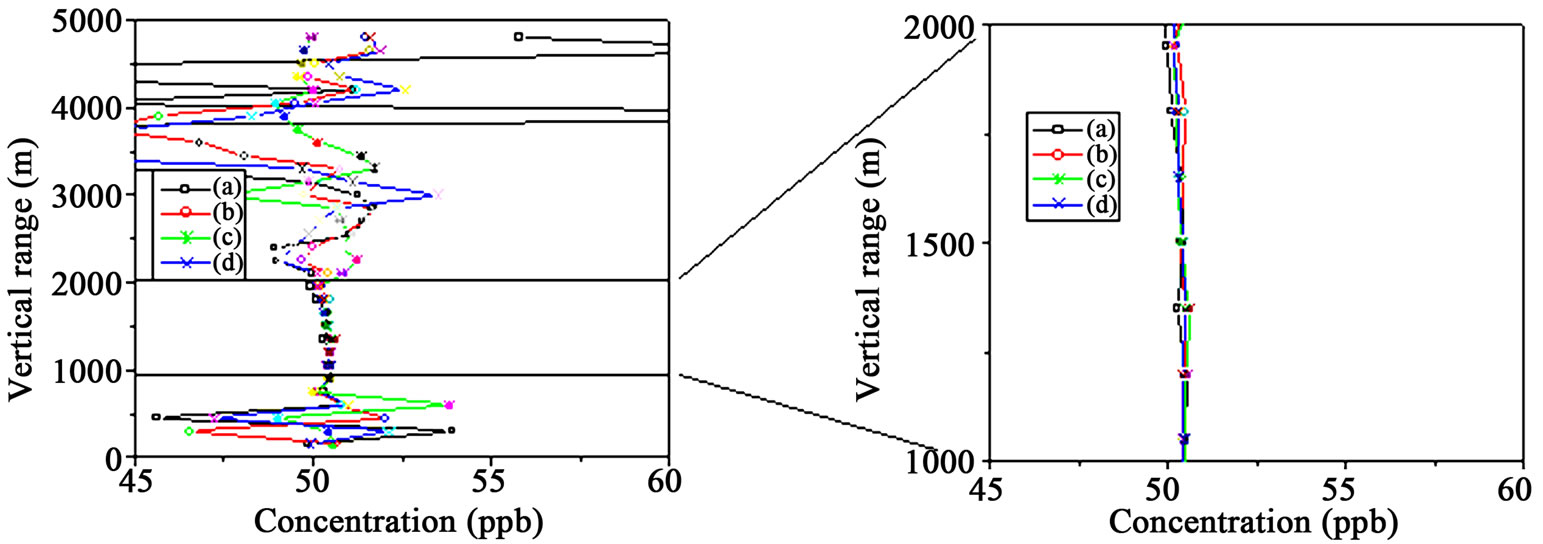
Figure 3. Effect of background signal for ozone concentration profiles at appropriate return signal intensity ratio corresponding to Figure 2(a) and (b). (The ozone concentration profiles represented by symbols (a), (b), and (c) correspond to background intensity at 0.009 mv, 0.00915 mv, and 0.0093 mv, respectively. And the profile shown by symbol (d) was obtained without subtraction of background intensity. Profiles (a), (b), (c) and (d) is colored differently for easy to distinguish.)
In real lidar operation, firstly fine beam alignment makes the return signals at two identical wavelengths overlap completely on the oscilloscope, it does the null profile measurement to calibrate the lidar system, then change one wavelength according to the DIAL pair by computer setup, and adjust the laser pulse energy levels at the two wavelengths to obtain appropriate return signal intensity ratio on the oscilloscope close to A/B to suppress the impact of background signal and ensure the accuracy of ozone measurements. The return signal intensity ratio on the oscilloscope includes the weak background signal![]() , and it is
, and it is . If
. If ,
,  exist. Actually, the return signal intensity ratio on the oscilloscope represents the return signal ratio in the above analysis.
The practical criterion of work is the night time ozone profile in the lower troposphere is homogeneous and stable at background value. Conventional ozone measurements present the background value of ozone 45 ~ 60 ppb with 10% measurement error, except the case of volcanic emission and high concentration air pollution. Calculation by Equations (8) and (9) shows the differential value of A/B at the variation of ozone concentration from 45 ppb to 60 ppb is about 1%. Therefore, we can adjust the laser pulse energy levels at two wavelengths to obtain appropriate return signal ratio close to A/B, and suppress the background error. In case of inhomogeneous ozone profile, this methodology should be modified in future research.
Except background impact, the real measurement error also includes aerosol and other species impact, instrument error due to null profile measurement, and statistical error due to atmospheric conditions variation, these error have been discussed in references [8,11-14].
REFERENCES
- E. V. Browell, S. Ismail and S. T. Shipley, “Ultraviolet DIAL Measurements of O3 Profiles in Regions of Spatially Inhomogeneous Aerosols,” Applied Optics, Vol. 24, No. 17, 1985, pp. 2827-2836.
- Z. Wang, H. Nakane, H. Hu and J. Zhou, “Three-Wavelength Dual Differential Absorption Lidar Method for Stratospheric Ozone Measurements in the Presence of Volcanic Aerosols,” Applied Optics, Vol. 36, No. 6, 1997, pp. 1245-1252.
- Y. Sasano, “Simultaneous Determination of Aerosol and Gas Distribution by DIAL Measurements,” Applied Optics, Vol. 27, No. 13, 1988, pp. 2640-2641.
- Y. Zhao, “Simplified Correction Techniques for Backscatter Errors in Differential Absorption Lidar Measurements of Ozone,” Optical Remote Sensing of Atmosphere, Vol. 18, 1991, pp. 275-277.
- A. D. Attorio, F. Masci, V. Rizi, G. Visconti and E. Boschi, “Continuous Lidar Measurements of Stratospheric Aerosols and Ozone after the Pinatubo Eruption. Part I: DIAL Ozone Retrieval in Presence of Stratospheric Aerosol Layers,” Geophysical Research Letters, Vol. 20, No. 24, 1993, pp. 2865-2868.
- W. Steinbrecht and A. I. Carswell, “Correcting for Interference of Mt. Pinatubo Aerosols on DIAL Measurements of Stratospheric Ozone,” In: M. P. McCormick, Ed., Proceedings of the 16th International Laser Radar Conference, Cambridge, 20-24 July 1992, pp. 27-30.
- V. A. Kovalev and J. L. McElroy, “Differential Absorption Lidar Measurement of Vertical Ozone Profiles in the Troposphere that Contains Aerosol Layers with Strong Backscattering Gradients: A Simplified Version,” Applied Optics, Vol. 33, No. 36, 1994, pp. 8393-8395.
- T. Fujii, T. Fukuchi, N. W. Cao, K. Nemoto and N. Takeuchi, “Trace Atmospheric SO2 Measurement by Multiwavelength Curve-Fitting and Wavelength-Optimized Dual Differential Absorption Lidar,” Applied Optics, Vol. 41, No. 3, 2002, pp. 524-531.
- A. Parayannis, G. Ancellet, J. Pelon and G. Megie, “Multiwavelength Lidar for Ozone Measurements in the Troposphere and the Lower Stratosphere,” Applied Optics, Vol. 29, No. 4, 1990, pp. 467-476.
- Z. Wang, J. Zhou, H. Hu and Z. Gong, “Evaluation of Dual Differential Absorption Lidar Based on RamanShifted Nd: YAG or KrF Laser for Tropospheric Ozone Measurements,” Applied Physics B: Lasers and Optics, Vol. 62, No. 2, 1996, pp. 143-147.
- T. Fukuchi, T. Nayuki, N. W. Cao, T. Fujii and K. Nemoto, “Differential Absorption Lidar System for Simultaneous Measurement of O3 and NO2: System Development and Measurement Error Estimation,” Optical Engineering, Vol. 42, No. 1, 2003, pp. 98-104.
- N. W. Cao, S. Li, T. Fukuchi, T. Fujii, R. L. Collins, Z. Wang and Z. Chen, “Measurement of Tropospheric O3, SO2 and Aerosol from a Volcanic Emission Event Using New Multi-Wavelength Differential-Absorption Lidar Techniques,” Applied Physics B, Vol. 85, No. 1, 2006, pp. 163-167.
- N. W. Cao, T. Fujii, T. Fukuchi, N. Goto, K. Nemoto and N. Takeuchi, “Estimation of Differential Absorption Lidar Measurement Error for NO2 Profiling in the Lower Troposphere,” Optical Engineering, Vol. 41, No. 1, 2002, pp. 218-224.
- L. T. Molina and M. J. Molina, “Absolute Absorption cross Sections of Ozone in the 185- to 350-nm Wavelength Range,” Journal of Geophysical Research, Vol. 91, 1986, pp. 14501-14508.