Journal of Biomedical Science and Engineering
Vol. 5 No. 5 (2012) , Article ID: 19437 , 4 pages DOI:10.4236/jbise.2012.55037
Z-Scan method for measurement of bovine serum albumin concentrations
![]()
1School of Medicine, Royal College of Surgeons in Ireland-Bahrain, Busaiteen, Bahrain
2Department of Basic Medical Science, Royal College of Surgeons in Ireland-Bahrain, Busaiteen, Bahrain
Email: fzhenari@rcsi-mub.com
Received 15 February 2012; revised 1 March 2012; accepted 21 March 2012
Keywords: Protein; Bradford reagent; Albumin; Z-Scan; Nonlinear refractive index
ABSTRACT
The changes in the nonlinear refractive of Bradford reagent caused by its binding to bovine serum albumin (BSA) were investigated in aqueous solutions. The nonlinear refractive index at the wavelength of 514 nm was measured using Z-scan Technique. The presence of BSA shows an increase of the nonlinear refractive index coefficient over Bradford reagent alone. The nonlinear refractive index the BSA was found to be linearly dependent on the concentration of the BSA. The nonlinear values n2 shows extended linearity over wide range of relatively high concentration. This extended linear range can be considered as an advantage over traditional absorption at peak value.
1. INTRODUCTION
Albumin is mainly made in the liver and is the major protein in the plasma. It combines chemically with other compounds such as drugs and transports them through the blood and also keeps the blood from leaking out of the vessels. Change in albumin level in the plasma such as hypoalbuminemia suggests an inflammation, malnutrition, liver and kidney disease such as cirrhosis or nephritic syndrome [1]. There are many different protein assays available to determine the concentration of proteins in solution. Of these Bradford dye is widely used because of relatively easy to prepare and forms a protein-dye complex that has a high extinction coefficient with great sensitivity in protein measurement [2]. Spectroscopic methods are used to determine the concentration of the proteins by measurement of the absorbance peak of the proteindye complex at 594 nm and by measurement of the absorbance peaks of the protein-dye complex at free dye at 594 nm and 470 nm respectively [3,4]. The Z-scan technique has been used to measure the nonlinear response of materials [6,8] and has extended to characterize different materials such as amino acid solutions and measure glucose levels in blood [5-7]. The technique relies on the fact that the intensity varies along the axis of the convex lens and it is maximum at the focus. Hence, by shifting the sample through the focus, the nonlinear refraction can be measured by observing the spot size variation at the plane of finite aperture/detector combination.
Recently [1] it was demonstrated that the nonlinear refractive index measurements, using Z-scan technique at 533nm and 632 nm can be used for determination of protein concentration prepared by Biuret method. The Biuret method and Lowry assay utilizes the colour change on the formation of Cu+-protein complexes. The Bradford assay however utilizes absorption shift from red unbound dye (465 nm) to blue complexed dye (594 nm) [2]. Due to its simplicity of use, the Bradford assay for protein content is preferred method of determination of unknown protein concentration. In this present study we report the nonlinear refractive index measurements of different concentrations of Bovine Serum Albumin (BSA) conjugated to Bradford reagent with 514 nm cw Ar-laser using Z-scan technique. This technique may be used for measuring albumin level in blood samples and as a rapid testing tool for assessing liver functionality.
2. METHODS
2.1. Preparation of Bovine Serum Albumin Sample
A sample preparation of albumin was prepared using 10 ml of distilled water added to 100 mg of Bovine Serum Albumin (BSA) supplied by Sigma-Aldrich. The sample was prepared at an optimized final concentration of 10 mg/ml.
2.2. Preparation of Bradford Reagent
Bradford reagent was prepared using 100 mg of Coomassie Brilliant Blue G-250 dissolved in 50 ml of 95% ethanol and 100 ml of 85% phosphoric acid. The final solution was diluted in water to a final volume of 1 litre [2].
2.3. Preparation of BSA Conjugated to Bradford Reagent
Four samples of different concentration of albumin coupled to a constant Bradford reagent concentration were prepared. 1 ml of Bradford reagent was added to each blank tube. 5 μl from the original BSA sample and 5 μl of NaOH were added to the first tube. The same procedure is repeated using 10 μl, 15 μl and 20 μl of BSA and 10 μl, 15 μl and 20 μl of NaOH. The final Bovine Serum Albumin (BSA) concentrations were 4.95 × 10⁻³ g/dl, 9.80 × 10⁻³ g/dl, 14.56 × 10⁻³ g/dl, and 19.23 × 10⁻³ g/dl. The reason for choosing the above concentrations is to show the extended linear dependence of measured protein concentrations by Z-scan method over spectroscopic method (see below). The prepared samples were then analyzed using a UV-Vis spectrophotometer (SHIMADZU-UV-1800).
2.4. Experimental Methods
The Z-scan technique was used to measure the nonlinear refractive index. The experiment was performed with an air-cooled Ar ion laser beam operating at 514 nm with an average power of 40 mW. The beam was focused to a beam waist of 20 μm with a lens of 5 cm focal length, giving a typical power density of 6.3 × 10⁷ W/m2. The sample was placed in a 1 mm path length quartz cuvette. The transmission from the sample was measured through an aperture (closed-aperture case) in the far-field of the lens, as the sample moved through the focal point. The difference between normalized peak-valley transmittance DTp–v is given by Eq.1:
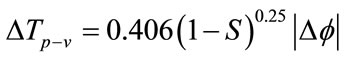 (1)
(1)
where  is the on-axis nonlinear phase shift at focus. Eq.2 defines S is the linear transmittance of the aperture:
 (2)
(2)
where ra is the radius of the aperture and Wa is the radius of the laser at the entrance of the aperture. Eq.3 gives the nonlinear phase shift:
 (3)
(3)
where n2 is the nonlinear refractive index, P is the laser power, λ is the laser wavelength, wo is the beam waist at focus and with a is linear absorption coefficient at 514 nm, L is the sample thickness and Leff is the effective thickness of the sample.
3. RESULTS
The absorption spectra of the Bovine Serum Albumin (BSA) at different concentrations and Bradford reagent are shown Figure 1. From the absorption spectra it can be seen that spectrum are characterized by one major peak in the region of 594 ± 1 nm and the value of the peak increases with increasing the concentration. There is also a shift of peak absorption of the Bradford complex relative to Bradford reagent alone. It is also noted from Figure 1 as the concentration of BSA increases, the peak at 465 nm reduces. This is an indication that BSA is chemically bound to Bradford dye.
The normalized transmittance through closed aperture for the Bradford reagent and the Bovine Serum Albumin (BSA) at different concentrations values are shown in Figure 2. This normalized transmission curve is characterized by a prefocal peak followed by a postfocal valley.

Figure 1. Absorption spectra of standard (a)  Bradford reagent (b) Various concentration of [BSA] with reagent
  [BSA] 4.95 × 10⁻³ g/dl,
  [BSA] 9.80 × 10⁻³ g/dl,
  [BSA] 14.56 × 10⁻³ g/dl, and
  [BSA] 19.23 × 10⁻³ g/dl.
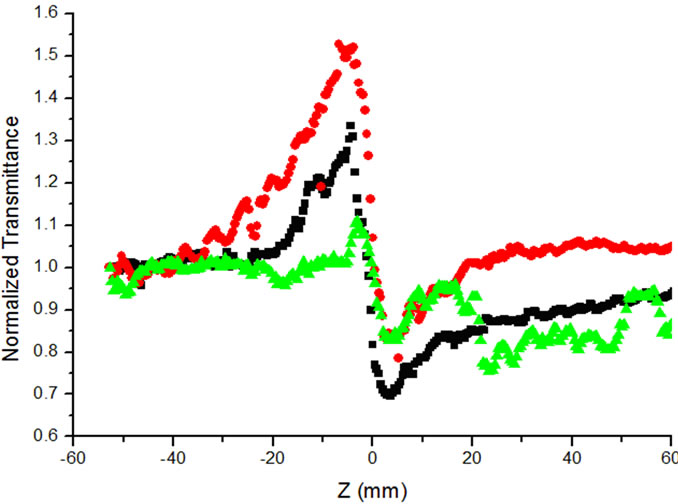
Figure 2. Normalized transmission for standard Bradford reagent  and albumin Bradford complex of different concentration of albumin.
  [BSA] 9.80 × 10⁻³ g/dl,
  [BSA] 19.23 × 10⁻³ g/dl.
This peak valley configuration implies that the nonlinear refractive index of solution is negative (n2 < 0). The changes of linear and nonlinear absorption properties are related to the concentration of BSA, Thus, the variation of the Z-scan transmission with concentration can be explained as follows: The localized absorption of the focused Gaussian beam by the sample produces a spatial distribution of the temperature in the sample solution which results in spatial variation of refractive index. This light induced change of refractive index can have considerable effect on the laser propagation in the nonlinear medium, which leads to the well known self action effect phenomena such as self defocusing, self focusing and self-phase modulation. Therefore, the observed nonlinear effect can be attributed to the thermal nonlinearity resulting from 514 nm absorption by the sample.
Figure 2 shows the results of Z-scan measurement for BSA complex at two different concentrations 9.8 × 10⁻³ g/dl and 19.23 × 10⁻³ g/dl and for Bradford reagent alone.
It can been seen from the figure as the concentration of Bovine Serum Albumin increases, the difference between normalized peak-valley transmittance ΔTp–v increases. Figure 3 shows ΔTp–v value is linearly increases with the concentration of Bovine Serum Albumin. The nonlinear refractive index (n2) is calculated from the normalized transmittance value of ΔTp–v using eqs.1-3 for different values of albumin concentration. For each concentration the experiment is repeated three times and the mean values were calculated for ΔTp–v. These values are used for calculation of nonlinear refractive indices (n2).
Figure 4 shows the calculated values of nonlinear refractive index (n2) linearly increases with concentration of BSA. The plotting of the measured nonlinear refractive index as a function of the concentration may be used for measurements of unknown total albumin content in
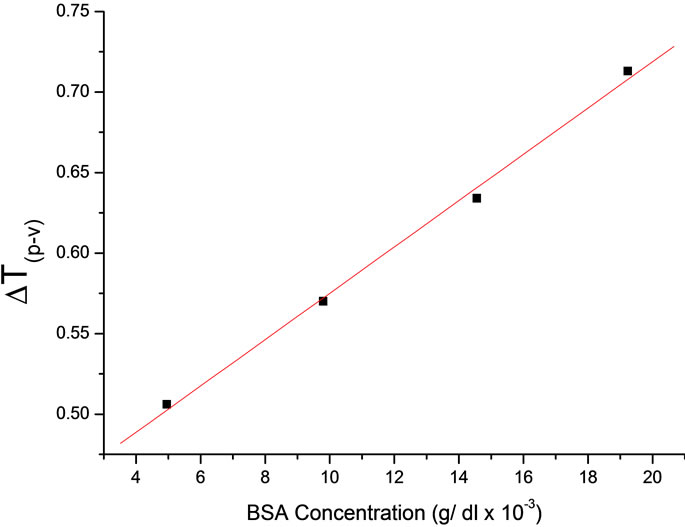
Figure 3. Variation of ΔTp–v as a function of concentration of BSA.
sample.
This can be achieved by measuring the nonlinear refractive index of the Bradford reagent alone and subtracted from the nonlinear values of the different concentration of albumin in the regent. However the total albumin concentration can be determine from the measuring ΔTp–v once the Z-scan experiment established.
An important point to be considered is that the calculation of n2 is not needed since the transmission change ΔTp–v is proportional to n2. Figure 3 shows the plot of the of ΔTp–v variation for albumin Bradford complex at different concentration.
Figure 5 shows the measured values of absorbance at 594 nm for different BSA concentration as can be seen. The value of absorbance is linear up to 9.8 × 10⁻³ g/dl. Typically, the limitations of the Bradford assay is a loss of linearity approaching 20 g/dl, often resulting in the
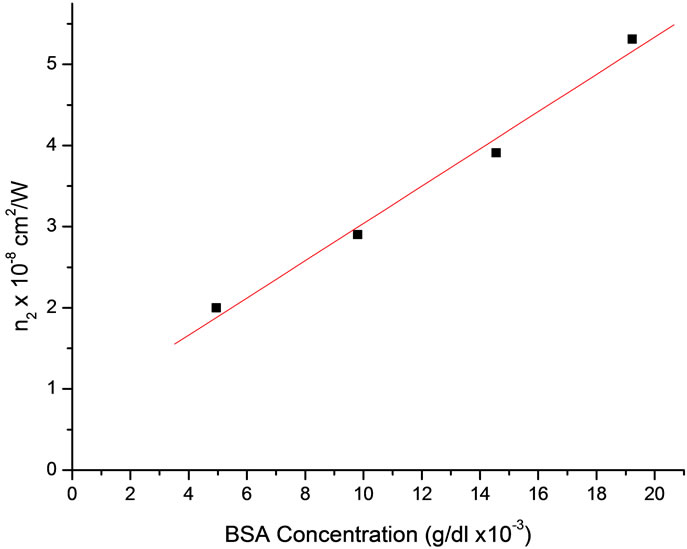
Figure 4. Variation of the nonlinear refractive index for albumin Bradford complex at different albumin concentrations. The drawing line is a linear fit to the data.
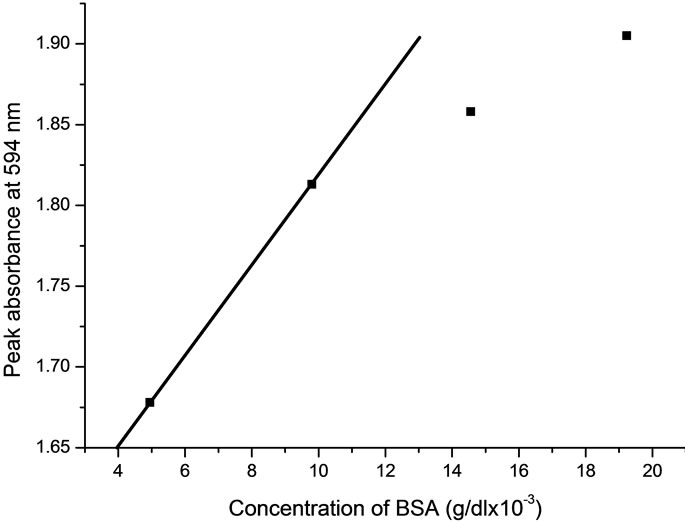
Figure 5. Variation of peak absorption value for various concentrations of BSA.
need to dilute protein samples [2]. Here, the nonlinear values n2 (ΔTp–v) shows extended linearity, therefore a wide range of relatively high concentration of BSA can be measured from calibrated graph of (n2) which is better fits of linear regression.
This extended linear range observed by Z-scan measurements can be considered as an advantage over the traditional absorption spectra. The above results demonstrate an important practical achievement since the Z-scan measurements may be used to determine the BSA concentration. This relative simple procedure increases the linear range by 10 folds, permitting the quantification of the BSA concentration at a greater range values. Furthermore the technique is simple and less expensive compared to traditional spectroscopic measurements.
4. CONCLUSION
Z-scan experiments indicate that the Bovine Serum Albumin (BSA) conjugated to Bradford dye exhibit nonlinear refractive index. The nonlinear refractive indexes for different Bovine Serum Albumin (BSA) conjugated to Bradford dye were measured at different concentrations. The preliminary results show that varying the concentration of BSA increases the nonlinear refractive index in the sample. The experiment illustrated that the nonlinear refractive index measurements can be considered for measuring the concentration values of albumin level in various samples such as CSF (cerebro-spinal fluid blood and urine. Technically the Z-scan has an advantage over conventional spectrometric method because it is easy use and less expensive especially when the experiment is conducted by commonly used helium laser operated at 633 nm wavelength. This technique may be used for detection of the serum protein level in the blood.
5. ACKNOWLEDGEMENTS
We thank Dr Seamus Cassidy for his help and clarifying discussions.
![]()
![]()
REFERENCES
- Dhinaa, A.N. and Palanisany, P.K. (2010) Z-scan technique: To measure the total protein and albumin in blood. Journal of Biomedical Science and Engineering, 3, 285- 290. doi:10.4236/jbise.2010.33038
- Bradford, M.M. (1976) A rapid and sensitive method for the quantitation of microgram quantities of protein utilizing the principle of protein-dye binding. Analytical Chemistry, 72, 248-254.
- Chial, H.J. and Splittgerber, A.G. (1993) A comparison of the binding of Coomassie brilliant blue to proteins at low and neutral pH. Analytical Biochemistry, 213, 362- 369. doi:10.1006/abio.1993.1433
- Compton, S.J. and Jones, C.G. (1985) Mechanism of dye response and interference in the Bradford protein assay. Analytical Biochemistry, 151, 369-374. doi:10.1016/0003-2697(85)90190-3
- Passad, P N. and Williams, D.J. (1991) Introduction to nonlinear effects in molecules and polymers, Wiley, New York, 307.
- Henari, F.Z. and Culligan, K.G. (2010) The influence of pH on nonlinear refractive index of bromophenol blue. American Journal of Applied Sciences, 1, 27-30.
- Shen, Y.R. (2003) The principles of nonlinear optics. John Wiley and Sons Ltd., New Jersey.
- Sheik-Bahae, M., Said, A.A., Wei, T.H., Hagan, D.J. and Van Stryland, E.W. (1990) Sensitive measurement of optical nonlinearities using single beam. IEEE Journal of Quantum Electronics, 26, 760-769. doi:10.1109/3.53394