Journal of Geographic Information System
Vol. 4 No. 1 (2012) , Article ID: 17067 , 7 pages DOI:10.4236/jgis.2012.41008
City Routing Velocity Estimation Model under the Environment of Lack of Floating Car Data
1Department of Survey and Geo-Informatics, Tongji University, Shanghai, China
2Key Laboratory of Advanced Engineering Surveying of SBSM, Tongji University, Shanghai, China
Email: *liuchun@tongji.edu.cn
Received October 16, 2011; revised November 19, 2011; accepted December 11, 2011
Keywords: Road Network; Multi Linear Regression; Floating Car Data (FCD); Velocity Estimation
ABSTRACT
After introducing the principle of float car data (FCD), this paper gives the primary flow of pre-handing and mapmatching of the FCD. After analyzing the percentage of coverage of FCD on the road network, large quantity of heritage database of routing status is used to estimate the routing velocity when lack of FCD on parts road segments. Multi liner regression model is then put forwarded by considering the spatial correlativity among the road network, and some model parameters are deduced when time series is classified in day and week. Besides, error of velocity probability and error of status probability are achieved based on the result from field testing while the feasibility and reliability of the velocity estimation model is obtained as well. Finally, as a case study in Shanghai center area, the whole routing velocity in the road network is estimated and published in real time.
1. Introduction
Efficient traffic control and reliable traffic information services require reliable status information of entire road network in real time. Generally, traffic status can be detected by fixed sensors, such as inductive loops, video systems [1]. However, vehicle speed and traffic flow measured by fixed sensors couldn’t completely cover the entire road network. Actually, traditional observation about traffic flow in space and time has been hardly reflected complexity of traffic itself in micro and macro [2].
In recent years, since the mobile sensors are widely used in many traffic conditions identification, the floating car data method has become an instrument for estimating the routing velocity in the road network. This method uses traffic information such as car location, speed and direction gathered by a highly distributed moving vehicle in the traffic flow, to calculate the road velocity based on certain model. For example, using GPS sensors placed in cars can obtain location and velocity of a large number of vehicles; these data play an important role in traffic planning and management, as well as Intelligent Transportation System and Service. That is any GPS equipped vehicles can be a sensor to collect the real-time traffic information of the routs where vehicles drove. These data are needed for describing traffic congestion, calculating routing velocity and publishing current traffic announcement, etc [3].
As a new method of urban traffic information collection, floating car is emphasized by both domestic and foreign experts of ITSS or enterprises, and there have been a number of theories and applications about FCD [4]. ADVANCE was launched in 1991 as a major test of a dynamic, in-vehicle route guidance system in the United States. The objective was to determine if motorists would be given information which would help them avoid congestion and improve the quality of their trip. Germany Aerospace Center used 4000 sensors placed on roadways and 25000 collecting vehicles from BMWs and Volkswagens to provide service for each OEM [5]. The UK company Trafficmaster started to collect and process traffic data since it announced to be a private company in1998, and it offered traffic information service based on the data collected from static sensors and supplemented by FCD [6]. P-DRGS in Japan gathered various kinds of vehicle information, and then sent traffic predictive information to the navigation device installed in cars by using wireless communication. At the same time, navigation device installed in cars is also used to collect traffic information and realize traffic forecast. Swiss OPTIS was committed to studying the data collecting method that could provide good travel information links at reasonable cost. In comparison, intelligent traffic construction started late in china. Colleges, research institutes, enterprises and public institutions began to stat cooperation and do independent research on the floating car data collection and processing [3]. Now, the number of floating car used as data collection terminal has developed to a certain scale in some cities, such as Beijing, shanghai, Guangzhou, Hangzhou, Ningbo, etc.
The existing studies related to the traffic information collection system based on floating car mostly concentrate on the costs, floating car quantity, system structure and accuracy, etc [7]. Due to the unique mobility and limited number of floating car, the real-time floating car data could not cover all the road networks, using appropriate method could guarantee data integrity and improve efficiency of application. Therefore, exploring the coverage of floating car data and method for estimating and information matching are practically, this is also major issue in the paper.
2. Floating Car Data Collection and Map Matching
2.1. Floating Car Data
Floating car data refers to the data (such as speed, distance and travel time) being collected by sensor equipped vehicles roaming the road network in a fixed time interval. The data are sent to the information center in a variety of ways. After being analyzed, traffic data are stored in a large-scale shared database which provides varied real-time traffic information for different road users. The essence is that using sample from vehicles overall network to reflect the general road conditions.
Using GPS installed in vehicle to collect FCD enable us to obtain a series of discrete location data, its format is similar to the common GPS data format. Generally, the format of floating car data is relatively flexible and location data is required. In this paper, real-time location data is based on the existing 3000 taxis in shanghai, these taxis record information including time, longitude/latitude coordinate and instantaneous velocity with 2 seconds sampling interval. The traffic control center set 30 seconds as time interval to receive information, that is, vehicle position information is obtained every 30 seconds under normal circumstances [7]. After analyzing, the system promulgates information in 5 minutes interval, so the average speed of road segment for each 5 minutes is deduced. In accordance with the road grades, smooth, crowed and congestion are denoted by green, yellow and red, the complete city real-time traffic map could be obtained combing with map performance. The floating car data format used for this research is shown in Table 1.
2.2. Coverage of Floating Car Data in Road Network
Floating car data collection system requires a combination of map to performance thematic map, so the road network vector meet the system requirement needs processing [3]. Figure 1 shows 1 hour historical data points and partial enlargement in central shanghai based on 3000 floating car. As can be seen from Figure 1, the position points of FCD can cover the entire central network well, according to the partial enlargement; using floating car data is a good method to simulate the real condition of road network. With the distribution of historical vehicle data accumulated over a certain period of time, the percentage of coverage of FCD is sufficient for effectively describe the distribution of real road network.
2.3. Map Matching
FCD map matching is one of the key technologies of the traffic information collection and processing based on floating car, the map matching compares track of vehicle location calculated by position device with road data in electronic database, determine the most driving road segment and position in this road segment by a specific algorithm, so as to estimate routing velocity.

Table 1. Data format description of float car data.

Figure 1. Plot points of FCD in Shanghai center area and its part enlarged drawing.
Map matching concepts and method mainly come from the vehicle navigation system [8]. However, the purpose of floating car map-matching, object size, speed and matching rate requirement are very different with the vehicle navigation map matching, so these techniques can not directly be applied to the floating car traffic information processing. First of all, the purpose of floating car map matching is to transform vehicle position information into travel time of the road, it doesn’t need high matching rate as vehicle navigation map matching does. Secondly, the object scale of floating car map matching is large, the processing has to complete thousands of cars matching with map and require a high matching speed.
In generally, real road status information system based on FCD receives floating car data and matches to the appropriate road segment, then estimates average route velocity according to the average speed of each vehicle driving on the road. However, 1) owing to the high mobility of floating car, the percentage of coverage of the road network may not reaches 100% in non-peak hours, so some route velocity can’t be calculated as a result of missing FCD information. 2) wireless communications probably lead to losing data packet. 3) taxis are limited in the certain period of time on some road segments. These special circumstances would restrain the using of FCD, with the general algorithm useless; route velocity information gap will appears. In order to effectively address these problems, appropriate model must be estimated to perform route velocity under missing data and release the real-time traffic information.
3. Multiple Models for Velocity Estimation in Spatial Road Network
3.1. Velocity Estimation Error
Figure 2 shows time change map of coverage arterial road in shanghai at June 2008 based on FCD. According to Figure 2, average coverage of speed data on arterial road is about 60% in daylight, to obtain complete road network speed data, velocity of roads without speed data coverage need to be estimated.
Actually, the floating car real-time traffic system provides speed data every 5 minutes, the data file is named in the format “year month date_time number.txt”, the complete data of a day contain 288 files of time. As the data file at 0:00 - 0:05 on the April 1, 2008 are named as “20080401_001.txt”. Each record in the file includes code of road segments, forward speed and reverse speed. If the road lack floating cars signal to calculate velocity, this direction velocity is given the value –1. The evaluation model in the paper uses speed data provided by shanghai real-time road status system during April 1, 2008 to May 31, 2008 based on FCD, the data in June 2008 is applied to model validation. First, error in the velocity estimation is defined as follows:
1) Velocity error Suppose velocity estimated by the model is , the actual current velocity is
 , then
 .
.
2) Status error With the combination of map, the real-time traffic system provides the road status information, which describes current traffic condition as congestion, crowded or smooth for user. Therefore, in the accuracy analyzing of the model, status error variable is introduced in order to publish results to users more intuitive. Setting the status simulated by velocity based on the model as , actual current status is
![]() , the different figures represent different states, such as 0—congestion, 1—crowded, 2— smooth, then
, the different figures represent different states, such as 0—congestion, 1—crowded, 2— smooth, then .
.
3) Error probability The essence of real-time traffic system based on FCD is to random select from all the vehicles overall the network, using the sample to reflect the traffic condition, the processing of velocity estimation remains some errors. The accuracy analysis of model allows a certain amount of error. Generally, data error  satisfies
  and status error satisfies
 , these data is considered acceptable in practical application. So introduce the error probability, it is the probability
 of velocity error
  in
in ,
,  and
and  (in
(in ), and the probability
 of status error
 in
in ,
,  and
and .
.
3.2. Multiple Spatial Linear Regression
In the geographic system of multiple elements, these elements interact and interrelate. According to the characteristic of spatial location, road segment velocity is closely related to its connective road velocity.
Figure 3 shows the sketch map of multiple linear regression model about relative information of road segment, suppose the velocity Y in a direction of road segment is influenced by the velocity of K relative road segments ; the observation of group
  is
is ,
, ,
, ,
, ,
, , thus the multiple linear regression model can be described as follows:
 (1)
(1)

Figure 2. Time change map of coverage on arterial road in Shanghai at June, 2008.

Figure 3. Sketch map of multiple linear regression model about relative information of road segment.
In the formula,  is unknown coefficient, which is the weight of each relative road.
 ![]() is the random variable.
is the random variable.
If  is the fitted value of
 , then regression equation:
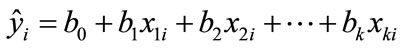 (2)
(2)
In the formula,  is a constant,
  are partial regression coefficients of which the meaning is the average change in value of the dependent variable
 , when the variable
  changes by one unit in the case that the other variables
  are fixed.
According to least square method, fitted value ![]() of
of  should satisfy:
 (3)
(3)
Based on the necessary condition of extreme value, the normal equations set can be estimated:
 (4)
(4)
Express in matrix form:
 (5)
(5)
In the formula,


Solve the equations set can obtain:
 (6)
(6)
After the building of regression model, the reliability of the model requires to be tested to evaluate the quality of the model. The significance test of linear regression equation can be completed via  test.
test.
Figure 4 shows Road network in Shanghai center area with direction and enlarged drawing around Siping road, the arrows point from start to finish of the roads. As the figure shows, the travel speed of road segment 670 is relevant to the travel speed of road segment 125, 232, 3352, 4109 and 4110 (See Table 2).

Figure 4. Road network in Shanghai center area with direction and enlarged drawing around Siping road.

Table 2. Associated attribute information of road segment link to segment 670.
The multi linear regression simulation can be modeled differently according to distinct time range, such as days, hours or even every 5 minutes, in which days can be subdivided into days and day-of-week (Monday to Sunday). Each estimation of simulation coefficient has different requirement for data. The shorter the time range is, the higher the simulation accuracy is. Currently the lack of historical data has effect on the choice of models to some extent. In this case the historical typical value of Siping Road and its relevant roads on Mondays in April and May of 2008 is measured per hour, and model coefficients are calculated in the method of least squares to build the “Forward” speed multi linear regression model of Siping Road (Chifeng Rd. to Dalian Rd.) on Mondays, as Formula (7) shows.
 (7)
(7)
(Whether the regression coefficients of Siping Rd. of other days-of week can be shown? How deep can the amount of historical data influence the fitted value? Are the regression coefficients calculated offline and used online, or computed online and utilized online? Whether the result can be estimated with the historical vehicle speed that day taken into account, or in other words, is time series space-related?) Figure 5 shows the velocity comparison between real value and model value. As can be concluded from the figure, the fitted result is satisfactory.
F statistic:
 (8)
(8)
When Significant Level ,
,  , the fitted results are satisfactory.
4. Model Accuracy Inspection and Model Application
4.1. Model Accuracy Inspection
To test the model practicability, as is shown in Table 3, 22 sets of data are taken from the 288 sets of data on June 2nd, 2008 (Monday) as test data to compare the model data with actual data.

Figure 5. Velocity comparison between real value and model value.

Table 3. Result of model inspection.
Tables 4-5 are statistics of error probability of routing velocity estimation and error probability of routing status with multi liner regression. As is shown, with this method the error of velocity has a probability of 72.73% when less than 10 km/h and the percentage is 68.18% when the error of status is 0.
However, it is difficult to accord with a high accuracy requirement as well as data coverage rate with just one method to fit velocity. In practical applications, distinct methods are combined to estimate data. If the applicable requirements can be reached, first consider Multi linear regression estimation method with the highest accuracy and think about the simplest previous moment velocity estimation method and take into account the corresponding historical typical value estimation method which boasts the highest data coverage rate.
4.2. Routing Velocity Publication
Table 6 shows the velocity intervals corresponding to different status of roads of each level in Shanghai that this paper adopts. To represent the road status intuitively, the roads are divided into three status—jammed, congested and free-flowing shown in red, yellow and green. Figure 6 is a thematic map of road network status in both directions between 8:00-8:05, June 2nd, 2008, in Shanghai center area. As can be seen, a series of calculations and matching solve the problem of information gap and lead to a complete traffic information map.
5. Conclusions
As a new data source, FCD is becoming increasingly significant in real-time traffic information acquisition and traffic patterns recognition. However, if the road network lacks floating car data, it needs estimate routing velocity to obtain traffic status. Since a great number of historical databases of road are available, exploring of suitable model can be stated with the analysis of a large number of historical data, the previous moment velocity and historical average in corresponding time both can be used in estimation. In this paper, the space relations of roads is combined to study the multi linear regression model of roads and in result derives the model coefficients based on day-of-week classification. According to the test result, with this method,  the probability of the velocity error
  equals 72.73%, the probability of the status error
  is 68.18%. The multi linear regression model with space relations provides relatively higher accuracy in velocity error probability and status probability, but it has a fairly high demand for data completeness. Multiple models have to be combined simultaneously to ensure the data coverage rate after estimation and the fitted accuracy. The combination can effectively solve the problem of road information gap due to the

Table 4. Error probability of routing velocity estimation with multi liner regression.

Table 5. Error probability of routing status with multi liner.

Table 6. Velocity classification of routing status for diverse road degrees.

Figure 6. Thematic map of road network status in both direction between 8:00-8:05, June 2, 2008, in Shanghai center area.
obvious advantage and specific range of use of each method.
Proposals: To apply an example of comparison between the actual vehicle velocity and estimated results of one road. For instance, assume no data is available of one road, launch velocity estimation using model and historical data, then compare the result with the known data and conduct relevant statistical analysis.
6. Acknowledgements
The work described in this paper was supported by Innovation Program of Shanghai Municipal Education Commission (Project ID: 10ZZ25) and Key Laboratory of Geo-informatics of State Bureau of Surveying and Mapping (project ID: 200914).
REFERENCES
- M. Fukui and Y. Sugiyama, “Traffic and Granular Flow,” Springer, Tokyo, 2002.
- B. S. Kerner, “The Physics of Traffic,” Springer, Berlin, 2004.
- C. Liu, X. L. Meng and Y. M. Fan, “Determination of Routing Velocity with GPS Floating Car Data and WebGIS Based Instantaneous Traffic Information Dissemination,” Journal of Navigation, Vol. 61, No. 2, 2008, pp. 337-353.
- S. Turksma, “The Various Uses of Floating Car Data. Road Transport Information and Control,” Tenth International Conference (Conference Publication No. 472), London, 4-6 April 2000.
- S. Lorkowski, P. Mieth and R.-P. Schafer, “New ITS Applications for Metropolitan Areas Based on Floating Car Data,” ECTRI Young Researcher Seminar, Den Haag, 2005.
- B. S. Kerner, C. Demir, R. G. Herrtwich, S. L. Klenov, H. Rehborn, M. Aleksic and A. Haug, “Traffic State Detection with Floating Car Data in Road Networks,” Proceedings of the 8th International IEEE Conference on Intelligent Transportation Systems, Vienna, 13-15 September 2005, pp. 44-49. doi:10.1109/ITSC.2005.1520133
- Z. Q. Zhang, “Technology Research of Traffic Data Capture from Float Car Data,” Master Dissertation, Tongji University, Shanghai, 2008.
- J. Su, D. F. Zhou and C. S. Yue, “Real-Time MapMatching Algorithm in GPS Navigation System for Vehicles,” Acta Geodaetica et Carto Graphica Sinica, Vol. 3, No. 3, 2001, pp. 252-256.
NOTES
*Corresponding author.