Smart Grid and Renewable Energy
Vol.3 No.4(2012), Article ID:24424,8 pages DOI:10.4236/sgre.2012.34042
A More Renewable-Friendly Electrical Grid: Thermal Storage Refrigeration for Demand Response in California and Denmark
![]()
1Program for International Energy Technologies, University of California, Davis, USA; 2Agriculture and Resource Economics, University of California, Davis, USA; 3Department of Mechanical Engineering, University of California, Davis, USA.
Email: kkorn@ucdavis.edu
Received July 22nd, 2012; revised August 22nd, 2012; accepted August 30th, 2012
Keywords: Refrigeration; Demand-Response; Thermal Storage; Wind Energy; California; Denmark; Electricity; Grid
ABSTRACT
Energy storage technologies, which enable demand response, are being explored throughout the world as a component of strategies for switching to renewable intermittent energy sources and reducing peak loads. This study examines thermal storage refrigeration (TSR) technology as a case study for the potential value of demand response in California and Denmark. Using technical specifications from a TSR prototype developed at UC Davis and market data from California and Denmark, the analysis examines possible business models for the TSR refrigerators and highlights market characteristics that are important to its adoption. Results suggest that the TSR technology is not a viable option in the current market environment in Denmark, but could payback in less than 6 years in California if a part of a demand response based virtual power plant. In a hypothetical future scenario involving real-time pricing in the retail market, a high degree of price volatility would be needed to make TSR technology appealing to residential consumers. Based on this analysis, an interesting area of future work would focus on the market potential of TSR technology for commercial and industrial applications.
1. Introduction
As countries around the world begin to address a switch to renewable energy sources through national policies and initiatives, innovations on the customer’s side of the meter have been recognized as both a way to reduce energy consumption and facilitate the incorporation of intermittent sources of electricity generation. These demandside initiatives include designing more energy efficient appliances and buildings, developing smart grids, and integrating energy storage (demand response) technologies into the existing grid. This study aims to examine the potential for commercialization of one such demand response technology, thermal storage refrigeration (TSR), as a case study for the more general role of decentralized demand response implementation in modern electricity markets. The analysis focuses on the viability of TSR technology in Denmark and California and highlights some key aspects of market structure and policy that could affect the adoption of demand response technologies moving forward.
1.1. Motivation
Perhaps nowhere in the world is there a more aggressive plan to integrate renewable energy than Denmark. With a long history of environmental awareness, the Danish government has set ambitious targets to make their energy sector 100% renewable and reduce greenhouse gas emissions by 90% by the year 2050 [1]. The goal is to accomplish these reductions while also improving Danish self-sufficiency, and boosting the economy and trade. Due to the large fraction of intermittent renewable energy that is being proposed, a large component of the plan involves introducing storage and intelligent consumer appliances into the energy system. Indeed, in anticipation of wind energy penetration reaching levels of 50% and above, the Danish energy transmission system operator (TSO), Energinet.dk, and the Danish Energy Association view intelligent demand response as a way to absorb electricity in times of excess production from wind turbines and provide ancillary services to the power system. This idea of making the grid more “windfriendly” is the primary justification for examining the potential role of TSR technology in Denmark. In the United States, and particularly California, the interest in demand response has slightly different motivations. Like Denmark, California has targets for increasing the share of renewable energy technologies in its electricity generation portfolio [2] and reducing greenhouse gas emissions [3]. However, another important motivating factor for introducing appliances capable of energy storage and demand response is the high financial and environmental cost associated with meeting peak loads during the summer months. These peak loads, which can be more than 200% of the average load, require either large sources of generation that remain idle for most of the year or flexible loads that are able to reduce the peak. The major utilities in CA (Pacific Gas and Electric (PG & E), Southern California Edison (SCE), and San Diego Gas and Electric (SDG & E) currently offer incentives for consumers to participate in demand response programs, but these programs are typically limited to large customers with large amounts of flexible load.
Virtual power plants (VPP) can enable the integration of smaller loads by aggregating deferred loads from participating consumers and selling this demand response (at a profit) to the utility as regulating power. Southern California Edison and PG & E have already partnered with EnerNOC a company that utilizes such a business model [4].
Another important consideration for the potential development of demand response appliances is the evolution of smart grid technology. The “smart grid” is a somewhat amorphous term, but is generally used to describe automated controls and communications technologies that work with the existing electrical grid to respond to changing demand for electricity. The expected benefits of smart grids include more efficient transmission, reduced operations costs for utilities, reduced peak demand, and increased integration of large-scale renewable energy systems. As part of the 2009 stimulus package, $4.4 billion was allocated to modernizing the electricity grid using smart grid innovations [5]. As smart grid infrastructure continues to be rolled out, there is increasing potential for small residential consumers to contribute to load shifting using potential technologies such as TSR refrigeration. In California alone, utilities have a target of reaching 15 million installed smart meters by 2012 [6]. These meters collect energy use data within a home or business and also allow for two-way communication between the grid and appliances. By integrating this information into the control system of an appliance, the electricity consumption of that appliance can be adjusted based on the current state of the grid. The main feature of smart grids that could provide value for load-shifting technologies is dynamic pricing. Several smart grid pilot projects have been carried out and have shown that some form of dynamic pricing (real-time pricing, time of use pricing or critical peak pricing) does indeed result in consumers shifting their electricity usage away from more expensive peak periods [7,8]. Smart grid technologies are also being investigated in Europe where the EU is currently funding a large-scale pilot project on the island of Bornholm in Denmark [9]. In addition to this project, the Danish government is working with the national TSO to implement smart grids throughout the country [10] .
1.2. TSR Technology
Under a grant from the University of California Energy Institute (UCEI), UC Davis has developed a TSR system for residential applications. TSR technology is one potentially effective strategy for load shifting and reducing the incidence of rolling blackouts that occur due to peak loads. Such issues are relevant in locations with large amounts of interrupted renewable electricity generation or extremely high peak loads. The prototype built and tested in 2009 utilizes a proprietary thermal-storage eutectic phase-change storage system. Logic built into the control system prevents under or over-cooling. While this design incorporates a phase-change material (PCM), it does not require a liquid heat transfer medium such as brine. This allows use of the existing architecture of a typical residential refrigerator with only minor changes.
During low energy demand periods, such as night hours during the summer, the refrigeration unit operates in charging mode. Electrical power from the source runs the refrigerator compressor and cycles the fan to circulate cold air from the icebox (freezer) to the cold box. The standard thermostat regulates the cold box and icebox temperatures. The thermal storage device within the icebox houses the PCM, which is frozen or “charged”. After the thermal storage device is fully charged, the refrigeration unit enters a running mode. The refrigerator continues its normal compressor cycle while it is in running mode using electrical power from the grid. During high demand periods, such as may be present during summer afternoons, the controller can be signaled to go into discharge mode. In this mode, the compressor will cycle less frequently. The fan will be cycled to circulate air from the icebox, around the thermal storage material, to the cold box, thereby maintaining the temperature according the thermostat. In this mode, the cooling potential stored in the thermal storage device during the charging mode is utilized to maintain the desired refrigerator temperature at significantly reduced power consumption. If at any time the cold box or icebox temperatures fall below a threshold temperature indicated by the thermostats, the controller will enter override mode. The grid signal will be overridden and electrical power will be fully restored to the compressor. Electrical power from the grid will be used to run the compressor and cycle the fan to circulate cold air from the icebox to the cold box, as determined by the thermostat conditions.
The TSR prototype was tested using several different types of PCM and storage shapes in a commercially available residential energy star-rated refrigerator. Initial tests showed that aproprietary encased evaporator box design filled with the eutectic PCM performed best in terms of charge/discharge time and temperature control. The start-up charging cycle took 4.2 hours, which was more than twice as fast as monitored in other test combinations and the TSR refrigerator was able to maintain a cool-box temperature level below −6˚C (21.2˚F) for over 4 hours without the compressor running. During this discharge period the power demand was approximately 10% of the average power for the refrigerator without TSR. The estimated cost of incorporating TSR technology into the design of a new refrigerator at volumes of more than 1 million units is $50.
1.3. Electrical Market Structure
An important prerequisite for understanding the potential role of TSR technology in Denmark and California is to understand the structure of electricity markets in both locations. In Denmark, liberalized markets have become the dominant feature of the power industry as the wholesale, retail and ancillary services markets are all fully deregulated. California experimented with full deregulation in the late 1990’s into early 2000’s, but due to excess market influence and the California electricity crisis in 2000, retail choice for consumers wasdiscarded in favor of returning to utility providers operating as regulated natural monopolies. A basic description of the organization and operation of electricity markets in each location is given below [11].
The wholesale power market in Denmark operates as a part of the larger Scandinavian market, Nord Pool, established in 2002, and one of the largest deregulated power markets in the world. The majority of electricity consumed in the Nordic countries is traded on a day-ahead spot market called Elspot, which uses auction principles to facilitate trading between electricity producers, electricity suppliers and Nord Pool itself. In 2010, the total volume of electricity traded on the Elspot market amounted to 310 TWh and involved traders in Norway, Sweden, Denmark, Finland, Estonia, Germany and the UK Elspot is broken up into several bidding areas, with Denmark being divided into two such areas that are overseen by the TSO Energinet.dk. The job of the TSO is to both make sure that the markets are functioning properly and maintain balance in the power system at all times. In each bidding area, producers submit quantities (bids) of power that they would agree to supply to the grid the following day as well as the minimum price that they are willing to accept for that quantity. These bids are usually based on the marginal costs of generation. Electricity suppliers submit bids for quantities of power that they will need the next day based on contracts they have made with end-use consumers1. Energinet.dk totals up the power demanded by electricity suppliers and accepts producer bids to meet that amount, beginning with the lowest. The price per MW for all transactions is set as the last accepted producer bid [12]. Prices on the wholesale market generally range between EUR0.03 - 0.07 per kWh [13].
In addition to the wholesale market, there are also other markets where trading occurs; some of which are overseen by Energinet.dk and others in which Energinet.dk actually participates. The Elbas market is used for intraday electricity trading, allowing producers and electricity suppliers to trade directly with each other for the day of delivery after the spot market has closed. In addition to facilitating power trading, Energinet.dk also buys regulating power from both producers and electricity suppliers using an auction process similar to the wholesale market. Regulating power is used by Energinet.dk to correct for any differences between electricity generation and consumption that exist during or shortly after the operating hour (see Figure 1).
In order for a producer or supplier to sell power to Energinet.dk, they must be able to provide at least 10 MW of power and deliver the power within 15 minutes of notification [14]. Each producer/supplier submits a bid for the lowest price that they are willing to sell for and once all bids have been submitted, Energinet.dk selects bids to purchase based on the type and amount of regulation needed2 starting from the lowest. Thus, bidders who are able to adjust their production/consumption most cheaply will be most likely to have their bids selected. The market price is set according to the same marginal principle described above in the wholesale market and
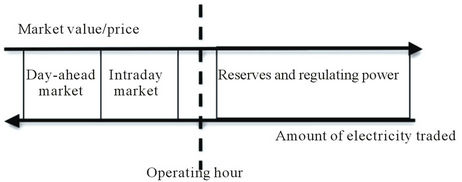
Figure 1. Danish electricity markets.
can be as high as EUR0.07/kWh [12].
The retail market in Denmark is also competitive, with consumers being able to choose their electricity supplier since 2003. Energinet.dk’s role in the retail market is to create and enforce rules, while ensuring that consumers are offered better products, prices or conditions [14]. Consumers in Denmark pay electricity bills on a quarterly basis at an average retail price of EUR0.12 per kWh [15]. The large difference between the retail prices that consumers face and the wholesale price on the Elspot market is accounted for primarily by government taxes, a subscription price and grid payments that cover transmission and distribution of electricity (see Figure 2). Both Energinet.dk and the major distribution companies in Denmark are involved with implementing new technologies that improve energy efficiency and peak load reduction.
The California Independent System Operator (CAISO) operates day-ahead wholesale and balancing power markets that are very similar to their counterparts in Denmark, utilizing a bidding process to establish electricity delivery schedules and prices. CAISO delivers approximately 200 billion kWh of electricity each year and is also responsible for maintaining stability and accessibility to the grid [16]. The primary difference between electricity markets in Denmark and California has to do with the structure of the retail market. Unlike Denmark, California regulates the price of electricity for each end-use consumer class (residential, commercial, industrial) and does not allow consumers to choose their electricity service provider. The California Public Utilities Commission (CPUC) carries out this regulation.
Within the framework of the state-regulated retail market, there are three basic types of electricity suppliers in California: Investor-owned utilities (IOUs), municipal distribution utilities and rural electric cooperatives. Of these, the vertically integrated IOUs are the only ones who have their rates regulated by the CPUC, because municipal utilities and rural cooperatives are seen as unlikely to charge unfair prices due to their public nature
[8]. The three largest IOUs in California (Pacific Gas and Electric, Southern California Edison, and San Diego Gas and Electric) serve over two-thirds of all electricity demand in the state [17].
Implementing energy efficiency in California involves all of the supply-side and regulatory actors previously mentioned in addition to end-use customers and installers. The CPUC, California Energy Commission, and each of the major IOUs have a variety of programs that address strategies such as energy conservation, demand response, and self-generation [17,18]. A key feature of California’s retail electricity market is that utility profits are decoupled from the amount of electricity sold. This policy creates an incentive for utilities to invest in energy efficiency programs that will reduce load and lower generation costs in the future. In order to guarantee a certain level of revenues, the CPUC works with the utilities to set revenue targets that will cover operating costs and provide a fair return to investors. Retail electricity prices are adjusted by the CPUC to meet these targets. Any additional revenue earned by utilities is returned to consumers, while shortfalls are to be recovered from consumers at a future time [19].
2. Methodology
In order to estimate the potential current and future value of TSR technology in Danish and Californian electricity markets, a model was constructed utilizing appropriate price and energy consumption data for each location. Multiple business models were analyzed to account for the potential expansion of smart grids and/or dynamic pricing (Table 1). The base case scenario analyzed involved introducing residential TSR refrigerators into current electricity markets without any form of dynamic pricing. Because current rate profiles are flat during the course of a day, the business model analyzed in this case was a 3rd party VPP that aggregates power from a large number of TSR refrigerators and sells it to utility companies as regulating power. In addition to the base case, calculations were made under the assumption that smart
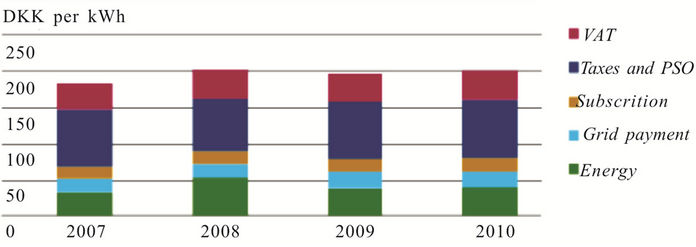
Figure 2. Decomposition of Danish electricity price (DERA’s electricity price statistics).
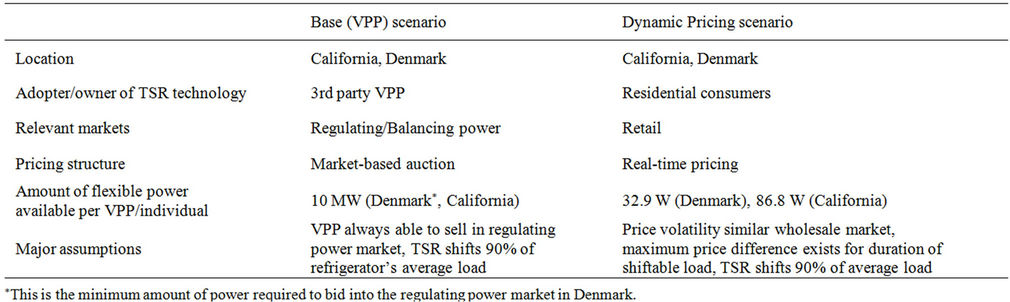
Table 1. Scenarios considered in this study.
grids with real-time pricing were introduced in both Denmark and California. Under this scenario, it is assumed that individual consumers would be purchasing TSR refrigerators as a way to take advantage of the dynamic pricing structure.
An important input to the models is an estimate of the resource base available. This includes how many refrigerators currently exist in each market, the average size and electricity consumption of a typical unit and the total amount of power that is consumed for residential refrigeration. Estimating new refrigerator sales is also useful for defining an addressable market [20-24]. A summary of the resource base available is summarized in Table 2.
In the VPP business model, it is assumed that the VPP recruits and pays consumers to participate in the demand response program. The VPP then remotely aggregates the power from all participating units and sells it in the regulating power (ancillary services) market. An additional requirement in Denmark is that the VPP must be able to supply at least 10 MW of power to bid into the regulating power market. Historical price data from NordPool and California ISO is used to calculate the expected revenues.
Initial prototypes suggest that a reasonable estimate for installing TSR technology in a refrigerator is $50 (~EUR37). Participation payments are a decision variable of the VPP and would be based on a combination of estimates of consumers’ reservation price for participating and expected revenues. In this analysis, three different levels of participation payments are considered in each location. Overhead costs of managing and operating the VPP would clearly be important, but are not considered here. On the revenue side, regulating power prices are typically in the range of EUR50/MWh in Denmark [25] and $40/MWh in California, meaning that a VPP could expect to earn EUR500 ($400) for every hour that it is able to provide 10 MW of regulating power. The advantage of the VPP in the regulating power market is that it has marginal costs of essentially zero, which would enable it to outbid traditional supply-side participants and thus have a very high likelihood of being selected by the TSO. For the purposes of this analysis, Table 3 summarizes these cost and revenue assumptions.
An additional business model explored in this study is one involving dynamic (real-time) pricing that could be implemented in conjunction with a smart grid. In this model, individual consumers pay the costs of purchasing the TSR technology and receive benefits in the form of lower energy expenditures. In this study, hypothetical minimum and maximum retail prices that would occur
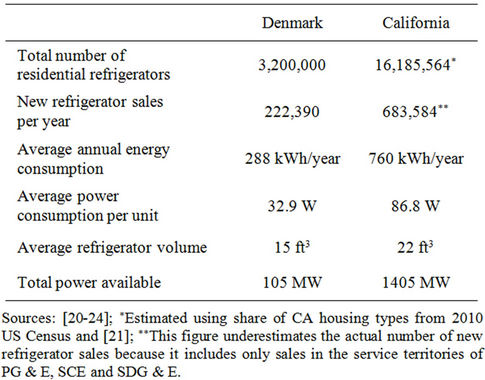
Table 2. Estimate of addressable residential refrigeration markets in Denmark and California.
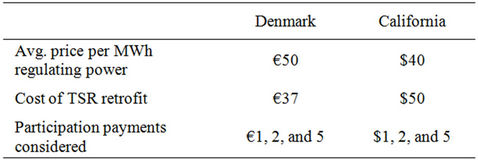
Table 3. Costs and Revenues associated with a VPP in Denmark and California.
during a day as a result of real-time pricing were constructed based on real price fluctuations currently existing in the wholesale market. To keep the model simple and provide a conservative estimate of the value of TSR technology, it is assumed that 90% of the average power draw of the refrigerator is able to be shifted from periods of time where the price is at a maximum to periods where the price is at a minimum. Thus, the estimates presented represent an upper bound on the amount that could be saved by using the TSR technology. Calculations are performed for available load shifting periods of 4, 6 and 8 hours.
The prices used to construct hypothetical real-time prices in the model are actual wholesale prices from August 2011 in Denmark and California [13,26]. August was chosen to represent a typical summer month for California and a non-holiday summer month for Denmark. To estimate what real-time prices may look like, a fixed markup is added to the hourly wholesale prices (see Table 4). This markup is calculated using the difference between average wholesale and retail prices in each location and represents fixed costs such as transmission fees and taxes that are added onto the marginal cost of producing electricity.
Retail prices were obtained from PG & E [27] and Eurostat [15]. Minimum prices occur during the early morning hours when demand is low and production from renewable sources with low marginal costs is often at a maximum (this is more important in the Danish market than in California due to the higher penetration of wind).
Maximum prices occur during the late afternoon/early evening hours as demand peaks and air conditioning use increases (air conditioning is essentially non-existent in Denmark due to the climate). Normal and extreme scenarios of price volatility are examined based on observed price fluctuations during August 2011. The Normal volatility scenario is meant to represent a typical day during a particular season, while the extreme volatility scenario assumes that the minimum and maximum prices observed during the season would occur every day. It is important to note that the prices used are based on variation in wholesale electricity prices and are meant to provide a preliminary analysis.
3. Results and Discussion
There are several observations that can be made from Table 2 regarding the characteristics and usage of refrigerators in Denmark and California that have an impact on the feasibility of incorporating TSR refrigerators into a VPP business model. Danish refrigerators are smaller, more efficient and far fewer in number than their Californian counterparts. Due to the 10 MW requirement for
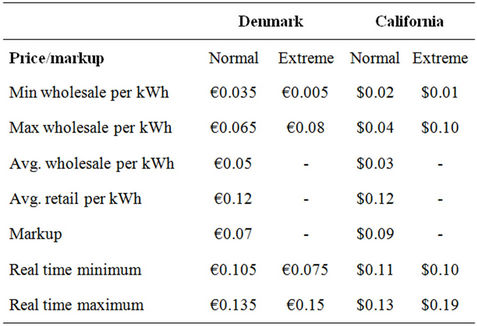
Table 4. Simulating a real-time pricing structure.
participating in the regulating power market in Denmark, a VPP consisting entirely of TSR refrigerators would require approximately 300,000 refrigerators in the country, which is about 10% of the total. In California, roughly 115,000 refrigerators would be needed (<1% of the total). Another way to assess the feasibility of the VPP business model is to calculate simple payback periods for the upfront costs that would be required to create a VPP. Table 5 shows some of these estimates for several cases in Denmark and California.
Clearly, A VPP made up entirely of TSR refrigerators in Denmark does not appear to be a profitable endeavor, even under the favorable assumptions that have been made in this study. The case in California is slightly more interesting, but it is unknown if $1 or $2 per month would be enough to incentivize consumers to participate in the VPP. Additional costs associated with recruitment advertising and installation costs would lengthen the payback period, but estimating by how much is outside the scope of this study. Payback periods were recalculated using lower retrofit costs as a sensitivity analysis. Cutting the retrofit cost in Denmark by 50% reduces the payback time to 10 years with a participation payment of EUR1/month, but does not change the infinite payback times for larger participation payments. In California, a 50% reduction in the retrofit cost has similar impacts and does not change the infinite payback time for a $5/month participation payment. The analysis conducted here assumed that the VPP would be entirely made up of TSR refrigerators. Because there are currently operating VPPs in California, introducing TSR refrigerators as part of a VPP is a valid scenario. The optimal portfolio for a VPP was not considered here, but is an interesting area for future work.
The dynamic pricing scenario considered involved real-time prices in a smart grid framework where individual consumers purchase TSR technology with the
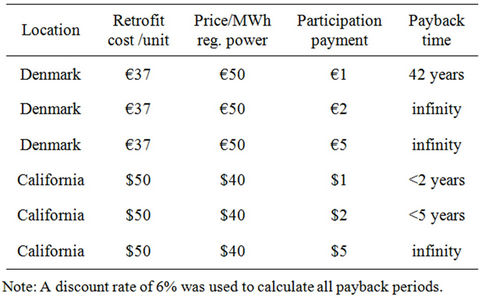
Table 5. Payback time for VPP in Denmark and California.
hope of recuperating their initial investment through load shifting. Tables 6 and 7 show the potential annual savings and payback times for purchasing a TSR refrigerator in Denmark and California with different amounts of flexible load time under normal and extreme price volatility scenarios. Payback periods were calculated with a discount rate of 6%. In both Denmark and California, the normal volatility scenario results in small annual savings that pay back the initial investment over very long periods of time. The situation in Denmark is slightly more favorable under the extreme volatility scenario, particularly as the amount of flexible load time increases. A main driver of the low savings and long payback periods in Denmark is the structure of taxes and other fees that make up a large part of the price of electricity. These fixed costs do not impact the amount of savings, but a more dynamic tax structure during the day could be used to amplify the price signal, which would result in a higher level of savings. Because taxes make up such a large fraction of the electricity price, changing the tax structure could have a large impact on smart appliances that would rely on real-time pricing to be commercially viable.
In California, the savings and payback periods under the extreme price volatility scenario are more interesting. These estimates do need to be taken as upper limits on potential savings, however, due to the fact that they are calculated using price variability in the summer months, which is likely to be much larger than price volatility in the winter months because of peak loads unique to the summer. Still, more renewable electricity and higher fossil fuel prices would be expected to increase price volatility in a real-time market towards the extreme scenario. Sensitivity analysis shows that reductions in the initial investment cost have a large impact on the payback time, while changes in the discount rate have very little effect.
4. Conclusions and Future Work
This study aimed at examining the role of demand re-
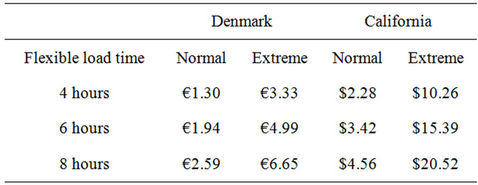
Table 6. Potential annual savings from residential TSR refrigerators.
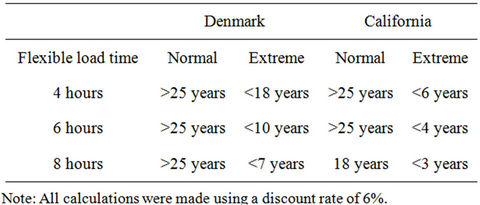
Table 7. Payback periods for residential TSR refrigerator with real-time prices.
sponse appliances in current and future electricity markets in Denmark and California using TSR technology as a case study. Combining technical data from prototypes developed at UC Davis with historical price data, commercial viability of TSR technology was analyzed in the context of a 3rd party VPP business model and a smart grid scenario that incorporated real-time pricing. The main goals of the study were to highlight features of electricity markets that are important for demand response technologies and calculate preliminary estimates of the potential value of TSR technology.
With the current state of refrigerators and electricity markets in Denmark, it does not appear that TSR technology would be commercially viable in either a VPP or a smart grid with real-time pricing. One primary reason for this outcome is the fact the typical Danish refrigerator is smaller and thus uses less power, which reduces the amount of power that is available for load shifting in a demand response application. Dynamic price signals in Denmark would also likely not be strong enough to create an incentive for individual consumers to invest in a TSR refrigerator. This study addressed only residential refrigerators due to the current state of TSR technology. Future work could include conducting a similar analysis for commercial and/or industrial refrigerators, which may be more promising because of the larger amount of energy consumed in those applications.
Results in California suggest that TSR technology may have value as part of a VPP or as an appliance in a smart grid with a high degree of price variability. Although the analysis conducted here was in the framework of a VPP made up entirely of TSR refrigerators, the estimates are also relevant for situations where refrigerators would be added to an existing VPP. Estimates of payback periods in the smart grid/dynamic-pricing scenario suggest that investments in TSR technology would pay off in 5 - 10 years with a high degree of price volatility. As in the Danish case, commercial/industrial applications of TSR technology are potentially interesting due to the larger amounts of power per unit that is available for shifting. Future work in this area would involve adapting the current TSR prototype to industrial/commercial refrigerators and conducting a similar analysis of its market potential in California.
5. Acknowledgements
The authors would like to thank Dr. Morten Blarke and Dr. Arne Remen from Aalborg University, Denmark for their guidance during this research. We would also like to acknowledge The UC Berkeley Energy Institute (UCEI), the Danish Ministry, and The Nevada Institute of Renewable Energy Commercialization (NIREC) for their support for this study.
REFERENCES
- IDA, “The IDA Climate Plan 2050,” The Danish Society of Engineers, Copenhagen, 2009.
- A. Schwarzenegger, “Executive Order S-14-08,” California, 2008.
- California, “Assembly Bill No. 32,” CARB, 2006.
- EnerNOC, “EnerNOC Provides Key Demand Response Resources to Southern California Edison,” EnerNOC, Inc., 2009.
- J. Garthwaite, “Obama Signs the Stimulus: What’s in Store for Clean Energy,” Gigaom, 2009.
- D. Wight, “Assessment of Demand Response and Advanced Metering,” Federal Energy Regulatory Commission, Washington DC, 2010.
- D. J. Hammerstrom, “Pacific Northwest GridWise Testbed Demonstration Projects: Part I. Olympic Peninsula Project,” Pacific Northwest National Laboratory, Redmond, 2007.
- P. Fox-Penner, “Smart Power: Climate Change, the Smart Grid, and the Future of Electric Utilities,” Island Press, Washington DC, 2010.
- Ecogrid, “Ecogrid EU: A Prototype for European Smart Grids in Brief,” 2011.
- Danskenergi and Energinet.dk, “Smart Grid in Denmark,” 2010.
- W. M. Warwick, “A Primer on Electric Utilities, Deregulation, and Restructuring of US Electricity Markets,” US Department of Energy, Washington DC, 2002. doi:10.2172/15001013
- Energinet.dk, “Electricity,” 2011. http://www.energinet.dk/EN/EL/Sider/default.aspx
- NordPool, “Elspot Prices,” 2011. http://www.nordpoolspot.com/Market-data1/Elspot/Area-Prices/ALL1/
- Energinet.dk, “Regulation C2: The Balancing Market and Balance Settlement,” 2008.
- Eurostat, “Electricity Prices for Household Customers,” 2011. http://epp.eurostat.ec.europa.eu/tgm/table.do?tab=table&init=1&language=en&pcode=ten00115&plugin=1
- CAISO, “Market and Operations,” 2011. http://www.caiso.com/market/Pages/MarketProcesses.aspx
- CPUC, “Electricity and Natural Gas Regulation in California,” 2011. http://www.cpuc.ca.gov/PUC/energy/
- ETCC, “Emerging Technologies Coordinating Council,” 2011. http://www.etcc-ca.com/
- CPUC, “California’s Decoupling Policy,” CPU Commission, Sacramento, 2007.
- FEHA, “Market Data,” 2011. http://www.feha.dk/default.asp?mainmenu=3
- KEMA, “2009 California Residential Appliance Saturation Study,” California Energy Commission, 2010.
- XEnergy, “Phase 4 Market Effects Study of California Residential Lighting and Appliance Program,” San Diego Gas and Electric Company, 2002.
- O. Sidler, B. Lebot and L. Pagliano, “Electricity Demand in European Households: Major Findings from an Extensive End-Use Metering Project in Four Individual Countries,” American Council for Energy-Efficient Economy, 2002.
- UBM, “Appliance Industry: Review and Outlook Europe,” Appliance Market Research Report, 2011.
- Energinet.dk, “Download of Market Data,” 2011.
- CAISO, “CAISO Daily Report,” Federal Energy Regulatory Commission, 2011.
- PG & E, “Electric Rates,” 2011. http://www.pge.com/nots/rates/tariffs/electric.shtml#RESELEC
NOTES
1Electricity suppliers can also negotiate contracts to buy electricity directly from a producer, which are known as power purchase agreements.
2“Up” regulation refers to periods of time where electricity demand is greater than the scheduled supply and more power must be brought online (the frequency in the grid must be brought up). “Down” regulation refers to the opposite situation where either demand must be increased or supply taken offline.