International Journal of Geosciences
Vol.5 No.3(2014), Article ID:44233,17 pages DOI:10.4236/ijg.2014.53032
Geophysical Evaluation for Evidence of Recharging the Pleistocene Aquifer at El-Nubariya Area, West Nile Delta, Egypt
Ahmed Khalil1, Khamis Mansour1, Taha Rabeh1, Alhussein Basheer1, Mohamed Abdel Zaher1, Kamal Ali2
1National Research Institute of Astronomy and Geophysics, Helwan, Egypt
2Research Institute for Groundwater, National Water Research Center, Cairo, Egypt
Email: kham123@hotmail.com
Copyright © 2014 by authors and Scientific Research Publishing Inc.
This work is licensed under the Creative Commons Attribution International License (CC BY).
http://creativecommons.org/licenses/by/4.0/


Received 9 January 2014; revised 5 February 2014; accepted 1 March 2014
ABSTRACT
With ever increasing demands on water resources, Egypt is facing increasing water needs, demanded by a rapidly growing population, by higher standards of living and by an agricultural policys. West Nile Delta represents a new agricultural area where the reclaimed lands are irrigated with groundwater in addition to surface water. The evaluation of groundwater aquifers in West Nile Delta area requires information about the extension, depth and distribution and source of recharging these aquifers. In this work, an integrated study using geoelectric, geomagnetic, hydrogeologic and hydrochemistry investigations has been applied to evaluate groundwater aquifers and to delineate subsurface structures predominant in the basement rocks at El-Nubariya area, West Nile Delta, Egypt. Thirty-five Vertical Electrical Soundings (VES) have been applied to identify the subsurface geoelctric layers predominant in the study area. As well as a detailed land magnetic survey has been carried out along the study area using two automatic proton precession magnetometers with an accuracy of 1 nT. These surveys allowed us to establish the subsurface structures and their relation with the detected aquifers. The geoelectric results are illustrated along seven geoelectric profiles and correlated with the lithologic and hydrogeologic data of drilled wells. The third geoelectric layer represents the water saturated zone (aquifer) with thickness varies from 14 m to 58 m, increasing to east and southeast directions. The hydrchemisty anlysis shows that the salinity of the water aquifer ranges from 600 ppm in the southeast to 3900 ppm in the south. The major dominant dissolved salt is Nacl. In the east and southeast, the water type becomes more NaSO4 which refers to dissolution of gypsum in addition to fertilizers. The magnetic data have been analyzed using horizontal gradient and 3D magnetic modeling along the locations of geolectric profiles. The results indicate that the fault structures are trending in E-W, NW-SE and NE-SW directions. These faults confirm the results obtained from the well geolectric interpretation. These fault structures act as recharging paths from lower brackish to upper fresh water aquifers.
Keywords:Geoelectric; Geomagnetic; Aquifer; Groundwater; Hydrogeology

1. Introduction
The increase of development has been overspreading many places in Egypt. So, great attention has been paid to the establishment of new settlements, land reclamation projects and preservation of the cultivated land. For these purposes, favorable efforts have been given in several integrated fields of study. Egypt depends only on the River Nile as a main source of water, which has proven itself to be inadequate alone. Therefore, groundwater has become Egypt’s second source of water, especially in faraway areas of Delta and Nile Valley; one of these areas is West Nile Delta. It is a huge area and a lot of irrigation and reclamation processes are done there depending on groundwater.
The Nile Delta and its fringes were the subject of comprehensive studies for a long time. These studies concern geology, hydrogeology, hydrochemistry and geophysical investigation. The geomorphology and geology of the west of Nile Delta have been studied by many authors [1] and [2] . The hydrogeological studies were considered in this work by Shata and EL Fayoumy [2] . The hydrochemical studies on Nile Delta were done by many researchers, like Atta [3] and Diab [4] . This type of research is related to the pollution in the Nile Delta. The available water resources include surface water (Rosetta branch and its irrigation channels) and relatively shallow groundwater that is mainly recharged from the surface water. Groundwater is the main source for domestic, industrial and agriculture use in the western Nile Delta region [5] .
It is known that the resistivity method is used for detecting groundwater presence and differentiating subsurface layers. As well as, the magnetic method is considered as an important tool to detect the upper surface of the basement and, indirectly, the thickness of the sedimentary cover.
The present research aims to evaluate the groundwater aquifers in the west of the Nile Delta. This goal will be achieved by using Vertical Electrical Sounding technique (VES), ground magnetic data, in addition to the integration between geoelectric results and hydrochemical analyses.
The area under investigation is located in the west of the Nile Delta between longitudes 29˚50'00''E, 30˚20'00''E and latitudes 30˚30'00''N, 31˚00'00''N (Figure 1). It represents part of new reclaimed land in Beheira governorate. The area is considered low to flat land and the ground elevation does not exceed 30 m above sea level. In the north, the ground surface is below the sea level at Abu EL Matamir and Hush Isa.
A detailed geoelectric resistivity survey using Vertical Electrical Sounding (VES) was performed at thirtyfive soundings in the form of profiles covering the study area. This investigation has been followed by a detailed land magnetic survey using two proton precession magnetometers in a mesh-like network. In addition to these surveys, more than 20 drilled wells distributed over the study area were used to confirm the results from the geoelectric and geomagnetic investigations.
2. Geomorphology and Geology
The northwest of the Nile Delta has been subdivided geomorphologically into four geomorphologic units; (Figure 2) In the study area, we will provide detailed description about only two geomorphological units; these are: Tablelands and Alluvial plains.
2.1. Tablelands
The tablelands extend towards the southwest of the coastal plains. The surface of the tablelands is covered by sandying limestone and appear in the western and southern sides of the area of study. Three main land forms have been distinguished on the tablelands, which are Ridges, Depressions and Erg plain.
2.2. Alluvial Plains
The Alluvial plains are differentiated into young alluvial plain and old Alluvial plain. These can be illustrated as follow:
1) The young Alluvial plain It lies between Abu Mina Depression in the west and Rosette branch of the Nile in the east. The surface is covered with clay beds alternated with a thin band of silt, where it represents a portion of the old cultivated land of the northwest of the Nile Delta.
2) The old Alluvial plain It lies in the south of the young Alluvial plain and occupies the northern and eastern areas of Wadi El Natrun. This plain slopes regionally to the north and northeast; it varies in elevation between 20 m and 60 m. Its surface is covered with sandy deposits in the northern part, whereas gravelly deposits dominate in the southern part.
3. Geological Conditions
The exposed formations in West Nile Delta are dominated by a sedimentary succession ranging from Lat Cretaceous to Quaternary. The Pleistocene deposit is 1000 m thickness. It is mainly distributed west of Rosetta branch and east of Wadi El Natrun. Gabel El Basur Formation of Pleistocene age is a young Pleistocene terrace covered by sands and gravels. This formation represents the floor plain of Nile Delta during the earliest Pleistocene. During Pleistocene to Holocene period, different erosion processes produced different types of deposits; which are as follows:
Alluvial deposits derived from Miocenerocks: These deposits are composed of almost homogeneous calcareous loam, sometimes associated with concretionary gypsum. Most of these deposits have reddish color and occur in Wadi El Farigh south of Wadi El Natrun.

Figure 1. Location map of the study area showing VES stations and drilled wells displayed along geoelectric profiles.

Figure 2. Geomorphologic map of west Nile Delta.
Alluvial deposits derived from Pliocene rocks: The well-developed thickness of these deposits is about 2 m. They occur northeast of Wadi El Natrun Depression and extend in northwest direction. They are characterized by light gray and very fine texture. They are composed of reddish sand, silt, and gravel.
Sand dunes: The thickness of these deposits range from 10 m to 30 m. Sand dunes belts, with certain direction to become mostly NNW-SSE, are present southern Wadi El Natrun, where only their northern tips could be traced in the area.
Deltaic deposits: The thickness of these deposits reaches about 300 m in the Nile Delta; areas covered by inland and deltaic deposits exist. These deposits vary from gravels and sands to silt.
Marshes and Sabkhas: The thickness of these deposits reaches 18 m and they are observed in Wadi El Natrun Depression.
Lakes and water ponds: There are about 17 lakes and water ponds in the West Delta. Their areas vary between 0.075 square kilometers to 2.080 square kilometers. Total area of natural lakes is about 9.87 square kilometers [6] .
4. Data Acquisition and Interpretation
This work has been performed in four stages that included geoelectric, ground magnetic surveys, the drilling and logging of boreholes and hydrology and hydrochemistry. A description of each method is given below.
4.1. Geoelectrical Investigation
The geoelectrical resistivity field survey is carried out in the present research in order to outline the thickness and geoelectrical resistivities of the encountered geoelectrical units. The field survey comprises measuring of the resistivity values through thirty five Vertical Electrical Sounding (VES) covering almost the whole area of study. It is arranged more or less in grid pattern along profiles directed N-S and E-W according to simple terrain of the area as in (Figure 1).
The computer program uses field-measured datasets of apparent resistivity and electrode spacing to generate a vertical assemblage of iso-resistivity units. This inverse modelcan be displayed and interpreted in a form of geoelectric layers.
The geologic information regarded to the lithologic succession in the study area are obtained from previous geology studies and drilled wells. The general lithologic succession in the study area can be listed, from top to bottom, as follow:
1) Recent deposits, silt deposits of the Nile Delta.
2) Pleistocene sub-recent lacustrine deposits.
3) Pleistocene Nilotic sands.
The above mentioned lithologic information are used for caliberation of the geoelectric results using wells located along the measured profiles in addition to some wells located close to measured VES stations. The thicknesses and true resistivity values are used for construction seven N-S and E-W geoelectric cross section.
In this study, we are going to present only three geoelectric profiles, A-A’, B-B’ and D-D’.
4.1.1. Geoelectric Section A-A’
The geoelectric profile A-A’ consists of seven VESes and extends for 28 Km (Figure 3). The results of interpretation is correlated and calibrated with drilled well located close to VES4. The maximum true resistivity value is recorded at surface layers due to its dryness and it comprises a combination of silt and sand. The interpretation of the VESes indicates that the area of study is divided into four geoelectric unites as the follow:
1) The first geoelectric unit “surface layer” is composed of dry silt and sand that show high resistivity values ranging from 28 to 80 Ohm·m and thickness varies from 1 to 6 m.
2) The second geoelectric unit is a clay cap that characterized by resistivity values ranging from 8 to 9.5 Ohm·m and thickness varies from 2 to 6.5 m.
3) The third geoelectic unit is the water saturated sand and considered as semi confined to confined aquifer where it is characterized by resistivity values 23 to 25 Ohm·m. This unit has a considerable thickness varies from 13 to 59 m.
4) The fourth geoelectric unit is clayey sand mainly and constitutes the base of aquifer.
To the western side of the profile, it is noticed an abrupt change in the thickness and depth of the geoelectric

Figure 3. Geoelectric cross-section illustrating the rock succession and the resistivity values along profile A-A’.
layers which could indicates a fault affected the area.
4.1.2. Geoelectric Section B-B’
The geoelectric section B-B’ is constructed using the interpretation results of VESes 8-14 in the west-east directions (Figure 4). This section is characterized by the presence of four geoelectric layers:
The first geoelectric layer represents the surface layer that is characterized by a wide range of resistivity ranging from 4 Ohm.m to 95 Ohm·m. Its thickness decreases to the west direction. it is composed mainly of silt and sand as correlated with the well w2 near VES 11.
The second geoelectric layer represents the clay cap layer which characterized by low resistivity values ranging from 8 Ohm·m to 15 Ohm·m. Its thickness increases to the west to reach 2.9 m.
The third geoelectric layer represents the water saturated sand (aquifer). It is characterized by middle resistivity values ranging from 11 Ohm·m to 35 Ohm·m, and its thickness decreases to the west and varies from 17 meters to 52.6 meters. This unit represents the water-bearing formation in the study area where most of drilled production wells extract groundwater from this zone.
The fourth geoelectric layer represents the base of aquifer. It is characterized by very low resistivity values ranging from 4.8 Ohm·m to 6 Ohm·m. A Fault (F1) is suggested between VESes 9 and 10 due to the abrupt change in the thickness and depths to the geoelectric layers.
4.1.3. Geoelectric Section D-D’
Figure 5 shows the geoelectric section D-D’ that constructed from VESes 21-25 respectively with length of about 19.5 Km. It consists of four geoelectric layers.
The first geoelectric layer represents the surface layer with resistivity values ranging from 45.5 Ohm·m to 100 Ohm·m and thickness varies from 1.5 meters to 5 meters. The thickness decreases to the East direction and reaches its maximum resistivity value at VES 22.
The second geoelectric layer is characterized by low resistivity. This layer represents the clay bed as correlated from well w4 with nearly constant thickness except at VES 22.
The third geoelectric layer represents the water saturated sand (water bearing zone) which has moderate resistivity values ranging from 20.5 Ohm·m to 29 Ohm·m, and thickness vary between 31 meters and 56 meters. The

Figure 4. Geoelectric cross-section illustrating the rock succession and the resistivity values along profile B-B’.
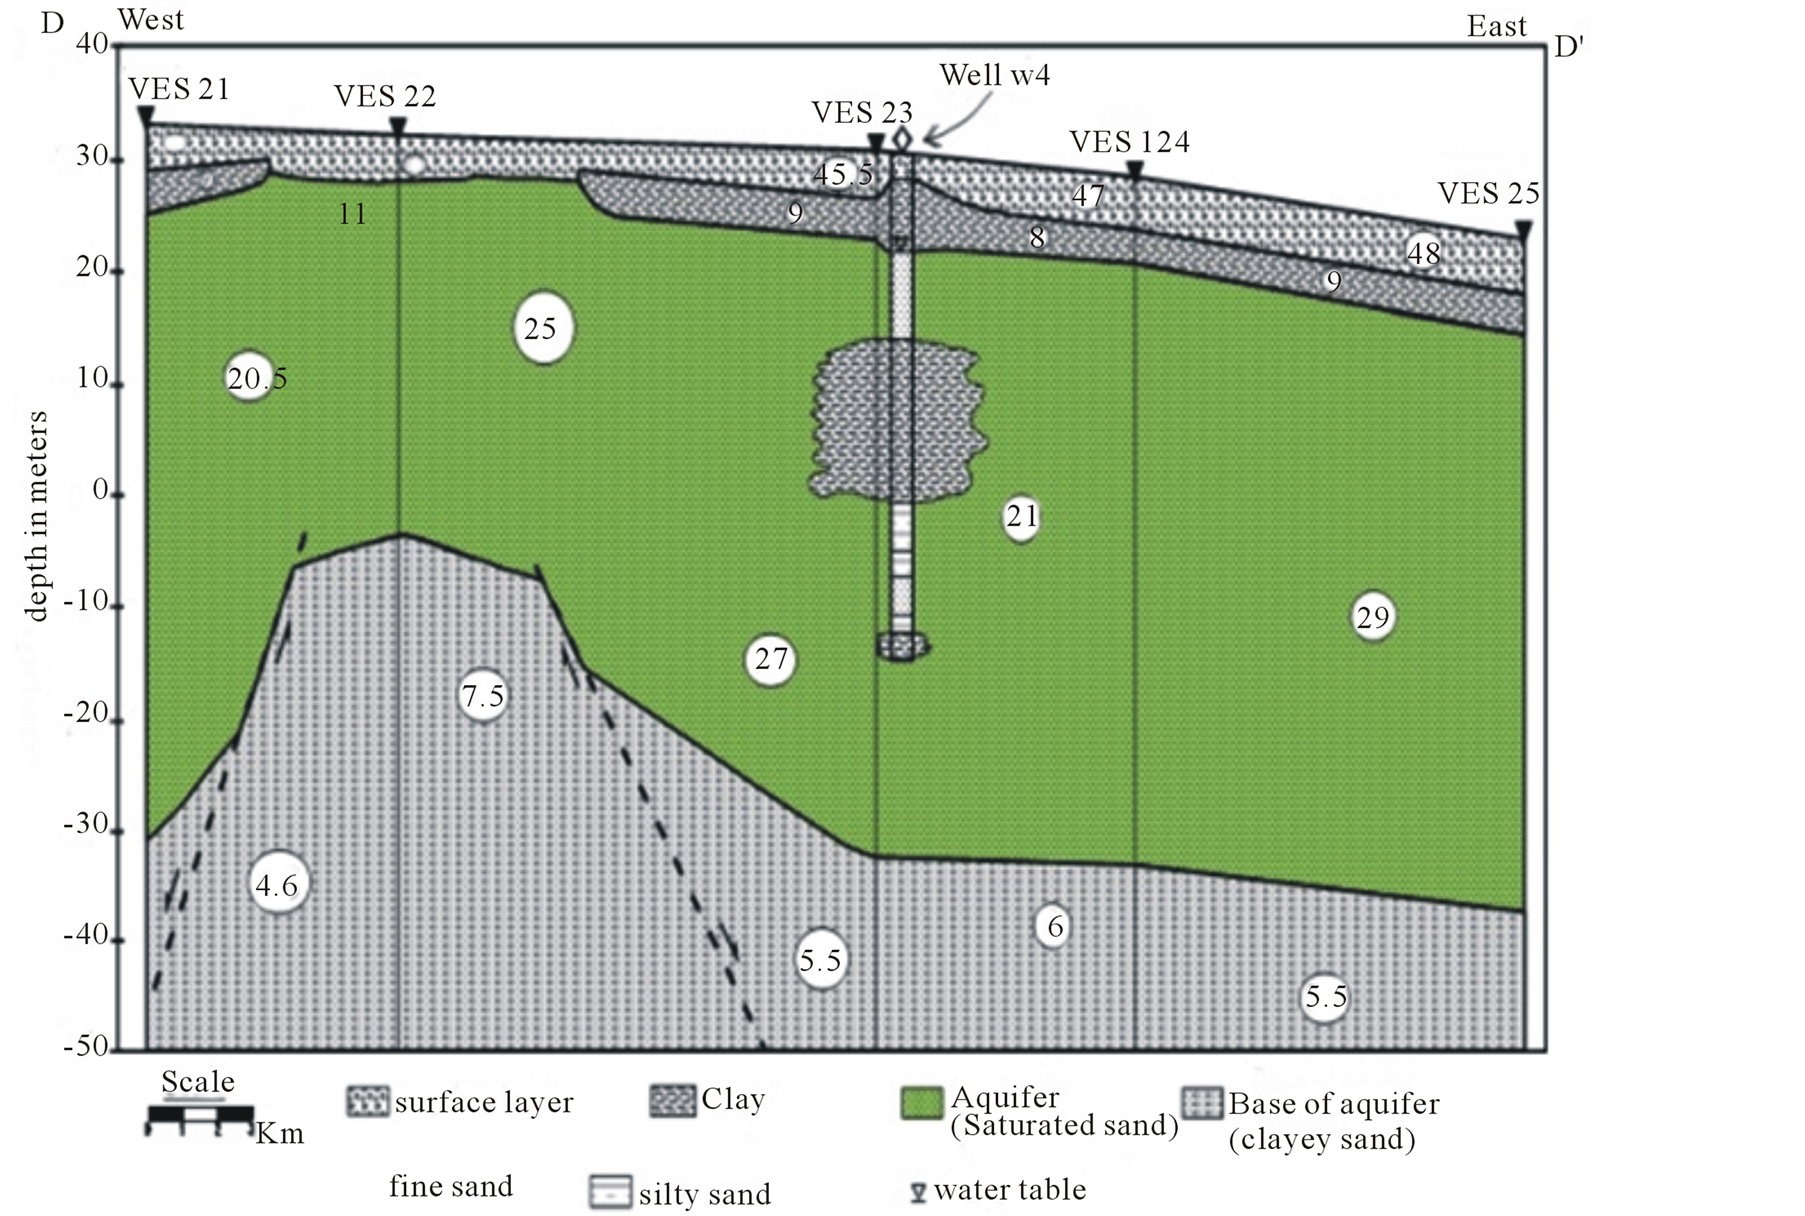
Figure 5. Geoelectric cross-section illustrating the rock succession and the resistivity values along profile D-D’.
minimum thickness is recorded at VES 22 due to the presence of two faults.
The fourth geoelectric layer has very low resistivity representing the base of the aquifer. It has resistivity values ranging from 4.6 Ohm·m to 7.5 Ohm·m. Generally, well w4 which located near VES 23 provided the interpreter about the subsurface lithologic succession.
4.2. The General Conclusion from Geoelectric Cross-Section
The careful study of the seven geoelctric sections can lead to.
4.2.1. The Second Geoelectric Layer
It represents the low resistivity layer, where its resistivity values range between 6 Ohm·m to 17 Ohm·m; (Figure 6). The thickness of this layer ranges between 2 m. in the East to 8 m. in the western part of the study area; (isopach map, Figure 7). This layer consists mainly of clay, and in some localities contains sand with clay deposits.
This geoelectric layer acts as impervious layer. It has disadvantage, the surface contaminated water is accumulated that saturating the overlying layers, and then water logging take place in some localities in West Nile Delta.
4.2.2. The Third Geoelectric Layer
It represents the main aquifer in the study area. It consists of saturated sand deposits with some intercalations of clay and silt. It appears with nearly homogenous resistivity and thickness where the resistivity values vary between 11 Ohm·m to 39 Ohm·m (Figure 8). The thickness of this layer ranges between 10 meters to 60 meters (Figure 9). This thickness decreases in the north-west direction due to the decrease of the Pleistocene sediments thickness of Nile deposits.
Most of the drilled wells in the area of study take in consideration that this layer acts as target for good water bearing production.

Figure 6. True resistivity contour map of the second geoelectric unit.
4.3. Geomagnetic Measurements and Interpretation
Magnetic data have been used to delineate the subsurface fault trends/structures responsible for recharging the aquifers in the study area. An extensive land magnetic survey has been carried out for the total component of geomagnetic field. The survey started as a mesh like form covering the areas of the selected sites. Two proton magnetometers (Geometrics G-856) were used: one as a fixed base station inside the study area, while the other was used to measure the intensity of the magnetic field along the study area.
The locations of the measurement stations were determined using a global positioning system (GPS) with an accuracy of about1m. Measured data were corrected for diurnal and latitudinal variations. A constant value of 42,600 nT was subtracted from the measurements, to obtain a description of the total field magnetic anomalies. Because of the declination and inclination angles of the magnetic vector, there is a shift in the location of a magnetic anomaly of the subsurface source on the map and its true location. Therefore, the reduction-to-the-pole (RTP) technique of Mendonca and Silva [7] was applied to the total magnetic intensity map.
4.3.1. Reduction to the Pole
The first step in data processing was reduction to the pole (RTP). This procedure has the advantage of compensating for the shift between sources and magnetic anomalies due to the non-verticality of both the normal field and the magnetization. Only induced magnetization was considered. Inclination and declination of the normal field were fixed at 42.9 N and 2.5 E. RTP was conducted in the Fourier domain. The results are presented in (Figure 10).
The RTP land magnetic map (Figure 10) indicates that most of the anomalies trend in the NW-SE, and E-W directions. One can also verify the presences of the positive magnetic anomaly at the southeastern part of the

Figure 7. Isopach map of the second geoelectric unit.
study area indicating the shallow depths to the basement rocks or rocks containing high magnetic minerals. The negative magnetic anomaly in the western part are perhaps due to the presence of rocks that are either relatively deep or of low magnetism. The horizontal gradient method was applied to the RTP land magnetic map to delineate the subsurface fault trends based on the theory of Grant & West [8] and on the Linsser technique [9] , the first horizontal gradient method was applied to all RTP magnetic maps. The peaks of the gradient curve were plotted along profiles covering these maps, and then connected together to show the deduced structure lines.
The results indicate that the fault structures are trending in E-W, NW-SE and NE-SW directions. These faults confirm the results obtained from the well geolectric interpretation.
4.3.2. 3D Magnetic Modeling
Algorithms applicable to polyhedral of very general shape were given by many authors starting in early 1960s [10] [11] . Shuey and Pasqual [12] introduced a 2.5 dimension algorithm by applying the end corrections to the infinite extent model. Grant and West [8] considered the magnetic field A at any external point r due to a volume v of rock which is magnetized with a dipole moment per unit volume M is:
 (1)
(1)
where:  is a volume integration over the body, r is the distance restricted to xz plane and r0 is the distance from point A to the centre of the magnetic body.
The 3D equation can be expressed by:
 (2)
(2)

Figure 8. True resistivity contour map of the third geoelectric unit.
where U is the Newtonian potential By controlling certain parameters such as an extent, magnetic susceptibility, declination, inclination and x-z coordinates, a potential field for each causative body can be calculated. Finally, the total potential field of all bodies, with their constituent parameters is summed up iteratively adjusted to fit the observed data.
Based on Grant and West [8] and Talwani [10] theories, the 3D modeling technique was applied to the magnetic data using Encom Model Vision Pro [13] software. The technique was applied to a set of magnetic profiles used for geoelectric survey. The 3D inversion model allows us to deal with layered structures as well as isolated bodies such as igneous intrusions. Also, the peaks along the horizontal gradient curve show the location of the deduced faults. The magnetic susceptibility within the layers may vary both vertically and horizontally. The RTP land magnetic data along the profiles were digitized into software with respect to their coordinates.
The results show that there is a significant correlation between the structures deduced from the land magnetic interpretation and geoelectric cross-sections along profiles A-A’ and D-D’ interpretation obtained from composite well logs, RTP magnetic profiles and horizontal gradient curves (Figures 11 and 12). The deduced faults from the land magnetic data indicated their deeper origin which gives an idea about the possibility of recharging the Pleistocene aquifer from the deeper depths aquifers (e.g. Pliocene aquifers) which characterized by its high salinity. This is explaining the changing in the salinity during the discharging process from the Pleistocene aquifers. The magnetic susceptibility ranges from 0.00002 SI to 0.00009 SI units from the sedimentary rocks and from 0.0001 SI to 0.004 SI units. The depth to the basement rock range from about 3 km at the east to more than 5 km towards the west.

Figure 9. Isopach map of the third geoelectric unit.

Figure 10. Total intensity magnetic map reduced to the pole.

Figure 11. (a) Geoelctric cross section along the profile A-A’. (b) Application of 3D modeling technique along the profile A-A’ of the RTP magnetic map shows the deduced subsurface layers and their magnetic susceptibility in SI unit.
5. Hydrogeologic Condition and Hydrochemistry
5.1. Hydrogeologic Condition
Irrigation in the area of study depends mainly on the surface water diverted from Nile water through main canals and their secondary channels. The surface drainage system plays an important role in the water regime of the area of study. The existing surface water systems mainly cut through sands and, therefore, a direct connection between the surface water and groundwater can be expected.
5.1.1. Groundwater System
The groundwater conditions in the area of study are greatly affected by lithological nature of aquifers, structural features especially faulting as well as the drainage pattern. According to stratigraphic sequence of water bearing formations with other geological and hydrological conditions of the area of study, groundwater aquifers can be classified into:
1) Nile Delta aquifer (Quaternary aquifer)

Figure 12. (a) Geoelctric cross section along the profile D-D’. (b) Application of 3D modeling technique along the profile D-D’ of the RTP magnetic map shows the deduced subsurface layers and their magnetic susceptibility in SI unit.
a) Recent aquifer; b) Pleistocene aquifer.
2) Pliocene aquifer We will through the light on the characteristic parameters of the Pleistocene aquifer (the main aquifer of the study area).
5.1.2. Pleistocene Aquifer
The Pleistocene aquifer is the main water bearing formation, occupying most parts of the area of study. It is highly productive aquifer [14] . This aquifer is made up of successive layers of sand and gravels with occurrence of clay lenses of fluviatile origin. The groundwater exists mainly under free water table conditions (unconfined to semi-confined) .The depth of water varies from a few meters close to the Delta to about 30 meters near Wadi El Natrun. The main source of recharge is the groundwater basin underlying the Nile Delta, which is built of the same Pleistocene Formation and hydraulically connected with Pleistocene aquifer in West Nile Delta. Another source is seepage water from adjacent canals and infiltration from excess irrigation water. Water table, derived from drilled wells, increases from southward and southeast to northward direction. The water table is about 4 meters at well W3 and it reaches a maximum of 15 meters at wells W9, W12, W10 (Figure 13).
5.2. Hydrochemistry
Twelve collected samples were analyzed in the area of study. They represent the Pleistocene aquifer. The distribution of Pleistocene aquifer salinity in the area ranges from 600 ppm in the southern east and east parts of the area to 3900 ppm in the south. Generally, the salinity decreases to the east due to continuous recharging from the Rosette branch and drainage system in the area. The distribution of EC (Electrical conductivity) ranges from 0.95 mmoh/cm in sample of well (W12) to 5.98 mmoh/cm in sample of well (W10).
5.2.1. Piper Diagram
By study the result of Piper diagram we can deduce that the groundwater in the area is mainly of Nacl-type in the most of the area however board zone of Na mix water is present. This water is not predominant anion due to the maxing of groundwater with infiltrated fresh water from the main irrigation canals and excess irrigation water. In the East and south-east of the area, the water type becomes NaSO4 -type which refers to dissolution of gypsum and in addition to use of it as fertilizer in some areas where the soil has alkaline type (Figure 14).

Figure 13. Water table contour map from mean sea level of the Pleistocene aquifer.

Figure 14. Distribution of water types in the area.
5.2.2. Groundwater Evaluation
1) Groundwater Evaluation for Domestic Use
The groundwater in the area mainly of Brackish type and it is not suitable for drinking purpose where the TDS in the area is more than 1000 ppm as in wells W1 (2972 ppm) and W10 (3957 ppm) while in wells W11 and W12 is equals to 801 and 723 respectively.
2) Groundwater Evaluation for Irrigation Purposes
According to the U.S. Department of Agriculture, however, the relative activity of sodium ions in exchange reactions with soil is a much better measure of the suitability of water for irrigation. When the sodium-adsorption ratio and the electrical conductivity of water are known, the suitability of the water for irrigation can be determined by plotting these values on the diagram (Figure 15).
Form U.S. Salinity Laboratory Staff [15] diagram we noticed that the suitability of water for irrigation has been classified into five classes, which are:
a) C3-S1 The groundwater of this class is characterized by medium to high salinity and low Sodium hazard. It is suitable for planets having moderate salt tolerance, on soil of moderate permeability with leaching. This class includes water samples of well W12 in the area of study.
b) C4-S1 This class is characterized by high to very high salinity and low Sodium hazard. This class is only in sample of well W11.

Figure 15. Diagram for water samples in the area of study (after U.S. Salinity Laboratory Staff).
c) C4-S2 Well W7 is included in this class which characterized by very high salinity water and medium Sodium hazard. It is not suitable for irrigation under ordinary conditions but may be used occasionally under very special circumstances (after U.S salinity Laboratory 1954).
d) C4-S3 Suitability of water for irrigation in this class is noticed in sample of wells W8 and W9. They have very high salinity and high Sodium hazard. Water may produce harmful levels of exchangeable Sodium in most soils and will require special soil management, good drainage, high leaching and organic matter additions.
e) C4-S4 This class is characterized by very high salinity and Sodium hazard. It includes five wells (W1, W2, W3, W5 and W6) where they represent the major water samples in the area of study.
6. Discussions and Conclusions
Our study was carried out to detect the water aquifers and the subsurface structures controlling the water supply and recharging to these aquifers. Both geological and geophysical techniques were used: 1) borehole excavation logs/wells enabled us to determine the geologic sequences and the depth to the water aquifer (Nubian sandstone); 2) geoelectric (VES) surveys allowed us to determine the exact aquifer carrier member and its extension along the study area; and 3) land magnetic surveys were used to determine the depth to the basement rocks and the subsurface structures affecting the stud area. This magnetic study confirmed the results obtained from the well logging and geoelectric surveys.
The study area is characterized by the presence of two water-bearing zones which are:
6.1. Primary Aquifer
It is largely distributed in the area forming the main water bearing formation of the study area.
6.2. Secondary Aquifer
It is distributed in all the area, too, but with water quality less than the primary aquifer.
1) The groundwater in the area is mainly of Nacl-type, however, a board zone of Na mix water is present due to maxing of groundwater with infiltrated fresh water from the main irrigation canals while in the East and south-east of the area the water type becomes NaSO4 which refers to dissolution of gypsum in addition to usage of fertilizers in some areas due to alkaline nature of soil there.
2) The groundwater in the area is a brackish type and it is not suitable for drinking purpose where the TDS is more than 1000 ppm.
3) According to U.S. Salinity Laboratory Staff, 1954, most of samples are in fifth class type which is characterized by very high salinity and Sodium hazard.
The results obtained from the RTP map indicate that the fault structures are trending in E-W, NW-SE and NESW directions. These faults confirm the results obtained from the well geolectric interpretation. Also, the deduced faults from the land magnetic data indicated their deeper origin which gives an idea about the possibility of recharging the Pleistocene aquifer from the deeper depths’ aquifers (e.g. Pliocene aquifers) which was characterized by its high salinity. The geomagnetic results indicate that there is a good correlation between geologic cross sections along profiles A-A’ and D-D’ obtained from composite well logs, RTP magnetic profiles, and horizontal gradient curves as it appears in the figures.
References
- Said, R. (1990) The Geology of Egypt. Elsevier Publ. Co., Amsterdam.
- Shata, A. and El Fayoumy, I.F. (1970) Remarks on the Regional Geological Structure of Nile Delta. Proceeding of the Bucharest Symposium on Hydrogeology of Deltas, 1, 189-197.
- Atta, S.A. (1979) Studies on the Groundwater Properties of the Nile Delta, Egypt. M.Sc., Faculty of Science, Cairo University, Cairo.
- Diab, M.Sh. (1982) Groundwater Pollution in the Quaternary Aquifer under the Nile Delta, Egypt. Journal of Geophysics, Special Volume, 135-144.
- Dawoud, M.A., Darwish, M.M. and EL-Kady, M.M. (2005) GIS-Based Groundwater Management Model for Western Nile Delta. Water Resources Management, 19, 585-604. http://dx.doi.org/10.1007/s11269-005-5603-z
- Ezzat, M.A., Nour, S., Shaker, R., Misbriki, M.F., Yousef, N., El-Gindi, A.F., Khalil, S. and El-Nahas, M. (1978) Groundwater Study Project, West Delta Area. Part I. National Academy of Egypt.
- Mendonca, C.A. and Silva, B.C. (1993) A Stable Truncated Series Approximation of the Reduction-to-the-Pole Operator. Geophysics, 58, 1084-1090. http://dx.doi.org/10.1190/1.1443492
- Grant, F.S. and West, G.F. (1965) Interpretation Theory in Applied Geophysics. McGraw-Hill, New York, 179-191.
- Linsser, H. (1967) Investigation of Tectonic by Gravity Detailing. Geophysical Prospecting, 15, 480-515. http://dx.doi.org/10.1111/j.1365-2478.1967.tb01800.x
- Talwani, M. (1965) Computation with the Help of a Digital Computer of Magnetic Anomalies Caused by Bodies of Arbitrary Shape. Geophysics, XXX, 797-817. http://dx.doi.org/10.1190/1.1439654
- Bhattacharyya, B.K. (1980) A Generalized Multibody Model for Inversion of Magnetic Anomalies. Geophysics, 29, 517-531. http://dx.doi.org/10.1190/1.1441081
- Shuey, R.T. and Pasqual, A.S. (1973) End Corrections in Magnetic Profile Interpretation. Geophysics, 38, 507-512. http://dx.doi.org/10.1190/1.1440356
- Encom Model Vision Pro. (2004) Software for PC Developed and Supported by Encom Technology. Version 6.00, Pty Ltd., North Sydney, 2061.
- RIGW/IWACO (1991) Hydrogeological Map of Abu El Matamir Area, Scale 1:100,000.
- U.S. Salinity Laboratory Staff (1954) Diagnosis and Improvement of Saline and Alkali Soils: Agric. Handbook, Washington DC, 1-66.