 American Journal of Anal yt ical Chemistry, 2011, 2, 689-696 doi:10.4236/ajac.2011.26079 Published Online October 2011 (http://www.SciRP.org/journal/ajac) Copyright © 2011 SciRes. AJAC Single Drop Microextraction of Biphenyl and Biphenyl Oxide in Aqueous Samples by Gas Chromatography-Flame Ionization Detection Maryam Sarkhosh1, Ali Mehdinia2*, Ali Jabbari1, Yadollah Yamini3 1Department of Chemistry, Faculty of Sciences, K.N. Toosi University of Technology, Tehran, Iran 2Department of Marine Living Resources, Iranian National In stitute for Oceanography, Tehran, Iran 3Department of Chemistry, Tarbiat Modares University, Tehran, Iran E-mail: *mehdinia@inio.ac.ir Received June 23, 2011; revised July 29, 2011; accepted August 7, 2011 Abstract In this work, biphenyl and biphenyl oxide were extracted by direct single drop microextraction (di- rect-SDME) and analyzed by gas chromatography flame ionization detection. The extraction occurred by suspending a 7 µL drop of toluene (as extracting solvent) containing acetonaphton (as internal standard) from the tip of a microsyringe in direct-SDME, respectively. The effect of different parameters such as nature of extraction solvent, microdrop and sample temperatures, stirring rate, microdrop and sample volumes, ionic strength and extracting time on the extraction efficiency of the analytes were investigated and optimized. Under optimized conditions the detection limits (S/N = 3) of the biphenyl and biphenyl oxide were 1.80 ± 0.03 and 1.10 ± 0.02 µg·mL–1, respectively. Good linearity was obtained for both analytes using extraction techniques with the correlation coefficients at least 0.997 and the relative standard deviations (R.S.D.) were in the range of 1% - 3%. The percent recoveries of the analytes from spiked water samples were near to 100%. Keywords: Biphenyl, Biphenyl Oxide, Direct Single Drop Microextraction 1. Introduction One of the most common heat transfer fluids, Dowtherm A, is a eutectic mixture containing 26.5% biphenyl and 73.5% biphenyl oxide [1]. Biphenyl is used as dye car- rier for polyesters, feedstock, especially in the production of alkylbiphenyls, and a citrus fruit wrapping impreg- nate to reduce spoilage. Biphenyl oxide (DPO) is used in the production of emulsifiers, surfactants and textile dye labelling as a chemically reacted intermediate. The main application of this mixture is heat transfer in the distilla- tion tower and fatty acid production liner. This liquid has optimum heat coefficient with maximum service tem- perature up to 400˚C. There are many problems in fatty acid distillation tower that this liquid leaks from stocks to environment. The mixture is very harmful for human and ecological system. The concentration upper critical limit causes damage in liver and neurotic systems [2]. Thresh- olds limit value (TLV) in the surface waters is 0.2 g·mL–1 for both of them [3]. Conventional method for analyz- ing of this liquid is liquid-liquid extraction and gas chromatographic analysis, that is very time-consuming and uses much amount of organic solvent. Reported method for measurement of diphenyl and diphenyl oxide are very limited and in all of them, solution directly in- ject into the instruments: 1) Direct injection to gas chro- matograph equipped with flame ionization detector (GC/FID) with the accuracy of 9 µg·mL–1 [4]. 2) Direct injection to gas chromatograph equipped with mass spectrometer detector (GC/MS) with the accuracy of 12 pg·kg–1 [5]. 3) Direct injection to high performance liq- uid chromatograph equipped with fluorescence detector (HPLC-FLD) with the accuracy of 2 µg·mL–1 [6]. In general, liquid-liquid extraction (LLE) and solid- phase extraction (SPE) are the most commonly used sam- ple pretreatment methods for the isolation and/or en- richment of organic pollutants [7-9]. Nonetheless, the necessity of reducing overall sample preparation time and quantities of organic solvents led to the development of several new extraction approaches, including solid- 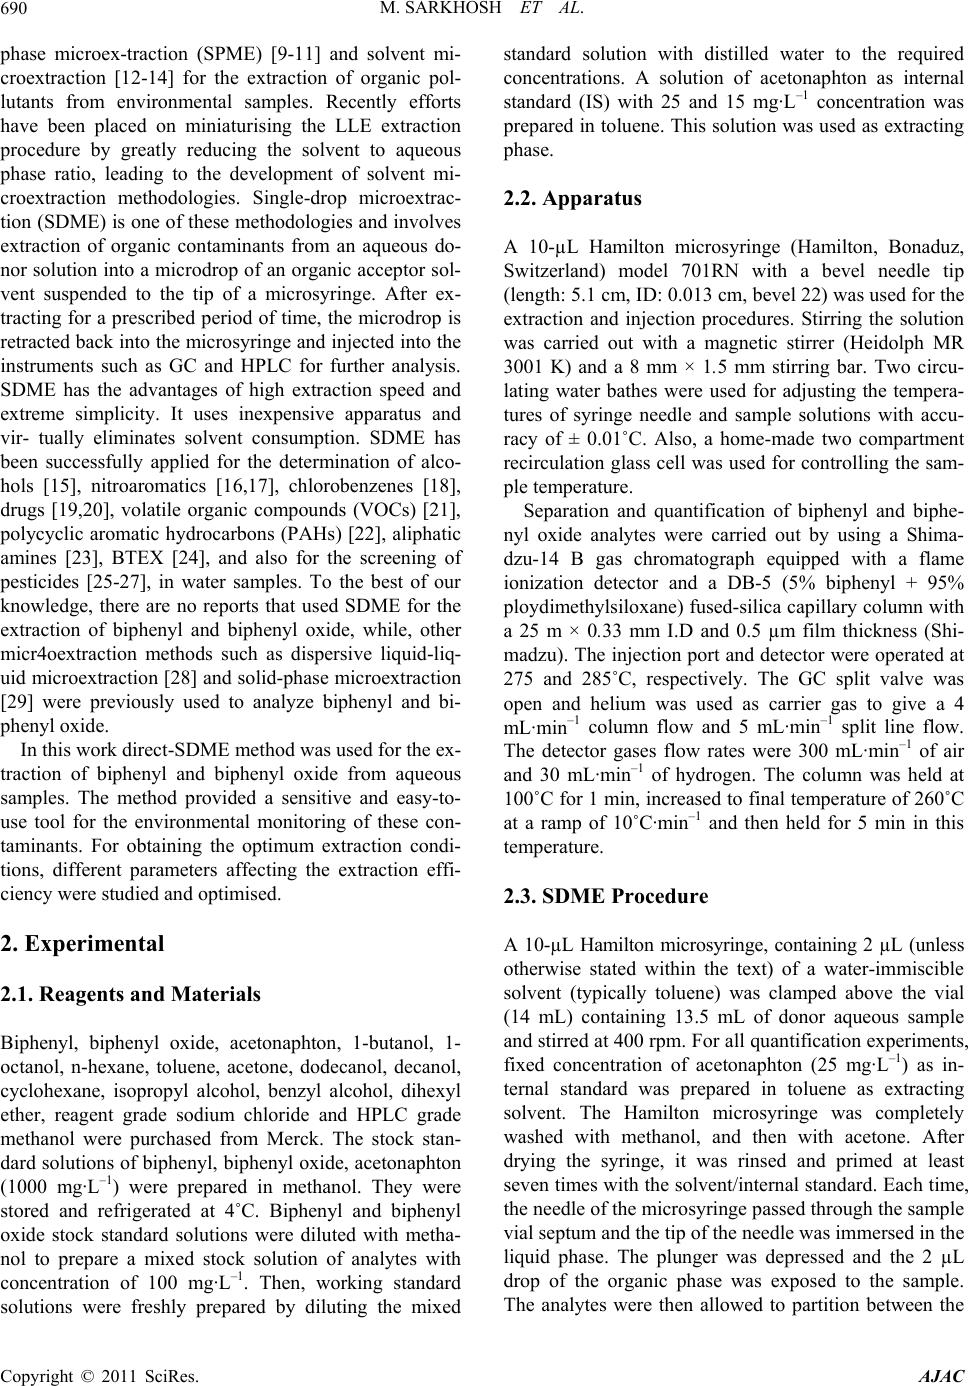 M. SARKHOSH ET AL. 690 phase microex-traction (SPME) [9-11] and solvent mi- croextraction [12-14] for the extraction of organic pol- lutants from environmental samples. Recently efforts have been placed on miniaturising the LLE extraction procedure by greatly reducing the solvent to aqueous phase ratio, leading to the development of solvent mi- croextraction methodologies. Single-drop microextrac- tion (SDME) is one of these methodologies and involves extraction of organic contaminants from an aqueous do- nor solution into a microdrop of an organic acceptor sol- vent suspended to the tip of a microsyringe. After ex- tracting for a prescribed period of time, the microdrop is retracted back into the microsyringe and injected into the instruments such as GC and HPLC for further analysis. SDME has the advantages of high extraction speed and extreme simplicity. It uses inexpensive apparatus and vir- tually eliminates solvent consumption. SDME has been successfully applied for the determination of alco- hols [15], nitroaromatics [16,17], chlorobenzenes [18], drugs [19,20], volatile organic compounds (VOCs) [21], polycyclic aromatic hydrocarbons (PAHs) [22], aliphatic amines [23], BTEX [24], and also for the screening of pesticides [25-27], in water samples. To the best of our knowledge, there are no reports that used SDME for the extraction of biphenyl and biphenyl oxide, while, other micr4oextraction methods such as dispersive liquid-liq- uid microextraction [28] and solid-phase microextraction [29] were previously used to analyze biphenyl and bi- phenyl oxide. In this work direct-SDME method was used for the ex- traction of biphenyl and biphenyl oxide from aqueous samples. The method provided a sensitive and easy-to- use tool for the environmental monitoring of these con- taminants. For obtaining the optimum extraction condi- tions, different parameters affecting the extraction effi- ciency were studied and optimised. 2. Experimental 2.1. Reagents and Materials Biphenyl, biphenyl oxide, acetonaphton, 1-butanol, 1- octanol, n-hexane, toluene, acetone, dodecanol, decanol, cyclohexane, isopropyl alcohol, benzyl alcohol, dihexyl ether, reagent grade sodium chloride and HPLC grade methanol were purchased from Merck. The stock stan- dard solutions of biphenyl, biphenyl oxide, acetonaphton (1000 mg·L–1) were prepared in methanol. They were stored and refrigerated at 4˚C. Biphenyl and biphenyl oxide stock standard solutions were diluted with metha- nol to prepare a mixed stock solution of analytes with concentration of 100 mg·L–1. Then, working standard solutions were freshly prepared by diluting the mixed standard solution with distilled water to the required concentrations. A solution of acetonaphton as internal standard (IS) with 25 and 15 mg·L–1 concentration was prepared in toluene. This solution was used as extracting phase. 2.2. Apparatus A 10-µL Hamilton microsyringe (Hamilton, Bonaduz, Switzerland) model 701RN with a bevel needle tip (length: 5.1 cm, ID: 0.013 cm, bevel 22) was used for the extraction and injection procedures. Stirring the solution was carried out with a magnetic stirrer (Heidolph MR 3001 K) and a 8 mm × 1.5 mm stirring bar. Two circu- lating water bathes were used for adjusting the tempera- tures of syringe needle and sample solutions with accu- racy of ± 0.01˚C. Also, a home-made two compartment recirculation glass cell was used for controlling the sam- ple temperature. Separation and quantification of biphenyl and biphe- nyl oxide analytes were carried out by using a Shima- dzu-14 B gas chromatograph equipped with a flame ionization detector and a DB-5 (5% biphenyl + 95% ploydimethylsiloxane) fused-silica capillary column with a 25 m × 0.33 mm I.D and 0.5 µm film thickness (Shi- madzu). The injection port and detector were operated at 275 and 285˚C, respectively. The GC split valve was open and helium was used as carrier gas to give a 4 mL·min–1 column flow and 5 mL·min–1 split line flow. The detector gases flow rates were 300 mL·min–1 of air and 30 mL·min–1 of hydrogen. The column was held at 100˚C for 1 min, increased to final temperature of 260˚C at a ramp of 10˚C·min–1 and then held for 5 min in this temperature. 2.3. SDME Procedure A 10-µL Hamilton microsyringe, containing 2 µL (unless otherwise stated within the text) of a water-immiscible solvent (typically toluene) was clamped above the vial (14 mL) containing 13.5 mL of donor aqueous sample and stirred at 400 rpm. For all quantification experiments, fixed concentration of acetonaphton (25 mg·L–1) as in- ternal standard was prepared in toluene as extracting solvent. The Hamilton microsyringe was completely washed with methanol, and then with acetone. After drying the syringe, it was rinsed and primed at least seven times with the solvent/internal standard. Each time, the needle of the microsyringe passed through the sample vial septum and the tip of the needle was immersed in the liquid phase. The plunger was depressed and the 2 µL drop of the organic phase was exposed to the sample. The analytes were then allowed to partition between the Copyright © 2011 SciRes. AJAC  M. SARKHOSH ET AL.691 aqueous solution and the organic phase at room tem- perature for 15 min (unless otherwise stated). After ex- traction, the microdrop was retracted into the microsy- ringe and transferred to the hot injector of the GC-FID for analysis. 3. Results and Discussion The initial objective was to optimize the direct-SDME sampling conditions and to fix the parametric values for the extraction of biphenyl and biphenyl oxide. The dy- namic characteristics of the microextraction process are closely related to the mass transfer of the analytes from the aqueous to the organic phase. Intrinsically, the SDME process is driven by the difference gradient of concentration between aqueous and organic phases. There were several parameters which determine the mass transfer such as the extraction solvent, drop and sample volume, temperature and ionic strength, stirring rate and extraction time. These parameters were chosen to opti- mize the performance in the current study via a univari- ate optimization approach. Conditions for the both pro- cedure of SDME were tested using water solution of 25 µg·L–1 for each analyte. To obtain optimized extraction conditions, the relative peak area of analyte to the inter- nal standard (acetonaphton) was used in GC-FID analy- sis of the extracts. 3.1. Optimization of the SDME Procedures 3.1.1. Selecti on of Org ani c S olv ent The first step for the direct-SDME method in order to obtain optimized extraction is the selection of an appro- priate extraction solvent. The selection of the extraction solvent was based on the principle of “like dissolve like”. The final choice was based on the following factors: ex- traction efficiency, stability of the microdrop, low vola- tility, polarity, dipole moment, viscosity, and the com- patibility with direct injection into GC system, therefore several solvents with different chemical characteristics were tested. Three replicate tests were performed for each type of organic solvent. The responses obtained for each analyte with the five solvents are indicated in Fig- ure 1. The results showed that diehexyl ether exhibited the highest extraction efficiency for all the analytes and is more stable when compared with the other solvents. But their chromatographic peaks overlapped with some of the analytes’ peaks (Figure 2). After a detailed com- parison of the other solvents on the peak areas of the two main compounds, toluene was found to be optimal and finally chosen as the extraction solvent for the SDME analysis. For all quantification experiments, fixed concentration -20 0 20 40 60 80 100 Dihexyl etherTolueneCyclohexane2-DecanolDecanol peak area Biphenyl B iphenyl oxi de Figure 1. Effect of different extraction solvent on the ex- traction efficiency of direct-SDME, Other experimental conditions are as follows: Concentration level at 25 µg·L–1; 400 rpm stirring rate; temperature 24˚C; 3.0 µL drop vol- ume; 13.5 mL sample volume; 0% NaCl; 11.30 min extrac- tion time. Figure 2. Chromatograms obtained from extraction solu- tions with diehexyl ether. Experimental conditions were as: Concentration level at 100 µg·L–1; 300 rpm stirring rate; 5 µL drop volume; 10 mL sample volume; Temperature, 25˚C; 0% NaCl; 5 min extraction time). (*) is solvent impu- rity peak. of acetonaphton (25 mg·L–1) as internal standard was prepared in toluene as extracting solvent. 3.1.2. Solvent Drop V olume In SDME, the volume of extraction solvent is an impor- tant variable in extraction efficiency. The amount of the analytes extracted into an organic drop is linearly pro- portional to the drop size at equilibrium, as depicted by the following equation [15]: N = K Vorg,eq Caq,in (1) where N is the number of moles of analytes extracted by the organic drop; K is the distribution coefficient of an analyte between the aqueous phase and the organic drop; Vorg,eq is the volume of organic drop at equilibrium; and Caq,in is the initial concentration of the analyte in aqueous solution. It was demonstrated that a linear increase in GC signals occurs with the size of toluene in the range of 1 - Copyright © 2011 SciRes. AJAC  M. SARKHOSH ET AL. 692 4.0 µL, as predicted from Equation (1), (Figure 3). However, larger drops are difficult to manipulate and less reliable. In addition, the analyte get into the drop through the diffusion process, the larger the drop volume, the longer the time to reach the equilibrium. However, when the microdrop volume was 4 µL, the extraction ef- ficiency increases, but microdrops were difficult to ma- nipulate and led to instability of the microdrop at the needle tip. Therefore, 3.5 µL was used for all subsequent extractions. 3.1.3. Stirring Ra te Sample agitation can reduce the time needed to reach thermodynamic equilibrium, especially for the analyte with higher molecular weight, and thus stirring rate is an important parameter affecting SDME efficiency. A series of stirring rates varying from 0 to 700 rpm was opti- mized. As shown in Figure 4, an increase in stirring rate led to an increase of analyte peak area between stirring rates of 0 and 500 rpm. This is because agitation permits continuous exposure of the extraction surface to fresh aqueous sample and reduces the thickness of the static layer. However, the analyte peak area decreased when the stirring rate exceeded 500 rpm. Perhaps extraction equilibrium was difficult to establish in the two phases at higher stirring rate. Moreover, higher stirring rate will also result in drop dislodgement and drop dissolution. However, the volume of the sedimented phase decreases from 3.5 to 1 µL when the stirring rate was reached above 500 rpm. It is due to the increase in solubility of extraction solvent in aqueous solution at high stirring rate. Consequently, a stirring rate of 500 rpm was used in subsequent experiments. 3.1.4. Ionic Strength The increased ionic strength of the sample solution is 0 200 400 600 800 1000 1200 012345 Drop volum e ( 礚) Pea k a rea Biphenyl Biphenyl oxide (L) Figure 3. Effect of solvent drop volume on the extraction efficiency of direct-SDME for biphenyl and biphenyl oxide. Other experimental conditions are as follows: Concentra- tion level at 25 µg·L–1; 400 rpm stirring rate; 13.5 mL sam- ple volume; microsyringe needle temperature, 0˚C; sample temperature, 24˚C; 0% NaCl; 11.5 min extraction time. expected to decrease the water solubility of the analytes (salting-out effect) and consequently to enhance the ex- traction yield. Figure 5 shows the influence of salt addi- tion (NaCl) on the extraction efficiency. It is obvious that salt, at any concentration, deteriorated extraction effi- ciency. The NaCl dissolved in water might have changed the physical properties of the Nernst diffusion film and reduced the rate of diffusion of the target analytes into the drop, and decreased die electric constant of water which result in increasing stability of analytes. This sig- nifies that with increasing the salt concentration, diffu- sion of analytes towards the organic drop becomes more and more difficult. Similar observations concerning the effect of salt on the SME analysis was also made by other researchers [30,31]. The aforementioned behaviour of the studied system negates the need for salt addition. 0 0.05 0.1 0.15 0.2 0.25 0.3 0200400 600 800 Stirring rate (rpm) Relative peak area Biphenyl Bip hen yl oxi d e Figure 4. Effect of stirring rate on the extraction efficiency of direct-SDME for biphenyl and biphenyl oxide. Other experimental conditions are as follows: Concentration level at 25 µg·L–1; 3.5 µL drop volume; 13.5 mL sample volume; 0% NaCl; sample temperature, 24˚C; 11.30 min extraction time. 0 0.1 0.2 0.3 0.4 0 0.5 1 1.5 2 2.5 3 3.5 NaCl concentration (M) Relative peak area Biphenyl Biphenyl oxide Figure 5. Effect of ionic strength on the extraction effi- ciency of direct-SDME for biphenyl and biphenyl oxide. Other experimental conditions are as follows: Concentra- tion level at 25 µg·L–1; 3.5 µL drop volume; stirring rate 500 rpm; 13.5 mL sample volume; sample temperature, 24˚C; 11.30 min extraction time. Copyright © 2011 SciRes. AJAC 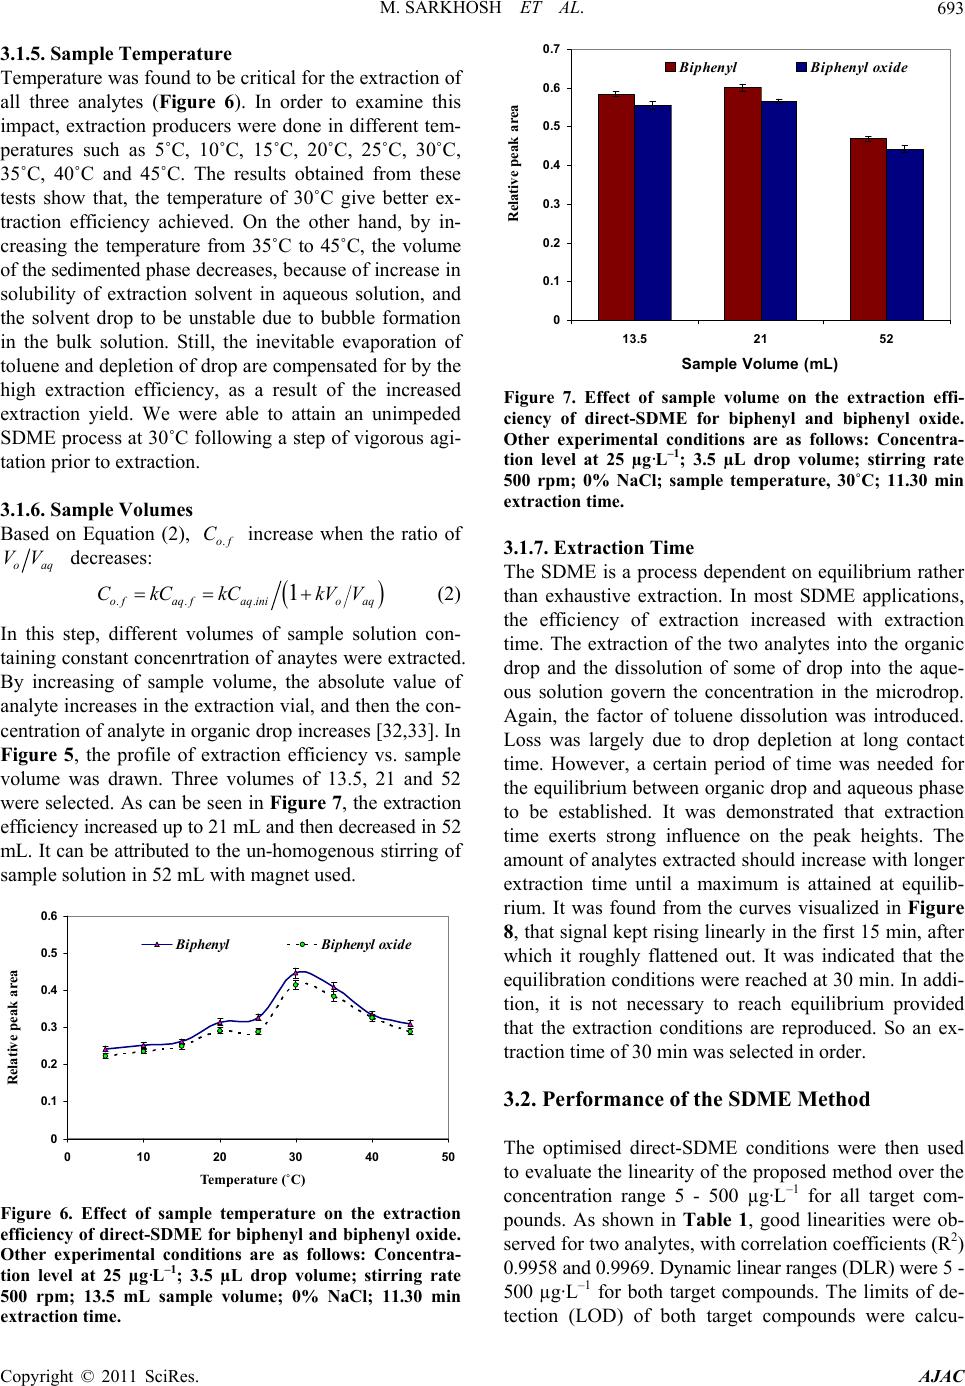 M. SARKHOSH ET AL.693 3.1.5. Sample Temperature Temperature was found to be critical for the extraction of all three analytes (Figure 6). In order to examine this impact, extraction producers were done in different tem- peratures such as 5˚C, 10˚C, 15˚C, 20˚C, 25˚C, 30˚C, 35˚C, 40˚C and 45˚C. The results obtained from these tests show that, the temperature of 30˚C give better ex- traction efficiency achieved. On the other hand, by in- creasing the temperature from 35˚C to 45˚C, the volume of the sedimented phase decreases, because of increase in solubility of extraction solvent in aqueous solution, and the solvent drop to be unstable due to bubble formation in the bulk solution. Still, the inevitable evaporation of toluene and depletion of drop are compensated for by the high extraction efficiency, as a result of the increased extraction yield. We were able to attain an unimpeded SDME process at 30˚C following a step of vigorous agi- tation prior to extraction. 3.1.6. Sample Volumes Based on Equation (2), increase when the ratio of .of C oaq VV decreases: ... 1 of aqf aqinioaq CkC kCkVV (2) In this step, different volumes of sample solution con- taining constant concenrtration of anaytes were extracted. By increasing of sample volume, the absolute value of analyte increases in the extraction vial, and then the con- centration of analyte in organic drop increases [32,33]. In Figure 5, the profile of extraction efficiency vs. sample volume was drawn. Three volumes of 13.5, 21 and 52 were selected. As can be seen in Figure 7, the extraction efficiency increased up to 21 mL and then decreased in 52 mL. It can be attributed to the un-homogenous stirring of sample solution in 52 mL with magnet used. 0 0.1 0.2 0.3 0.4 0.5 0.6 0 10203040 Tempreature (癈) Relative peak area 50 Biphenyl Biphenyl oxide Te mperature (˚C) Figure 6. Effect of sample temperature on the extraction efficiency of direct-SDME for biphenyl and biphenyl oxide. Other experimental conditions are as follows: Concentra- tion level at 25 µg·L–1; 3.5 µL drop volume; stirring rate 500 rpm; 13.5 mL sample volume; 0% NaCl; 11.30 min extraction time. 0 0.1 0.2 0.3 0.4 0.5 0.6 0.7 13.5 2152 Sample Volume (mL) Relative peak area Biphenyl B ip henyl oxid e Figure 7. Effect of sample volume on the extraction effi- ciency of direct-SDME for biphenyl and biphenyl oxide. Other experimental conditions are as follows: Concentra- tion level at 25 µg·L–1; 3.5 µL drop volume; stirring rate 500 rpm; 0% NaCl; sample temperature, 30˚C; 11.30 min extraction time. 3.1.7. Extraction Time The SDME is a process dependent on equilibrium rather than exhaustive extraction. In most SDME applications, the efficiency of extraction increased with extraction time. The extraction of the two analytes into the organic drop and the dissolution of some of drop into the aque- ous solution govern the concentration in the microdrop. Again, the factor of toluene dissolution was introduced. Loss was largely due to drop depletion at long contact time. However, a certain period of time was needed for the equilibrium between organic drop and aqueous phase to be established. It was demonstrated that extraction time exerts strong influence on the peak heights. The amount of analytes extracted should increase with longer extraction time until a maximum is attained at equilib- rium. It was found from the curves visualized in Figure 8, that signal kept rising linearly in the first 15 min, after which it roughly flattened out. It was indicated that the equilibration conditions were reached at 30 min. In addi- tion, it is not necessary to reach equilibrium provided that the extraction conditions are reproduced. So an ex- traction time of 30 min was selected in order. 3.2. Performance of the SDME Method The optimised direct-SDME conditions were then used to evaluate the linearity of the proposed method over the concentration range 5 - 500 µg·L–1 for all target com- pounds. As shown in Table 1, good linearities were ob- served for two analytes, with correlation coefficients (R2) 0.9958 and 0.9969. Dynamic linear ranges (DLR) were 5 - 500 µg·L–1 for both target compounds. The limits of de- tection (LOD) of both target compounds were calcu- Copyright © 2011 SciRes. AJAC 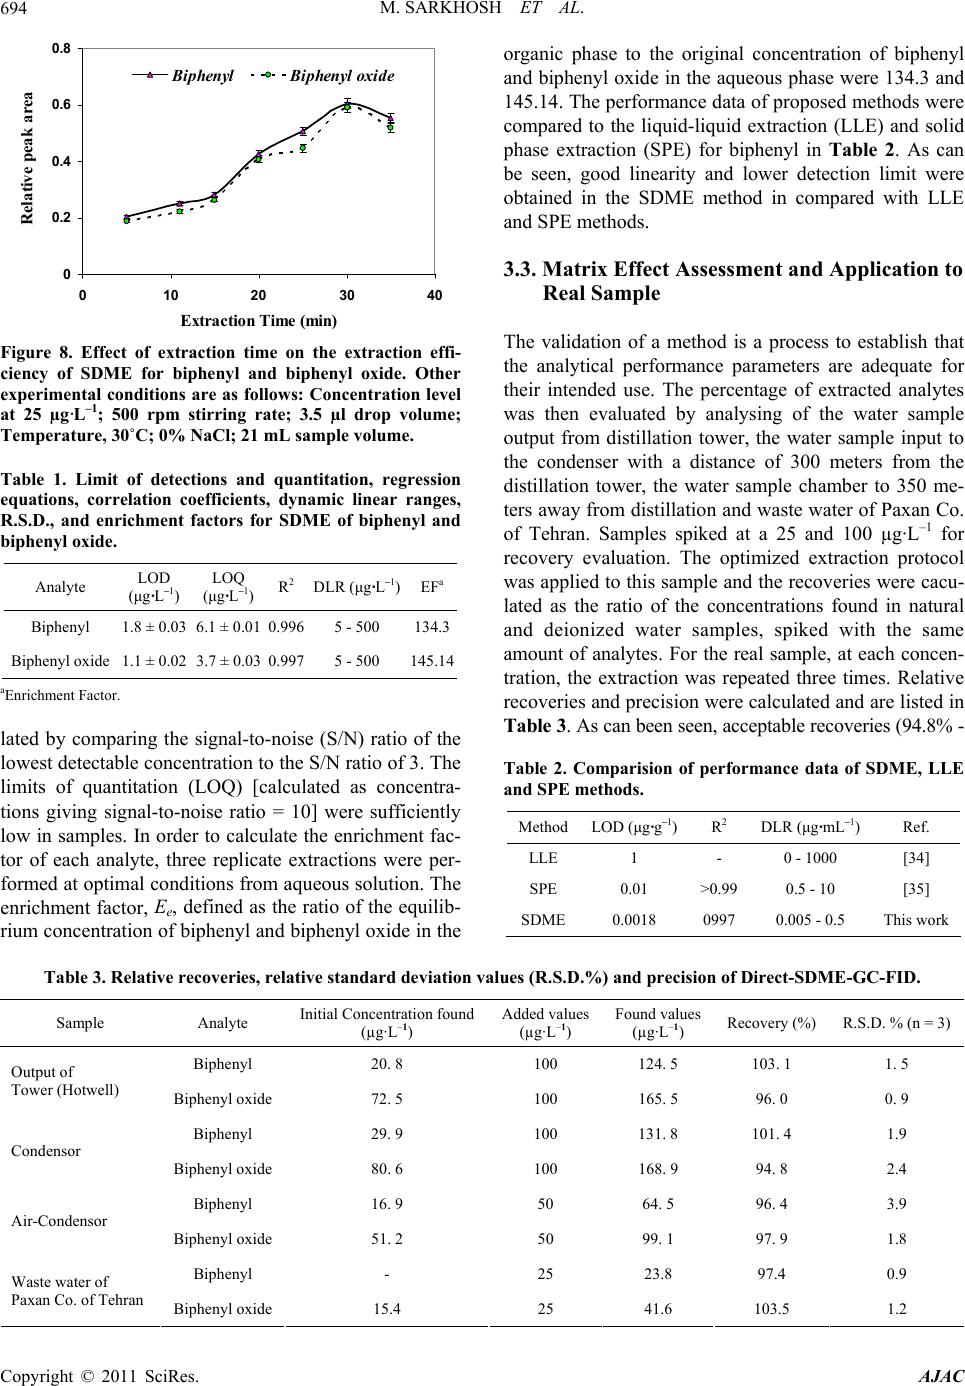 M. SARKHOSH ET AL. Copyright © 2011 SciRes. AJAC 694 0 0.2 0.4 0.6 0.8 0102030 Extra ction Time (min) Relative peak area 40 Biphenyl Bip henyl oxide organic phase to the original concentration of biphenyl and biphenyl oxide in the aqueous phase were 134.3 and 145.14. The performance data of proposed methods were compared to the liquid-liquid extraction (LLE) and solid phase extraction (SPE) for biphenyl in Table 2. As can be seen, good linearity and lower detection limit were obtained in the SDME method in compared with LLE and SPE methods. 3.3. Matrix Effect Assessment and Application to Real Sample The validation of a method is a process to establish that the analytical performance parameters are adequate for their intended use. The percentage of extracted analytes was then evaluated by analysing of the water sample output from distillation tower, the water sample input to the condenser with a distance of 300 meters from the distillation tower, the water sample chamber to 350 me- ters away from distillation and waste water of Paxan Co. of Tehran. Samples spiked at a 25 and 100 µg·L–1 for recovery evaluation. The optimized extraction protocol was applied to this sample and the recoveries were cacu- lated as the ratio of the concentrations found in natural and deionized water samples, spiked with the same amount of analytes. For the real sample, at each concen- tration, the extraction was repeated three times. Relative recoveries and precision were calculated and are listed in Table 3. As can been seen, acceptable recoveries (94.8% - Figure 8. Effect of extraction time on the extraction effi- ciency of SDME for biphenyl and biphenyl oxide. Other experimental conditions are as follows: Concentration level at 25 µg·L–1; 500 rpm stirring rate; 3.5 µl drop volume; Temperature, 30˚C; 0% NaCl; 21 mL sample volume. Table 1. Limit of detections and quantitation, regression equations, correlation coefficients, dynamic linear ranges, R.S.D., and enrichment factors for SDME of biphenyl and biphenyl oxide. Analyte LOD (μg·L–1) LOQ (μg·L–1)R2 DLR (μg·L–1)EF a Biphenyl 1.8 ± 0.03 6.1 ± 0.01 0.996 5 - 500 134.3 Biphenyl oxide 1.1 ± 0.02 3.7 ± 0.03 0.997 5 - 500 145.14 aEnrichment Factor. lated by comparing the signal-to-noise (S/N) ratio of the lowest detectable concentration to the S/N ratio of 3. The limits of quantitation (LOQ) [calculated as concentra- tions giving signal-to-noise ratio = 10] were sufficiently low in samples. In order to calculate the enrichment fac- tor of each analyte, three replicate extractions were per- formed at optimal conditions from aqueous solution. The enrichment factor, Ee, defined as the ratio of the equilib- rium concentration of biphenyl and biphenyl oxide in the Table 2. Comparision of performance data of SDME, LLE and SPE methods. MethodLOD (μg·g–1)R 2 DLR (μg·mL–1) Ref. LLE 1 - 0 - 1000 [34] SPE 0.01 >0.99 0.5 - 10 [35] SDME0.0018 0997 0.005 - 0.5 This work Table 3. Relative recoveries, relative standard deviation values (R.S.D.%) and precision of Direct-SDME-GC-FID. Added values (µg·L–1) Found values Sample Analyte Initial Concentration found (µg·L–1) (µg·L–1) Recovery (%) R.S.D. % (n = 3) Biphenyl 20. 8 100 124. 5 103. 1 1. 5 Output of Tower (Hotwell) Biphenyl oxide 72. 5 100 165. 5 96. 0 0. 9 Biphenyl 29. 9 100 131. 8 101. 4 1.9 Condensor Biphenyl oxide 80. 6 100 168. 9 94. 8 2.4 Biphenyl 16. 9 50 64. 5 96. 4 3.9 Air-Condensor Biphenyl oxide 51. 2 50 99. 1 97. 9 1.8 Biphenyl - 25 23.8 97.4 0.9 Waste water of Paxan Co. of Tehran Biphenyl oxide 15.4 25 41.6 103.5 1.2 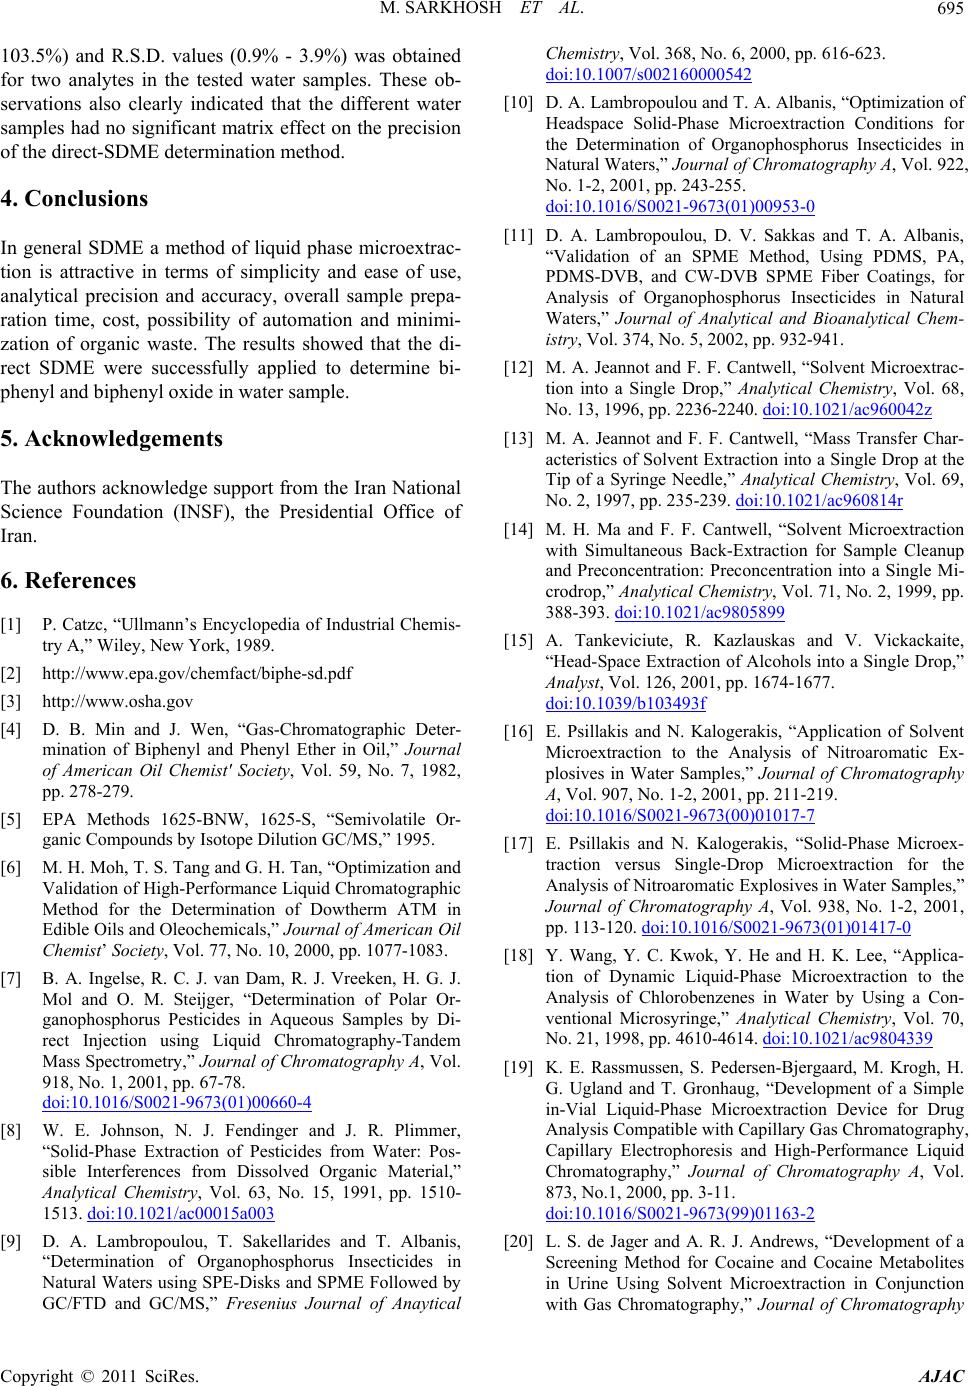 M. SARKHOSH ET AL. Copyright © 2011 SciRes. AJAC 695 103.5%) and R.S.D. values (0.9% - 3.9%) was obtained for two analytes in the tested water samples. These ob- servations also clearly indicated that the different water samples had no significant matrix effect on the precision of the direct-SDME determination method. 4. Conclusions In general SDME a method of liquid phase microextrac- tion is attractive in terms of simplicity and ease of use, analytical precision and accuracy, overall sample prepa- ration time, cost, possibility of automation and minimi- zation of organic waste. The results showed that the di- rect SDME were successfully applied to determine bi- phenyl and biphenyl oxide in water sample. 5. Acknowledgements The authors acknowledge support from the Iran National Science Foundation (INSF), the Presidential Office of Iran. 6. References [1] P. Catzc, “Ullmann’s Encyclopedia of Industrial Chemis- try A,” Wiley, New York, 1989. [2] http://www.epa.gov/chemfact/biphe-sd.pdf [3] http://www.osha.gov [4] D. B. Min and J. Wen, “Gas-Chromatographic Deter- mination of Biphenyl and Phenyl Ether in Oil,” Journal of American Oil Chemist' Society, Vol. 59, No. 7, 1982, pp. 278-279. [5] EPA Methods 1625-BNW, 1625-S, “Semivolatile Or- ganic Compounds by Isotope Dilution GC/MS,” 1995. [6] M. H. Moh, T. S. Tang and G. H. Tan, “Optimization and Validation of High-Performance Liquid Chromatographic Method for the Determination of Dowtherm ATM in Edible Oils and Oleochemicals,” Journal of American Oil Chemist’ Society, Vol. 77, No. 10, 2000, pp. 1077-1083. [7] B. A. Ingelse, R. C. J. van Dam, R. J. Vreeken, H. G. J. Mol and O. M. Steijger, “Determination of Polar Or- ganophosphorus Pesticides in Aqueous Samples by Di- rect Injection using Liquid Chromatography-Tandem Mass Spectrometry,” Journal of Chromatography A, Vol. 918, No. 1, 2001, pp. 67-78. doi:10.1016/S0021-9673(01)00660-4 [8] W. E. Johnson, N. J. Fendinger and J. R. Plimmer, “Solid-Phase Extraction of Pesticides from Water: Pos- sible Interferences from Dissolved Organic Material,” Analytical Chemistry, Vol. 63, No. 15, 1991, pp. 1510- 1513. doi:10.1021/ac00015a003 [9] D. A. Lambropoulou, T. Sakellarides and T. Albanis, “Determination of Organophosphorus Insecticides in Natural Waters using SPE-Disks and SPME Followed by GC/FTD and GC/MS,” Fresenius Journal of Anaytical Chemistry, Vol. 368, No. 6, 2000, pp. 616-623. doi:10.1007/s002160000542 [10] D. A. Lambropoulou and T. A. Albanis, “Optimization of Headspace Solid-Phase Microextraction Conditions for the Determination of Organophosphorus Insecticides in Natural Waters,” Journal of Chromatography A, Vol. 922, No. 1-2, 2001, pp. 243-255. doi:10.1016/S0021-9673(01)00953-0 [11] D. A. Lambropoulou, D. V. Sakkas and T. A. Albanis, “Validation of an SPME Method, Using PDMS, PA, PDMS-DVB, and CW-DVB SPME Fiber Coatings, for Analysis of Organophosphorus Insecticides in Natural Waters,” Journal of Analytical and Bioanalytical Chem- istry, Vol. 374, No. 5, 2002, pp. 932-941. [12] M. A. Jeannot and F. F. Cantwell, “Solvent Microextrac- tion into a Single Drop,” Analytical Chemistry, Vol. 68, No. 13, 1996, pp. 2236-2240. doi:10.1021/ac960042z [13] M. A. Jeannot and F. F. Cantwell, “Mass Transfer Char- acteristics of Solvent Extraction into a Single Drop at the Tip of a Syringe Needle,” Analytical Chemistry, Vol. 69, No. 2, 1997, pp. 235-239. doi:10.1021/ac960814r [14] M. H. Ma and F. F. Cantwell, “Solvent Microextraction with Simultaneous Back-Extraction for Sample Cleanup and Preconcentration: Preconcentration into a Single Mi- crodrop,” Analytical Chemistry, Vol. 71, No. 2, 1999, pp. 388-393. doi:10.1021/ac9805899 [15] A. Tankeviciute, R. Kazlauskas and V. Vickackaite, “Head-Space Extraction of Alcohols into a Single Drop,” Analyst, Vol. 126, 2001, pp. 1674-1677. doi:10.1039/b103493f [16] E. Psillakis and N. Kalogerakis, “Application of Solvent Microextraction to the Analysis of Nitroaromatic Ex- plosives in Water Samples,” Journal of Chromatography A, Vol. 907, No. 1-2, 2001, pp. 211-219. doi:10.1016/S0021-9673(00)01017-7 [17] E. Psillakis and N. Kalogerakis, “Solid-Phase Microex- traction versus Single-Drop Microextraction for the Analysis of Nitroaromatic Explosives in Water Samples,” Journal of Chromatography A, Vol. 938, No. 1-2, 2001, pp. 113-120. doi:10.1016/S0021-9673(01)01417-0 [18] Y. Wang, Y. C. Kwok, Y. He and H. K. Lee, “Applica- tion of Dynamic Liquid-Phase Microextraction to the Analysis of Chlorobenzenes in Water by Using a Con- ventional Microsyringe,” Analytical Chemistry, Vol. 70, No. 21, 1998, pp. 4610-4614. doi:10.1021/ac9804339 [19] K. E. Rassmussen, S. Pedersen-Bjergaard, M. Krogh, H. G. Ugland and T. Gronhaug, “Development of a Simple in-Vial Liquid-Phase Microextraction Device for Drug Analysis Compatible with Capillary Gas Chromatography, Capillary Electrophoresis and High-Performance Liquid Chromatography,” Journal of Chromatography A, Vol. 873, No.1, 2000, pp. 3-11. doi:10.1016/S0021-9673(99)01163-2 [20] L. S. de Jager and A. R. J. Andrews, “Development of a Screening Method for Cocaine and Cocaine Metabolites in Urine Using Solvent Microextraction in Conjunction with Gas Chromatography,” Journal of Chromatography  M. SARKHOSH ET AL. 696 A, Vol. 911, No. 1, 2001, pp. 97-105. doi:10.1016/S0021-9673(00)01256-5 [21] B. Buszewski and T. Ligor, “Single-Drop Extraction Versus Solid-Phase Microextraction,” LC-GC Euroupe, Vol. 15, No. 2, 2002, pp. 92-97. doi:10.1016/S0003-2670(03)00709-8 [22] S. Shariati-Feizabadi, Y. Yamini and N. Bahramifar, “Headspace Solvent Microextraction and Gas Chroma- tographic Determination of Some Polycyclic Aromatic Hydrocarbons in Water Samples,” Analytica Chimica Acta, Vol. 489, No. 1, 2003, pp. 21-31. [23] M. Kaykhaii, S. Nazari and M. Chamsaz, “Determination of Aliphatic Amines in Water by Gas Chromatography using Headspace Solvent Microextraction,” Talanta, Vol. 65, No. 1, 2005, pp. 223-228. doi:10.1016/j.talanta.2004.06.019 [24] A. Przyjazny and J. M. Kokosa, “Analytical Characteris- tics of the Determination of Benzene, Toluene, Ethyl- benzene and Xylenes in Water by Headspace Solvent Microextraction,” Journal of Chromatography A, Vol. 977, No. 2, 2002, pp. 143-153. doi:10.1016/S0021-9673(02)01422-X [25] L. S. D. Jager and A. R. J. Andrews, “Solvent Microex- traction of Chlorinated Pesticides,” Chromatographia, Vol. 50, No. 11-12, 1999, 733-738. doi:10.1007/BF02497313 [26] L. S. D. Jager and A. R. J. Andrews, “Development of a Rapid Screening Technique for Organochlorine Pesti- cides Using Solvent Microextraction (SME) and Fast Gas Chromatography (GC),” Analyst, Vol. 125, 2000, pp. 1943-1948. doi:10.1039/b004350h [27] M. C. Lopez-Blanco, S. Blanco-Cid, B. Cancho-Grande and J. Simal-Gandara, “Application of Single-Drop Mi- croextraction and Comparison with Solid-Phase Micro- extraction and Solid-Phase Extraction for the Determina- tion of α- and β-Endosulfan in Water Samples by Gas Chromatography-Electron-Capture Detection,” Journal of Chromatography A, Vol. 984, No. 2, 2003, pp. 245-252. [28] H. A. Mashayekhi, P. Abroomand-Azar, M. Saber-Te- hrani and S. Waqif-Husain, “Rapid and Sensitive Deter- mination of Biphenyl and Biphenyl Oxide in Water Sam ples Using Dispersive Liquid-liquid Microextraction Fol- lowed by Gas Chromatography,” International Journal of Environmental analytical Chemistry, Vol. 91, No. 6, 2011, pp. 516-524. doi:10.1080/03067310903525167 [29] R. Alizadeh, N. M. Najafi and S. Kharrazi, “A New Solid Phase Micro Extraction for Simultaneous Head Space Ex- Traction of Ultra Traces of Polar and Non-Polar Com- pounds, ” Analytica Chimica Acta, Vol. 689, No. 1, 2011, pp. 117-121. doi:10.1016/j.aca.2011.01.013 [30] D. A. Lambropoulou, V. A. Sakkas and T. A. Albanis, “Analysis of Antifouling Biocides Irgarol 1051 and Sea Nine 211 in Environmental Water Samples Using Solid- Phase Microextraction and Gas Chromatography,” Jour- nal of Chromatography A, Vol. 952, No. 1, 2002, pp. 215-227. doi:10.1016/S0021-9673(02)00085-7 [31] A. Penalver, E. Pocurull, F. Borrull and R. M. Marce, “Solid-Phase Microextraction of the Antifouling Irgarol 1051 and the Fungicides Dichlofluanid and 4-Chloro- 3-Methylphenol in Water Samples,” Journal of Chro- matography A, Vol. 839, No. 1-2, 1999, pp. 253-260. doi:10.1016/S0021-9673(99)00171-5 [32] T. Gorecki and J. Pawliszyn, “Effect of Sample Volume on Quantitative Analysis by Solid-Phase Microextraction. Part 1. Theoretical Considerations,” Analyst, Vol. 122, No. 10, 1997, pp. 1079-1086. doi:10.1039/a701303e [33] M. Liompart, K. Li and M. Fingas, “Headspace Solid Phase Microextraction (HSSPME) for the Determination of Volatile and Semivolatile Pollutants in Soils,” Talanta, Vol. 48, No. 2, 1999, pp. 451-459. doi:10.1016/S0039-9140(98)00263-X [34] Y. Yamazaki and T. Ninomiya, “Determination of Be- nomyl, Diphenyl, o-Phenylphenol, Thiabendazole, Chlor- pyrifos, Methidathion, and Methyl Parathion in Oranges by Solid-Phase Extraction, Liquid Chromatography, and Gas Chromatography,” Journal of AOAC International, Vol. 82, No. 6, 1999, pp. 1474-1478. [35] G. Westoo and A. Andersson, “Determination of Biphe- nyl and 2-Phenylphenol in Citrus Fruits by Gas-Liquid Chromatography,” Analyst, Vol. 100, 1975, pp. 173-177. doi:10.1039/an9750000173 Copyright © 2011 SciRes. AJAC
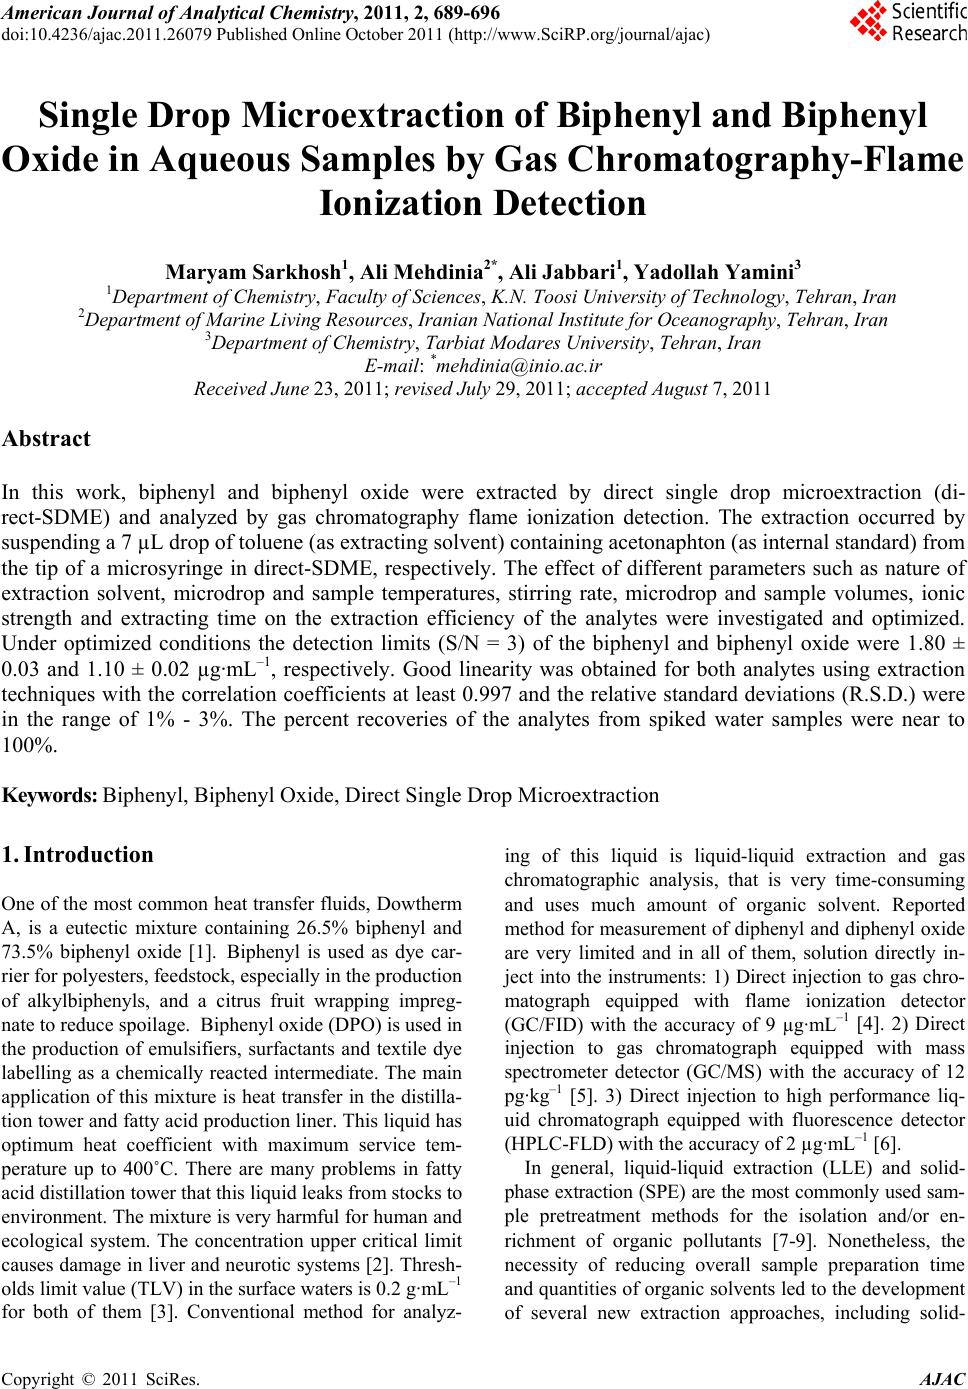
|