Energy and Power Engineering, 2011, 3, 483-489
doi:10.4236/epe.2011.34058 Published Online September 2011 (http://www.SciRP.org/journal/epe)
Copyright © 2011 SciRes. EPE
Effect of New Suggested Ferroresonance Limiter on the
Stability Domain of Chaotic Ferroresonance in the Power
Transformer with Linear Core Model
Hamid Radmanesh
1
, Seyed Hamid Fathi
2
, Mehrdad Rostami
3
1
Electrical Engineering Department, Shahid Sattari Aeronautical University of Science and Technology, Tehran, Iran
2
Electrical Engineering Department, Amirkabir University of Technology (Tehran Polytechnics), Tehran, Iran
3
Electrical Engineering Department, Shahed University, Tehran, Iran
E-mail: {Hamid.radmanesh, fathi}@aut.ac.ir, rostami@shahed.ac.ir
Received August 14, 2011; revised September 17, 2011; accepted September 29, 2011
Abstract
This paper studies the effect of new suggested ferroresonance limiter on controlling ferroresonance oscilla-
tions in the power transformer. It is expected that this limiter generally can control the ferroresonance. For
studying these phenomena, at first ferroresonance is introduced and a general modeling approach is given. A
simple case of ferroresonance in a three phase transformer is used to illustrate these phenomena. Then, effect
of new suggested ferroresonance limiter on the onset of chaotic ferroresonance and control of these oscilla-
tions in a power transformer including linear core losses is studied. Simulation is done on a three phase
power transformer while one of its phases is opened, and effect of varying input voltage on occurring fer-
roresonance overvoltage is studied. Results show that connecting the ferroresonance limiter to the trans-
former exhibits a great controlling effect on the ferroresonance overvoltage. Phase plane diagram, FFT
analysis along with bifurcation diagrams are also presented. Significant effect on occurring chaotic ferrore-
sonance, the range of parameter values that may lead to overvoltage and magnitude of ferroresonance over-
voltage is obtained, showed and tabulated.
Keywords: Linear Core Losses, Chaos, Bifurcation, Ferroresonance Oscillation, Power Transformers,
Ferroresonance Limiter
1. Introduction
The ferroresonance is typically initiated by saturable
magnetizing inductance of a transformer and a capacitive
distribution cable or transmission line connected to the
transformer. In most practical situations, ferroresonance
results in dominated currents, but in some operating
“mode”, may cause significant high values distorted
winding voltage waveform, which is typically referred to
as ferroresonance. Although occurrences of the “reso-
nance” occurring does involves a capacitance and an
inductance, but there is no definite resonant frequency
ferroresonance occurrence for it. In this phenomenon,
more than one response is possible for the same set of
parameters, and drifts or transients may cause the re-
sponse to jump from one steady-state response to another
one. Its occurrence is more likely to happen in the absence
of adequate damping. Research on ferroresonance in
transformers has been conducted over the last 80 years.
The word ferroresonance first appeared in the literature in
1920 [1], although papers on resonance in transformers
appeared as early as 1907 [2]. Practical interests had been
shown was in the 1930s, when it is shown that the use of
series capacitors for voltage regulation could cause fer-
roresonance in distribution systems [3]. Ferroresonant
behavior of a 275 kV potential transformer, fed from a
sinusoidal supply via circuit breaker grading capacitance,
is studied in [4]. The potential transformer ferroresonance
from an energy transfer point of view has been presented
in [5]. A systematical method for suppressing ferroreso-
nance at neutral-grounded substations has been studied in
[6]. A sensitivity study on power transformer ferroreso-
nance of a 400 kV double circuit has been reviewed in [7].
A novel analytical solution to the fundamental ferrore-
sonance has been given in [8]. In that paper, the problem
with the traditional excitation characteristic (TEC) of
nonlinear inductors has been investigated. The TEC con-
tains harmonic voltages and/or currents. The Stability
H. RADMANESH ET AL.
Copyright © 2011 SciRes. EPE
484
domain calculations of the period-1 ferroresonance have
been investigated in [9]. The application of the wavelet
transform and MLP neural network for the ferroresonance
identification is used in [10]. The impact of the trans-
former core hysteresis on the stability domain of fer-
roresonance modes has been studied in [11]. A 2-D fi-
nite-element electromagnetic analysis of an autotrans-
former experiencing ferroresonance is given in [12]. A
new modeling of transformers enabling to simulate slow
transients more accurate than the existing models in
Simulink/MATLAB is presented in [13]. Controlling
ferroresonance oscillations in potential transformer con-
sidering nonlinear core losses and the circuit breaker
shunt resistance effect has been investigated in [14] and
[15]. The effect of linear and nonlinear core losses on the
onset of chaotic ferroresonance and duration of transient
chaos in an autotransformer has been studied in [16]. In
current paper, new suggested ferroresonance limiter is
used as compact circuit including one resistor, power
electronic switch and control circuit for limiting and sta-
bilizing of unstable and high amplitude ferroresonance
oscillation. This resistance is connected to the grounding
point of the power transformer and during ferroresonance
occurrence; power electronic switch is connect the resis-
tor to the transformer via the controlling circuit. In this
work, MATLAB program is used to simulate ferroreso-
nance and related phase plane and bifurcation diagrams.
The result of the case study confirms that system states,
lead to chaos and bifurcation occurs in proposed model.
The presence of the ferroresonance limiter tends to clamp
the ferroresonance overvoltage. The ferroresonance lim-
iter successfully, reduces the chaotic region for higher
exponents. Simulation of system consists of two cases, at
first, system modeling of power transformer without
connecting ferroresonance limiter and second, power
system contains ferroresonance limiter. Finally compare
the result of these two cases.
2. Power System Modeling
In this section, power transformer is assumed to be con-
nected to the power system while one of the three
switches are open and only two phases of it are energized,
which produces induced voltage in the open phase. This
voltage, back feeds the distribution line. Ferroresonance
will occur if the distribution line is highly capacitive.
System involves the nonlinear magnetizing reactance of
the transformer’s open phase and resulted shunt and se-
ries capacitance of the distribution line [17]. Figure 1
shows the reduced equivalent thevenin circuit of the
power system.
Linear approximation of the peak current of the mag-
netization reactance can be presented by (1):
Figure 1. Reduce equivalent thevenin circuit of the power
system.
L
ia
(1)
However, for very high currents, the iron core might
be saturated where the flux-current characteristic be-
comes highly nonlinear. The
i
characteristic of the
transformer can be demonstrated by the polynomial in
(2):
q
L
iab
 (2)
where “q” is the index of nonlinearity of iron core. The
differential equation for the circuit in Figure 1 is derived
as follows:
d
d
l
v
t
(3)
d
,
d
c
ccl
v
iCvEv
t
 (4)
clR
iii
(5)

d
d1d1
ddd
q
l
v
E
ab
ttRCtC
 (6)
where
d/dvt
and
represents the power fre-
quency and E is the peak value of the voltage source as
shown in
Figure 1. The state-space formulation
and
ddt
as state variables is as given below:


1
21
2
dd
xt
x
txt
vt
xtv

(7)

2211
11d
d
q
E
xtxtaxtbxt
RCCt

(8)




1
2
0 1
ytCXt
x
t
ytvt
x
t





(9)
1
2
0
d
d
u
E
u
t








(10)
H. RADMANESH ET AL.
Copyright © 2011 SciRes. EPE
485





11
1
1
22
01
0
1
1
q
xtxt
u
abq
xt
xtxt
CRC










(11)
det0A
 (12)

1
1
1
det0
1
q
abxt
CRC





(13)


2
2
1,2
2
123
4
0
2
1.411.41
ppq
pq
hhh
p
C
a
q
C




(14)
3. Simulation Results of the Power
Transformer without Considering
Ferroresonance Limiter Effect
Ferroresonance in three phase systems can involve large
power transformers, distribution transformers, or instru-
ment transformers (VT’s or CVT’s). The general re-
quirements for ferroresonance are an applied or induced
source voltage, a saturable magnetizing inductance of a
transformer, a capacitance, and little damping. The ca-
pacitance can be in the form of capacitance of under-
ground cables or long transmission lines, capacitor banks,
coupling capacitances between double circuit lines or in
a temporarily-ungrounded system, and voltage grading
capacitors in HV circuit breakers. Other possibilities are
generator surge capacitors and SVC’s in long transmis-
sion lines. Due to the multitude of transformer winding
and core configurations, various sources of capacitance,
and the nonlinearities involved, the scenarios under
which ferroresonance oscillations can occur are com-
pletely different. System events that may initiate fer-
roresonance include single-phase switching or fusing, or
loss of the system grounding. The ferroresonance circuit
in all cases is an applied (or induced) voltage connected
to a capacitance in series with a transformer’s magnetiz-
ing reactance. In this paper, time domain simulations
were performed using fourth order Runge-Kutta method
and validated against MATLAB SIMULINK. The initial
conditions as calculated from steady-state solution of
MATLAB are:
0,0;1.44 pu
l
v

Simulation is done in two categories, first: power sys-
tem simulation including transformer linear core losses
effect and second: power system simulation considering
ferroresonance limiter resistance effect. Typical values
for various system parameters considered for simulation
without ferroresonance limiter are as given bellowed in
Table 1.
In the first step, nonlinear model of the transformer
disconnected coil is considered with q = 7.
Figure 2
shows the power system overvoltage considering degree
of nonlinearity index q = 7. This phase plan diagram
clearly shows period II oscillation while some extra sub-
harmonic resonances are included in the behavior of the
power system. Amplitude of the subharmonic oscilla-
tions is reached to 3 p.u, and power spectrum density is
shown the existence frequencies in the power system.
According to this plot, it is indicate two main frequen-
cies.
Figure 3(a) shows the phase plan diagram of over-
voltage on the transformer with q = 11. It is shown when
the degree of q is 11, amplitude of the overvoltage
reaches to 4 p.u.
Figure 3(b) shows the power spectrum
when input voltage of the power system is 3 p.u. This
plot shows the chaotic signal with some subharmonic
resonances in it. By referring to this plot, it is shows the
overvoltage on transformer is highly nonlinear and cha-
otic ferroresonance can cause transformer failure. Bifur-
cation diagram is the best tool for studying the nonlinear
dynamic systems. By this tool system behavior can be
analyzes in the best view.
Figures 4 and 5 show the bi-
furcation diagram for q = 7 and 11while value of the
input voltage is increased from 1 to 8 p.u. In the bifurca-
tion diagram as shown in
Figure 4, in point (1) one jump
is appeared in the system behavior, in point (2) period V
is occurred and when input voltage is reached to 4.5 p.u
as shown with point (3), chaotic ferroresonance is begun,
and amplitude of these overvoltage is reached to 3 p.u.
It is also shown when degree of q is increased to 11;
nonlinear phenomena in the transformer are begun in the
low value of the input voltage. It was found that the cha-
otic behavior begins at a value of
(5 p.u)E for q = 7
Table 1. Power system parameters and per unit value with-
out ferroresonance limiter resistance effect.
Q 7 11
Coefficient (a) 0.0067 0.0028
Coefficient (b) 0.001 0.0072
377 rad/sec
1 p.u
377 rad/sec
1 p.u
E
110/44 kv
1 p.u
110/44 kv
1 p.u
C
777 nf
0.82 p.u
777 nf
0.82 p.u
S 25 MVA 25 MVA
Initial Condition0, 1.41 p.u 0, 1.41 p.u
R
core
750
0.15 p.u
750
0.15 p.u
H. RADMANESH ET AL.
Copyright © 2011 SciRes. EPE
486
-3-2-10123
-5
-4
-3
-2
-1
0
1
2
3
4
5
Flux Linkage of Transformer
Voltage of Transformer
Phase Plan Diagram with q=7 without ferroresonance limiter effect
(a)
00.511.522.533.5
0
0.2
0.4
0.6
0.8
1
Frequency (Hz)
|V(f)|
Single-Sided Amplitude Spectrum of voltage on transformer without ferroresonance limiter effect
(b)
Figure 2. (a) Phase plan diagram for q = 7 without consid-
ering ferroresonance limiter effect. (b) Single-sided ampli-
tude spectrum without considering ferroresonance limiter
effect. Note: in the power spectrum plots, horizontal axis is
based on the normalized frequency. It means each 60 Hz is
one unit, so when spectrum shows the 3 units, its actual
value is 300 Hz.
and
(3 p.u)E for q = 11 where represents the ampli-
tude of the input voltage of the power system source.
Transient chaos settling down to the source frequency
and periodic solution was observed for some values of
the input voltage as shown in
Figure 4.
In
Figure 5, input voltage is increased to 8 p.u and
overvoltage on the transformer is analyzed according to
the variation of the input voltage. In point (1) one jump
is appeared in the system behavior. In point (2) chaotic
ferroresonance is appeared. In point (3) chaotic oscilla-
tions are changed to the periodic behavior with period III
oscillation. Finally, in point (4) system behavior is gone
to the chaotic oscillation with period doubling logic.
Tendency to chaos exhibited by the system voltage in-
creases while q increases too.
Table 2 shows different
values of E, considered for analyzing the circuit in ab-
sence of ferroresonance limiter.
4. Power System Modeling Considering
Ferroresonance Limiter
The primary purpose of inserting ferroresonance limiter
impedance between the star point of a transformer and
earth is to limit earth fault current. The value of impedance
-2-1.5-1-0.500.511.52
-5
-4
-3
-2
-1
0
1
2
3
4
5
Flux Linkage of Transformer
Voltage of Transformer
Phase Plan Diagram with q=11 without ferroresonance limiter effect
(a)
00.511.522.533.5
0
0.2
0.4
0.6
0.8
1
Frequency (Hz)
|V(f)|
Single-Sided Amplitude Spectrum of voltage on transformer without ferroresonance limiter effect
(b)
Figure 3. (a) Phase plan diagram for q = 11 without consid-
ering ferroresonance limiter effect. (b) Single-sided ampli-
tude spectrum without considering ferroresonance limiter
effect.
012345678
0
0.5
1
1.5
2
2.5
3
3.5
Input voltage(perunit)
Voltage of Transformer(perunit)
Bifurcation Diagram of Power Transformer with q=7 without ferroresonace limiter effect
(1)
(2)
(3)
Figure 4. Bifurcation diagram with q = 7, without connect-
ing ferroresonance limiter.
H. RADMANESH ET AL.
Copyright © 2011 SciRes. EPE
487
012345678
0
0.2
0.4
0.6
0.8
1
1.2
1.4
1.6
1.8
2
Input voltage(perunit)
Voltage of Transformer(perunit)
Bifurcation Diagram of Power Transformer with q=11 without ferroresonance limiter effect
(1)
(2)
(3)
(4)
Figure 5. Bifurcation diagram with q = 11 without consid-
ering ferroresonance limiter effect.
required is easily calculated to a reasonable approxima-
tion by dividing the rated phase voltage by the rated
phase current of the transformer. Ferroresonance limiter
impedance is conventionally achieved using resistors
rather than inductors, so as to limit the tendency for the
fault arc to persist due to inductive energy storage. These
resistors will dissipate considerable heat when earth fault
current flows and are usually only short term rated, so as
to achieve an economic design. Due to the explanation
above, In
Figure 6, R
FLR
is the ferroresonance limiter
resistance. Typical values for various system parameters
is considered for simulation were kept the same by the
case 1, while ferroresonance limiter impedance is added
to the power system configuration and its value is given
below:
50
K
FLR
R
Typical values for various system parameters consid-
ered for simulation with ferroresonance limiter are as
given in the
Table 3.
The differential equations of the equivalent circuit as
shown in
Figure 6 are given as bellowed:
F
LR
clR
Evvv
(15)
1d
d
FLR
q
RnFLRRFLR
vRiRab
Rt




(16)

1
d
d1d1
ddd
dd
dd
q
l
FLR
q
FLRFLR
v
RE
ab
tRRtRCtC
RaRqb
tt






(17)
where,
is flux linkage and v
l
is the voltage of the
power transformer.
5. Simulation Results of the Power
Transformer Considering Ferroresonance
Limiter Effect
Figures 7(a) and (b) show the phase plan diagram, and
Figure 6. Equivalent circuit of the power system connecting
ferroresonance limiter impedance.
Table 2. Simulation results without considering ferroreso-
nance limiter.
q/E123 4 5 6 7 8
7P1P3 P5 chaoschaos chaos chaoschaos
11P1P1chaoschaosP3 P3 chaoschaos
P: period.
Table 3. Power system parameters and per unit values.
Q 7 11
Coefficient (a) 0 0.0028
Coefficient (b) 0.001 0.0072
377 rad/sec
1 p.u
377 rad/sec
1 p.u
E
110/44 kv
1 p.u
110/44 kv
1 p.u
C
777 nf
0.82 p.u
777 nf
0.82 p.u
S 25 MVA 25 MVA
R
FLR
50 K
10 p.u
50 K
10 p.u
FFT of the power system behavior. It is shown that cha-
otic region is controlled by applying ferroresonance lim-
iter, and tendency to the chaos behavior also decreased.
By comparing these plots with
Figures 4(a) and (b), it
can be concluded that considering ferroresonance limiter
effect can cause ferroresonance drop out. By increasing
the degree of q, there is no significant change in the sys-
tem behavior.
Figure 8(a) shows the system overvoltage
in the case of q = 11.
Phase plan diagram that is shown in
Figure 8(a) indi-
cate the fundamental resonance of the power system with
period II oscillation. This case of the simulation is shown
effect of considering ferroresonance limiter on controlling
nonlinear phenomena in the power transformer. Ampli-
tude of the oscillations is 2.2 p.u, and chaotic ferroreso-
nance of the previous case is changed to the periodic
H. RADMANESH ET AL.
Copyright © 2011 SciRes. EPE
488
-2.5-2-1.5-1-0.500.511.522.5
-4
-3
-2
-1
0
1
2
3
4
Flux Linkage of Transformer
Voltage of Transformer
Phase Plan Diagram with q=7 including ferroresonance limiter effect
(a)
00.511.522.533.5
0
0.2
0.4
0.6
0.8
1
Frequency (Hz)
|V(f)|
Single-Sided Amplitude Spectrum of voltage on transformer with considering ferroresonance limiter effect
(b)
Figure 7. (a) Phase plan diagram with q = 7 considering
ferroresonance limiter effect. (b) Single-sided amplitude
spectrum considering ferroresonance limiter effect.
resonance by connecting ferroresonance limiter resistance
to the transformer.
Figure 9 is shown the period I oscillation, and ampli-
tude of these oscillations is decreased to 1.8 p.u, while in
the previous case, bifurcation diagram was shown chaotic
oscillation with high amplitude of the ferroresonance
overvoltage. By considering ferroresonance limiter, fer-
roresonance oscillations are successfully controlled, and
changed to the periodic behavior as shown in
Figure 9.
Figure 10 shows the power system overvoltage when
degree of core index “q” is 11. According to this plot, in
point (1), period III appears and in point (2) one jump is
occurred, and trajectory of the power system is suddenly
changed, and is gone to the 1.2 p.u value of the ferrore-
sonance overvoltage. After this point, oscillation is re-
mained with period one behavior, and in point (3) period 2
is appeared. Also, amplitude of the ferroresonance over-
voltage is decreased successfully and reached to 1.4 p.u.
By comparing the bifurcation diagram in
Figures 9 and
10 by Figures 4 and 5, it is concluded that considering
ferroresonance limiter can control the overvoltage.
Table
4
includes the set of cases which are considered for ana-
lyzing the power system circuit including ferroresonance
limiter resistance.
-2-1.5-1-0.500.511.52
-4
-3
-2
-1
0
1
2
3
4
Flux Linkage of Transformer
Voltage of Transformer
Phase Plan Diagram with q=11 considering ferroresonance limiter effect effect
(a)
00.511.522.533.5
0
0.2
0.4
0.6
0.8
1
Frequency (Hz)
|V(f)|
Single-Sided Amplitude Spectrum of voltage on transformer considering ferroresonance limiter effect
(b)
Figure 8. (a). Phase plan diagram with q = 11 considering
ferroresonance limiter effect. (b) Single-sided amplitude
spectrum considering ferroresonance limiter effect.
012345678
0
0.5
1
1.5
2
2.5
Input voltage(perunit)
Voltage of Transformer(perunit)
Bifurcation Diagram of Power Transformer with q=7 considering ferrresonance limter effect
Figure 9. Bifurcation diagram with q = 7 considering fer-
roresonance limiter effect.
6. Conclusions
In this paper, dynamic behavior of the power transformer
is studied. Power transformer is modeled with linear core
losses, and dynamical study clearly shows that chaotic
ferroresonance can occur due to the abnormal switching
action. Amplitude of these overvoltages is reached to 4
p.u. These nonlinear phenomena are very dangerous for
H. RADMANESH ET AL.
Copyright © 2011 SciRes. EPE
489
012345678
0
0.2
0.4
0.6
0.8
1
1.2
1.4
1.6
1.8
Input voltage(perunit)
Voltage of Transformer(perunit)
Bifurcation Diagram of Power Transformer with q=11 considering ferroresonance limiter effect
(1)
(2)
(3)
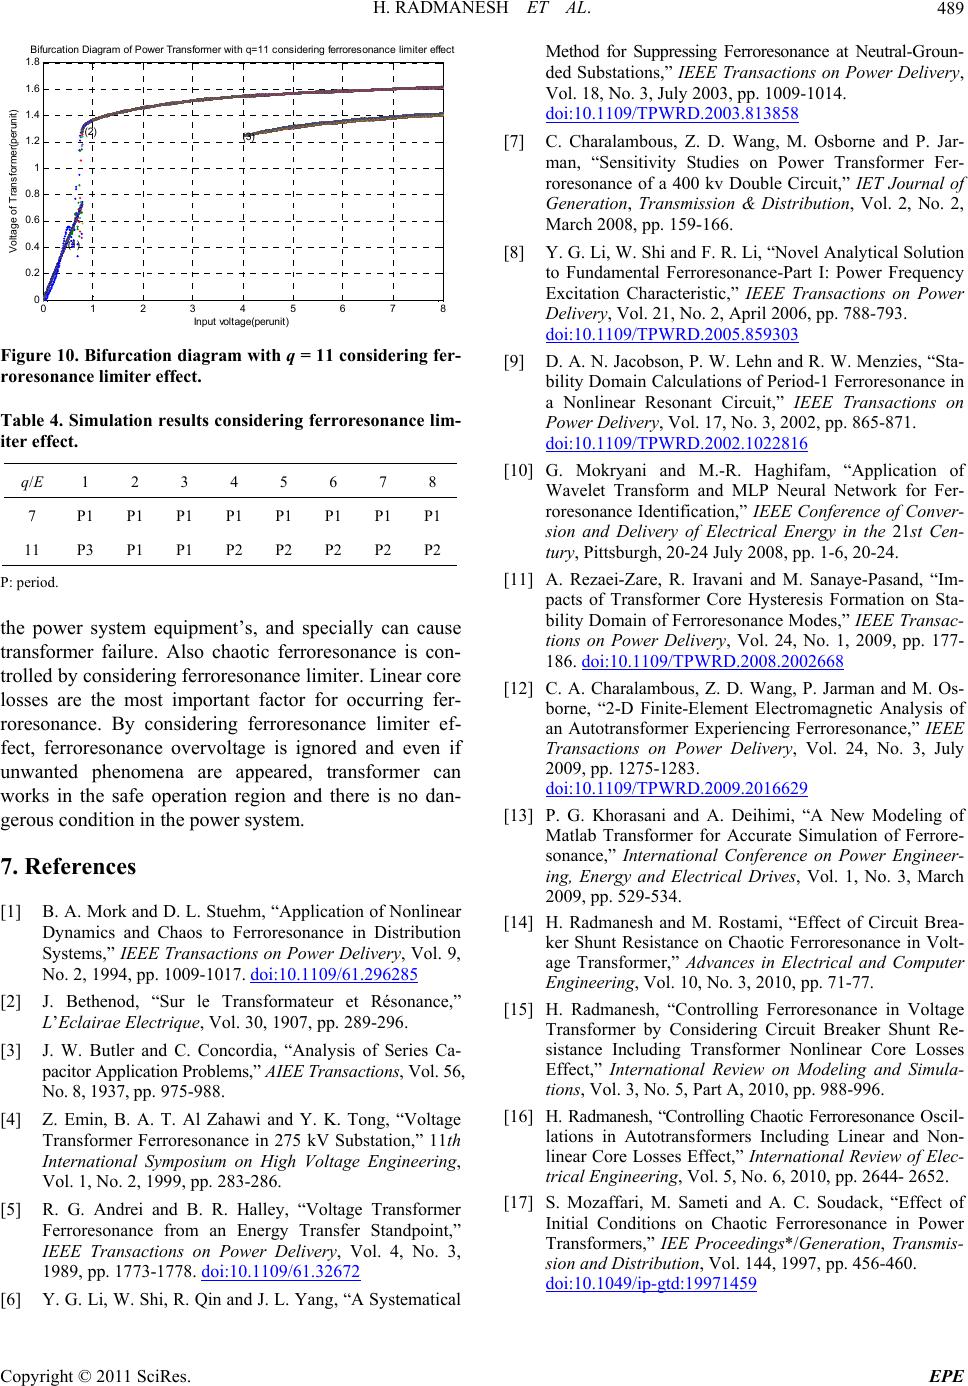
Figure 10. Bifurcation diagram with q = 11 considering fer-
roresonance limiter effect.
Table 4. Simulation results considering ferroresonance lim-
iter effect.
q/E 1 2 3 4 5 6 7 8
7 P1 P1 P1 P1 P1 P1 P1 P1
11 P3 P1 P1 P2 P2 P2 P2 P2
P: period.
the power system equipment’s, and specially can cause
transformer failure. Also chaotic ferroresonance is con-
trolled by considering ferroresonance limiter. Linear core
losses are the most important factor for occurring fer-
roresonance. By considering ferroresonance limiter ef-
fect, ferroresonance overvoltage is ignored and even if
unwanted phenomena are appeared, transformer can
works in the safe operation region and there is no dan-
gerous condition in the power system.
7. References
[1] B. A. Mork and D. L. Stuehm, “Application of Nonlinear
Dynamics and Chaos to Ferroresonance in Distribution
Systems,” IEEE Transactions on Power Delivery, Vol. 9,
No. 2, 1994, pp. 1009-1017. doi:10.1109/61.296285
[2] J. Bethenod, “Sur le Transformateur et Résonance,”
LEclairae Electrique, Vol. 30, 1907, pp. 289-296.
[3] J. W. Butler and C. Concordia, “Analysis of Series Ca-
pacitor Application Problems,” AIEE Transactions, Vol. 56,
No. 8, 1937, pp. 975-988.
[4] Z. Emin, B. A. T. Al Zahawi and Y. K. Tong, “Voltage
Transformer Ferroresonance in 275 kV Substation,” 11th
International Symposium on High Voltage Engineering,
Vol. 1, No. 2, 1999, pp. 283-286.
[5] R. G. Andrei and B. R. Halley, “Voltage Transformer
Ferroresonance from an Energy Transfer Standpoint,”
IEEE Transactions on Power Delivery, Vol. 4, No. 3,
1989, pp. 1773-1778. doi:10.1109/61.32672
[6] Y. G. Li, W. Shi, R. Qin and J. L. Yang, “A Systematical
Method for Suppressing Ferroresonance at Neutral-Groun-
ded Substations,” IEEE Transactions on Power Delivery,
Vol. 18, No. 3, July 2003, pp. 1009-1014.
doi:10.1109/TPWRD.2003.813858
[7] C. Charalambous, Z. D. Wang, M. Osborne and P. Jar-
man, “Sensitivity Studies on Power Transformer Fer-
roresonance of a 400 kv Double Circuit,” IET Journal of
Generation, Transmission & Distribution, Vol. 2, No. 2,
March 2008, pp. 159-166.
[8] Y. G. Li, W. Shi and F. R. Li, “Novel Analytical Solution
to Fundamental Ferroresonance-Part I: Power Frequency
Excitation Characteristic,” IEEE Transactions on Power
Delivery, Vol. 21, No. 2, April 2006, pp. 788-793.
doi:10.1109/TPWRD.2005.859303
[9] D. A. N. Jacobson, P. W. Lehn and R. W. Menzies, “Sta-
bility Domain Calculations of Period-1 Ferroresonance in
a Nonlinear Resonant Circuit,” IEEE Transactions on
Power Delivery, Vol. 17, No. 3, 2002, pp. 865-871.
doi:10.1109/TPWRD.2002.1022816
[10] G. Mokryani and M.-R. Haghifam, “Application of
Wavelet Transform and MLP Neural Network for Fer-
roresonance Identification,” IEEE Conference of Conver-
sion and Delivery of Electrical Energy in the 21st Cen-
tury, Pittsburgh, 20-24 July 2008, pp. 1-6, 20-24.
[11] A. Rezaei-Zare, R. Iravani and M. Sanaye-Pasand, “Im-
pacts of Transformer Core Hysteresis Formation on Sta-
bility Domain of Ferroresonance Modes,” IEEE Transac-
tions on Power Delivery, Vol. 24, No. 1, 2009, pp. 177-
186. doi:10.1109/TPWRD.2008.2002668
[12] C. A. Charalambous, Z. D. Wang, P. Jarman and M. Os-
borne, “2-D Finite-Element Electromagnetic Analysis of
an Autotransformer Experiencing Ferroresonance,” IEEE
Transactions on Power Delivery, Vol. 24, No. 3, July
2009, pp. 1275-1283.
doi:10.1109/TPWRD.2009.2016629
[13] P. G. Khorasani and A. Deihimi, “A New Modeling of
Matlab Transformer for Accurate Simulation of Ferrore-
sonance,” International Conference on Power Engineer-
ing, Energy and Electrical Drives, Vol. 1, No. 3, March
2009, pp. 529-534.
[14] H. Radmanesh and M. Rostami, “Effect of Circuit Brea-
ker Shunt Resistance on Chaotic Ferroresonance in Volt-
age Transformer,” Advances in Electrical and Computer
Engineering, Vol. 10, No. 3, 2010, pp. 71-77.
[15] H. Radmanesh, “Controlling Ferroresonance in Voltage
Transformer by Considering Circuit Breaker Shunt Re-
sistance Including Transformer Nonlinear Core Losses
Effect,” International Review on Modeling and Simula-
tions, Vol. 3, No. 5, Part A, 2010, pp. 988-996.
[16] H. Radmanesh, “Controlling Chaotic Ferroresonance Oscil-
lations in Autotransformers Including Linear and Non-
linear Core Losses Effect,” International Review of Elec-
trical Engineering, Vol. 5, No. 6, 2010, pp. 2644- 2652.
[17] S. Mozaffari, M. Sameti and A. C. Soudack, “Effect of
Initial Conditions on Chaotic Ferroresonance in Power
Transformers,” IEE Proceedings*/Generation, Transmis-
sion and Distribution, Vol. 144, 1997, pp. 456-460.
doi:10.1049/ip-gtd:19971459