Materials Sciences and Applications
Vol.06 No.09(2015), Article ID:60031,13 pages
10.4236/msa.2015.69085
Ion Beam Analysis and Electric Properties of GdBa2Cu3O7−δ Added with Nanosized Ferrites ZnFe2O4 and CoFe2O4
Hadi Basma1, Mohamad Roumié2, Ramadan Awad1,3*, Salem Marhaba1, Mohamad Albast2, Ali Abualy3
1Physics Department, Faculty of Science, Beirut Arab University (BAU), Beirut, Lebanon
2Accelerator Laboratory, Lebanese Atomic Energy Commission, CNRS, Beirut, Lebanon
3Physics Department, Faculty of Science, Alexandria University, Alexandria, Egypt
Email: *rawad64@yahoo.com
Copyright © 2015 by authors and Scientific Research Publishing Inc.
This work is licensed under the Creative Commons Attribution International License (CC BY).
http://creativecommons.org/licenses/by/4.0/


Received 14 August 2015; accepted 26 September 2015; published 29 September 2015
ABSTRACT
In this study, superconducting samples of type GdBa2Cu3O7−δ added with x wt% (0 ≤ x ≤ 0.4) nanoferrites ZnFe2O4 and CoFe2O4 were prepared by the conventional solid-state reaction technique. The prepared samples were characterized using X-ray powder diffraction (XRD) in order to determine the volume fraction and lattice parameters. The elemental contents of the prepared samples were determined using particle induced X-ray emission (PIXE). In addition, the oxygen-con- tent of these samples was obtained using non-Rutherford backscattering spectroscopy (RBS) at 3 MeV proton beam. It is found that the Oxygen-content of GdBa2Cu3O7−δ phase remains practically constant for low additions of both nanoferrites but it increases with high additions. The electrical resistivity of the prepared samples was measured by the conventional four-probe technique from room temperature down to the zero superconducting transition temperature (T0). An increase in the superconducting transition temperature Tc and the critical current density Jc is observed as x varies from 0.0 to 0.06 wt% of (ZnFe2O4)xGdBa2Cu3O7−δ, followed by a systematic decrease with increasing x. On the other hand, the Tc values for (CoFe2O4)xGdBa2Cu3O7−δ show a systematic decrease with x for both high and low additions while Jc is enhanced up to x = 0.01 wt% and decrease with further increase in x.
Keywords:
Gd-123, Nanoferrites, X-Ray Diffraction, PIXE and RBS, Critical Current Density

1. Introduction
Gd-123 is regarded as a promising material in the field of high temperature superconductors HTSCs. It possesses high superconducting transition temperature (around 90 K) [1] , high critical current density values at high magnetic fields [2] [3] , high ability to trap the magnetic field up to 2.0 T at 77 K [4] , relative low crystalline anisotropy and well developed pinning properties in the magnetic field [5] . However, Gd-123 showed a rapid decrease in its Jc due to the movement of the non-superconducting vortices, as both the temperature and the magnetic field increase. An effective way to overcome this problem is the enhancing of its flux pinning capabilities by nanoparticles addition [6] - [8] . This enhancement of the flux pinning consequently improves the critical current density [9] - [11] by causing a strong interaction between the flux line networks and the nanosized magnetic particles. This is possible if the size of these nanoparticles is higher than the coherence length ξ and lower than penetration depth λ. A wide variety of HTSCs were pinned [12] - [20] and most of the results showed that the superconducting parameters were improved at low amounts of nanosized additions. On the other hand, high amounts of addition reduced the formation of superconducting phase.
Ion beam analysis (IBA) including RBS and PIXE has many contributions in the field of the high temperature superconductors. PIXE technique has the advantage that the cross section for X-ray production is large and the background contribution is low. So, it is a highly sensitive method for the multi-elemental analysis and a large number of elements may be seen simultaneously. In addition, it may be a very useful complementary technique when combined with other ion beam methods. This high precision allows us to inspect any contamination during the preparation process. Furthermore, RBS is essential for fabrication of thin-film specimens, performing fundamental irradiation effect studies [21] . It is well known that the physical properties of high-temperature superconductors are strongly dependent on the elemental content, especially O-stoichiometry, and then RBS plays a very important role in sample investigation and studies. Many literatures have been conducted for studying PIXE and RBS for a large family of superconductors [22] - [25] . These studies found that the real stoichiometry, as wt%, obtained from PIXE spectra was nearly close to the starting values. Moreover, the oxygen-content, obtained by non-Rutherford backscattering using 3 MeV H+, was found to be very close to the nominal ones.
In this work, we investigate the effect of ZnFe2O4 and CoFe2O4 addition to the Gd-123 phase. The elemental composition is determined by PIXE and RBS techniques, while the phase analysis, volume fraction, theoretical density and porosity are determined from XRD analysis. The superconductivity investigation is conducted via electric resistivity and critical current density measurements. The variations of Tc and Jc with x for both nanoferrite additions are investigated and discussed.
2. Experimental Techniques
Nanosized ZnFe2O4 and CoFe2O4 powder were prepared by chemical Co-precipitation method as discussed in previous work [26] [27] . Superconducting samples of type (ZnFe2O4)xGdBa2Cu3O7−δ and (CoFe2O4)xGdBa2Cu3O7−δ, 0.0 ≤ x ≤ 0.4 wt%, were prepared by the conventional solid-state reaction technique. First, the starting materials Gd2O3, BaCO3 and CuO (purity ≥ 99.9) were crushed in an agate mortar and were sifted using a 125 μm sieve to get a homogeneous mixture. Then, the powder was subjected to calcinations process in air at 840˚C and 880˚C for 24 h each. The resultant powder was ground and sifted, and x wt% of nanosized ZnFe2O4 or CoFe2O4 were added to the resulting powder. The powder was mixed for one hour to ensure the homogenous distribution of nanoferrite inside the sample. Subsequently, the mixed powder was pressed in a disc form (1.5 cm in diameter and about 0.3 cm in thickness). Afterwards, discs were sintered in air at 930˚C with a heating rate of 4˚C/min, and held at this temperature for 24 h. Then, the samples were cooled by a rate of 1˚C/min down to 450˚C and kept at this temperature for 10 h under oxygen flow to control the oxygen-content of the final compounds.
The prepared samples were characterized by XRD using Bruker D8 advance powder diffractometer with Cu-Kα radiation (λ = 1.54056 Å) in the range 4ᵒ ≤ 2θ ≤ 70ᵒ. The grain morphology of the samples was identified using Jeol scanning electron microscope JSM-5300, operated at 25 - 30 kV, with a resolution power of 4 nm. The relative volume fractions of Gd-123 and BaCuO2 phases are estimated by comparing the intensities of the whole pattern [28] , according to the relations
 (1)
(1)
 (2)
(2)
where  is the peak intensity of the present phases above the baseline.
The bulk densities (r) of (ZnFe2O4)xGdBa2Cu3O7−δ and (CoFe2O4)xGdBa2Cu3O7−δ samples were determined by the immersion method using Archimedes principle with toluene as a solvent. By measuring the mass of the sample and the mass of the displaced liquid, with density ρtoulene, the density of the sample can be determined using the equation:
 . (3)
. (3)
The theoretical density  and the porosity P are given by:
 , (4)
, (4)
 , (5)
, (5)
where N, M, NA and V represent the number of atoms per unit cell = 1, molecular weight of the sample, Avogadro’s number and the volume of the orthorhombic unit cell respectively and is given by:  (where a, b and c represent the lattice parameters).
The elemental composition of the samples was measured by the conventional vacuum PIXE. The 1.7 MV tandem accelerator of the Lebanese Atomic Energy Commission [29] was used to deliver 3 MeV proton beam on the samples with 1 μC of fluence. For ion beam analysis, a mass of 0.3 g of each sample was grinded very well to ensure homogeneity and hence a thick target pellet of approximate dimensions 1 × 1 × 0.2 cm3 was formed. The target chamber contains Silicon drifted detector (SDD) formed of high purity silicon with a very low leakage current leading to high energy resolutions (down to 123 eV for Mn Kα wavelength). The SDD allows the detection of elements with Z > 10. In order to obtain one spectrum for all the elements which compose the sample, an Aluminum filter of 100 μm thickness was placed in front of SDD X-ray absorber. The real stoichiometric amount of the elements can be calculated using the following equation:
 , (6)
, (6)
where  is the real element-content as wt%, MrT is the total molecular weight and Mrx is the molecular weight of the element. Simultaneously, elastic backscattering measurements were taken under normal incident beam. A partially depleted PIPS (Passivity Implanted Planar Silicon) detector from Canberra, with 14 keV energy resolutions and 25 mm2 active areas, detected the backscattered particles of the 3 MeV proton beam, at a scattering angle θ of 165˚ and solid angle of 5.45 × 10⁻³ sr.
The electrical resistivity of the prepared samples was measured by the conventional four-probe technique from room temperature down to the zero superconducting transition temperature (T0) via closed cryogenic refrigeration system employing helium gas as a working medium. The samples had the shape of parallelepipeds of approximate dimensions 15 × 2 × 2 mm3, and the connections of the copper leads with the sample were made using a conductive silver paint. The temperature of the sample was monitored by a Chromel versus Fe-Au thermocouple and stabilized with the aid of a temperature controller to within ±0.1 K. A typical excitation of 1 mA was used to avoid heating effects on the samples. The potential drop across the sample was measured using a Keithley-181 digital nano-voltmeter. The voltage was determined by taking the average of the values measured with the normal and the reverse directions of applied current to eliminate the thermo-electric voltages of the junction leads. The transport critical current density was measured by the conventional four probe technique at 77 K using liquid nitrogen flow.
3. Results and Discussions
The XRD patterns of (ZnFe2O4)xGdBa2Cu3O7−δ and (CoFe2O4)xGdBa2Cu3O7−δ (x = 0.00, 0.01, 0.06 and 0.40 wt%) are shown in Figure 1. All of the diffraction patterns peaks are indexed by the main orthorhombic phase with a space group Pmmm. An insignificant peak belonging to the non-superconducting phase BaCuO2 appears at 2θ = 30˚ [30] . The values of the lattice parameters a, b and c are calculated and are listed in Table 1 for different values of x. The lattice parameters a, b and c do not show systematic variation with respect to the pure sample. These results indicate clearly that lattice parameters a, b, and c are not affected by nanoferrite addition which implies that any substitution by the nanoferrites does not occur. So the nanoferrites do not enter inside the crystal sites and sit only at the grains boundaries. This means that nanoferrites addition serves as interface between
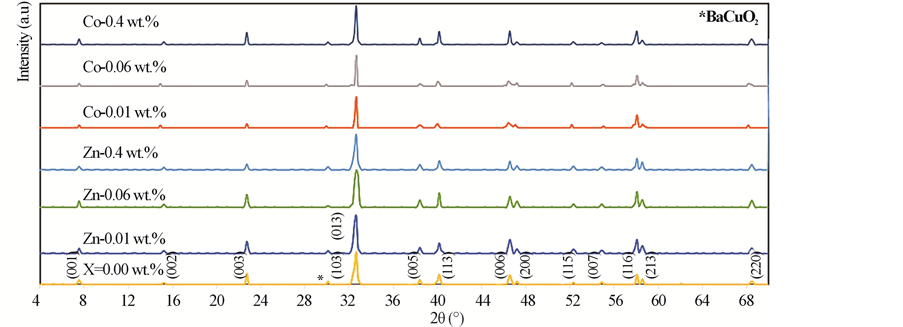
Figure 1. X-ray power diffraction pattern for GdBa2Cu3O7−δ, (ZnFe2O4)xGdBa2Cu3O7−δ (x = 0.01, x = 0.06 and x = 0.40 wt%) and (CoFe2O4)xGdBa2Cu3O7−δ (x = 0.01, x = 0.06 and x = 0.4 wt%).

Table 1. The volume fraction percentage, lattice parameters, experimental density, and porosity of GdBa2Cu3O7−δ added with x wt% nanoferrites ZnFe2O4 and CoFe2O4 where x = 0.0, 0.01, 0.02, 0.04, 0.06, 0.10, 0.20 and 0.40 wt%.
the superconducting matrix and does not affect the structure of HTSCs. Similar results were observed by Awad [31] for studying the effect of MgO nanoparticles addition into (Cu0.25Tl0.75-1234) phase, and by Roumié et al. [13] for studying the effect of Fe2O3 nanoparticles addition into the Bi1.8Pb0.4Sr2Ca2Cu3O10+δ phase. The experimental densities, and porosity of (ZnFe2O4)xGdBa2Cu3O7−δ and (CoFe2O4)xGdBa2Cu3O7−δ (0.00 ≤ x ≤ 0.40 wt%) are listed in Table 1. It is clear that P increases up to x = 0.06 wt% and then it decreases with further increase in x for (ZnFe2O4)xGdBa2Cu3O7−δ phase. Whereas P increases for 0.00 ≤ x ≤ 0.40 wt% for (CoFe2O4)xGdBa2Cu3O7−δ phase.
The porosity of both phases varied from 19% to 30%, confirming the porous nature of ceramic materials. The relative volume fractions were calculated using all peak intensities of Gd-123 and BaCuO2 phases according to Equations (1) and (2) and their values with x of both additions are listed in Table 1. It is obvious that the relative volume fraction of the main phase, Gd-123, increases with increasing nanosized ZnFe2O4 addition up to 0.06 wt% and then it decreases with further increase in x. On the other hand, the increase in the relative volume fraction of the impurity phase BaCuO2 is observed for x < 0.06 wt%. The decrease of the relative volume fraction suggested that the presence of nanoparticles can affect the viscosity of the transient liquid formed at the reaction temperature and its homogeneity which in turn affect the formation rate of the Gd-123 phase. Also, the ability of nanosized ZnFe2O4 particles to prevent, to some extent, the spatial phase growth may be another reason. The enhancement rate of the relative volume fraction of Gd-123 added with nanosized ZnFe2O4 is 1.06%, while the retardation rate is 1.76%. Table 1 also shows that nanosized CoFe2O4 addition increases the relative volume fraction of the main phase from 97.36% to 98.33% as x varies from 0.0 to 0.01 wt% and then it decreases with further increase in x, but its value still greater than that for the free sample up to x = 0.06 wt%. This means that higher concentrations of nanosized CoFe2O4 (<0.06 wt%) have a significant role in changing the reaction rate which slightly retards the Gd-123 phase formation. This is attributed to the ability of the nanosized CoFe2O4 to prevent the spatial phase growth. The enhancement rate of relative volume fraction of Gd-123 phase added with nanosized CoFe2O4 is 0.99%, while the retardation rate is 2.12%.
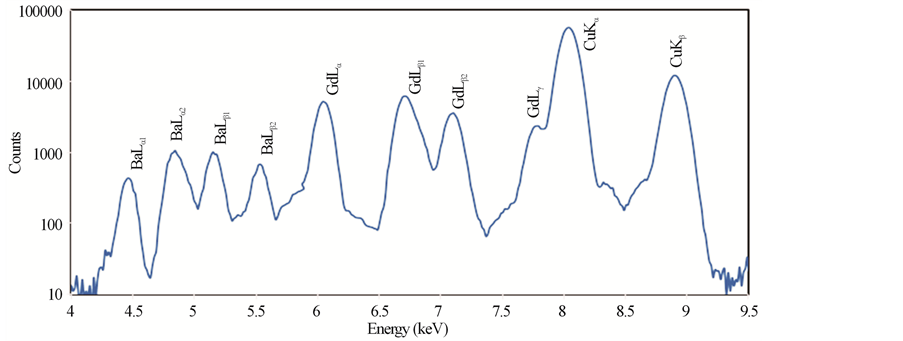
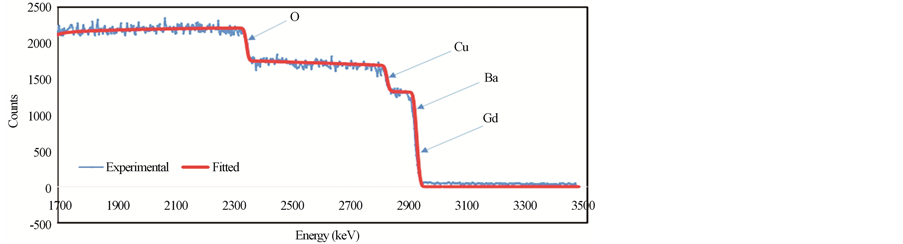
Typical PIXE spectra of the samples GdBa2Cu3O7−δ, (ZnFe2O4)0.1 GdBa2Cu3O7−δ and (CoFe2O4)0.1 GdBa2- Cu3O7−δ are shown in Figures 2(a)-(c), respectively. The elements Cu, Zn and Fe are identified by the K X rays lines, whereas Gd and Ba are identified by L X-rays lines. No contaminations are observed in the spectra, which verify the high purity of all investigated samples. Co was not detected in the spectra, this is probably due to the overlapping of its K-X ray lines (Kα = 6.924 keV) with the L-X-ray lines of heavier and much abundant Gd (Lβ1 = 7.102 keV). The real elements-content is calculated according to Equation (6) and listed in Table 2 for (ZnFe2O4)xGdBa2Cu3O7−δ and (CoFe2O4)xGdBa2Cu3O7−δ.
It is clear that the stoichiometric ratio of the different elements are nearly close to the stoichiometric starting compositions. Taking into account the statistical and fit errors, the uncertainties of the PIXE measurements are: ±3% for Gd, ±5% for Ba, ±8% for Cu, +10% for Zn and Fe. Combining these errors, the indirect PIXE determination of O-stoichiometry by completing the stoichiometry to 100 wt% of different constituents that appeared in PIXE spectra, is inaccurate and differs from the expected value (as shown in Table 2). The Ba stoichiometric
Table 2. The real elemental-content of Gd, Ba, Cu, Zn, Fe and Co obtained from PIXE technique for (ZnFe2O4)xGdBa2Cu3O7−δ and (CoFe2O4)xGdBa2Cu3O7−δ systems with x = 0.0, 0.01, 0.02, 0.04, 006, 0.10, 0.20 and 0.40 wt%.
 (a)
(a)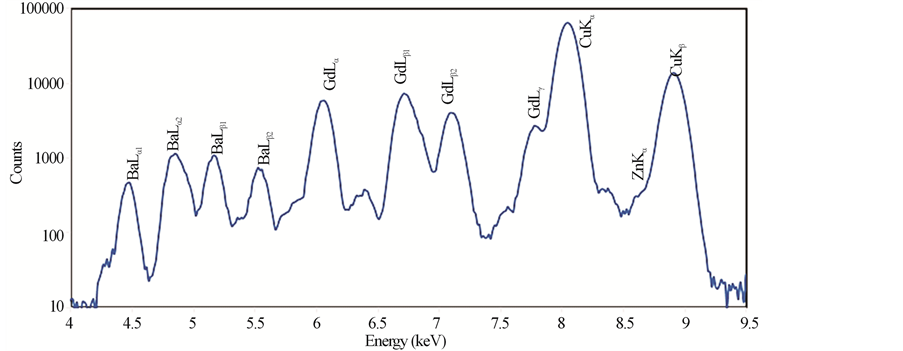 (b)
(b)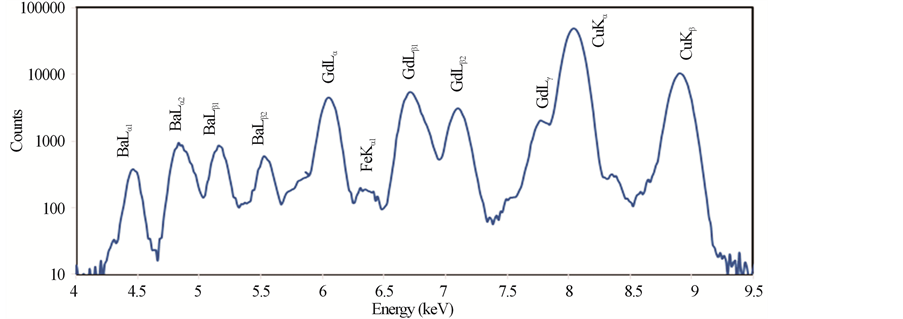 (c)
(c)
Figure 2. PIXE spectra for (a) GdBa2Cu3O7−δ, (b) (ZnFe2O4)0.1GdBa2Cu3O7−δ and (c) (CoFe2O4)0.1 GdBa2Cu3O7−δ.
ratios are slightly higher than their nominal values resulting from the formation of BaCuO2 as impurities. These results are consistent with those obtained from XRD measurements. The error percentages of Zn and Fe elements are higher than that of the rest elements. This is attributed to the superposition of Zn and Fe peaks with Cu peaks. On the other side, the stoichiometric ratios of Zn and Fe show a systematic and continuous increase up to x = 0.1 wt% as shown in Figure 3.
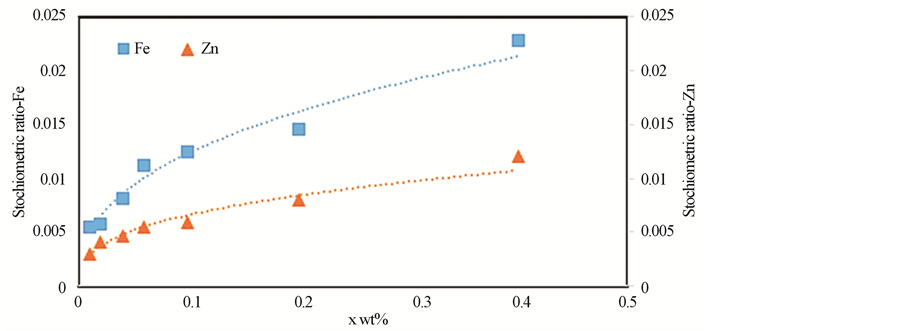
Figure 3. The stoichiometric amounts of Zn and Fe for (ZnFe2O4)xGdBa2Cu3O7−δ with (0.00 ≤ x ≤ 0.40 wt%).
Figures 4(a)-(c) show the RBS spectra of the samples GdBa2Cu3O7−δ, (ZnFe2O4)0.1 GdBa2Cu3O7−δ and (CoFe2O4)0.1 GdBa2Cu3O7−δ, respectively using 3 MeV proton elastic backscattering by fitting a non-Rutherford backscattering cross-section for O [22] in the SIMNRA simulations. The actual O-content, as wt% and stoichiometric ratios, for all samples, was determined and listed in Table 3. It was found that the actual O-content is very close to the starting nominal one. The deviation between PIXE and RBS results for O as wt% is also listed in Table 3. It is clear that the oxygen content determined from RBS measurements is closer to the nominal values than that determined from PIXE measurements. This observation is not surprising since RBS is more accurate in determining the O-content. However, the deviation between PIXE and RBS results is very acceptable (around 4%). For both additions, the oxygen content remains constant up to x = 0.1 wt% and then increases slightly with x. This is consistent with the invariance of the lattice parameters determined from XRD measurements.
The temperature dependence of the electrical resistivity for GdBa2Cu3O7−δ, (ZnFe2O4)xGdBa2Cu3O7−δ (x = 0.00, 0.01, 0.06 and 0.40 wt%) and for (CoFe2O4)xGdBa2Cu3O7−δ (x = 0.00, 0.06 and 0.40 wt%) are shown in Figure 5. All samples behave like a metal in the normal state followed by a superconducting transition at Tc, and zero resistivity at temperature T0. The normal metallic-like behavior above Tc can be interpreted by the liquid model that provides a natural explanation of anomalous features of transport properties in several high-temper- ature superconductors. It reflects the spin charge separation in CuO2-planes that results in the longitudinal transport relaxation rate 1/τ ~ T [32] . A small curvature in the electrical resistivity appears above the superconducting transition temperature that characterizes the superconducting Cooper-pairs fluctuations [33] or the opening of the spin-gap in high-temperature superconductivity [34] [35] due to magnetic impurities. The electrical resistivity data of the prepared samples are well fitted, in the temperature range from 300 K down to 2 Tc, according to equation:
 , (7)
, (7)
The room temperature electrical resistivity , residual resistivity
  and resistivity temperature coefficient
  for different x wt% are listed in Table 4. It is well known that
  is an indicator for the disorder of cations and Oxygen vacancies which increase the number of scattering centers [36] and
  is an indicator for the purity of the sample. It is clear that both
  and
and  of (ZnFe2O4)xGdBa2Cu3O7−δ decrease with the increase of nanosized ZnFe2O4 addition from x = 0.0 wt% to x = 0.06 wt% and then increase for x > 0.06 wt%. On the other side,
  and
and  of (CoFe2O4)xGdBa2Cu3O7−δ slightly decrease as x increase from 0.0 to 0.01 wt% and then increase with further increase in x. The decrease in
  and
and  is an indication to the reduction of the grain boundaries and defects and the improvement in the quality and purity of the samples. Whereas, the increase of
  and
and  may strongly related to the impurities and scattering of grain boundaries. These results are consistent with those obtained through XRD and relative volume fraction percentage calculations. It is clear that
  slightly changes with x for (ZnFe2O4)xGdBa2Cu3O7−δ and (CoFe2O4)xGdBa2Cu3O7−δ. So, nanosized ZnFe2O4 and CoFe2O4 do not affect the charge carriers-concentrations because the nanosized ZnFe2O4 and
 (a)
(a)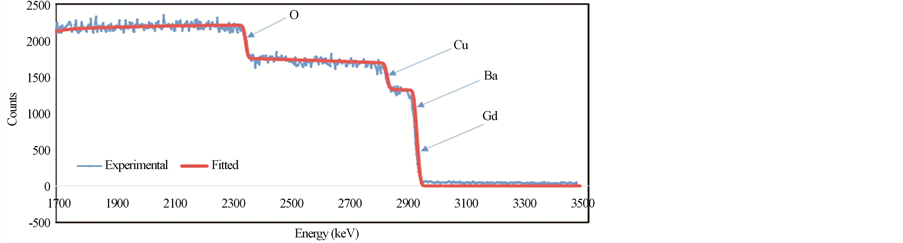 (b)
(b)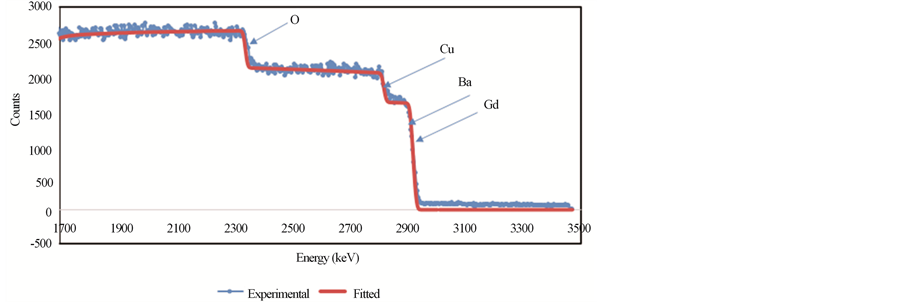 (c)
(c)
Figure 4. RBS spectra for (a) GdBa2Cu3O7−δ, (b) (ZnFe2O4)0.1GdBa2Cu3O7−δ and (c) (CoFe2O4)0.1GdBa2Cu3O7−δ.
Table 3. The actual O-content, as wt% obtained from PIXE and stoichiometric ratios obtained from RBS, with the deviation (in %) of the oxygen content between PIXE and RBS for (ZnFe2O4)xGdBa2Cu3O7−δ and (CoFe2O4)xGdBa2Cu3O7−δ systems with x = 0.0, 0.01, 0.02, 0.04, 0.06, 0.10, 0.20 and 0.40 wt%.
Table 4. The room temperature electrical resistivity , residual resistivity
  and resistivity temperature coefficient
  for (ZnFe2O4)xGdBa2Cu3O7−δ and (CoFe2O4)xGdBa2Cu3O7−δ systems with 0.00 ≤ x ≤ 0.40 wt%.
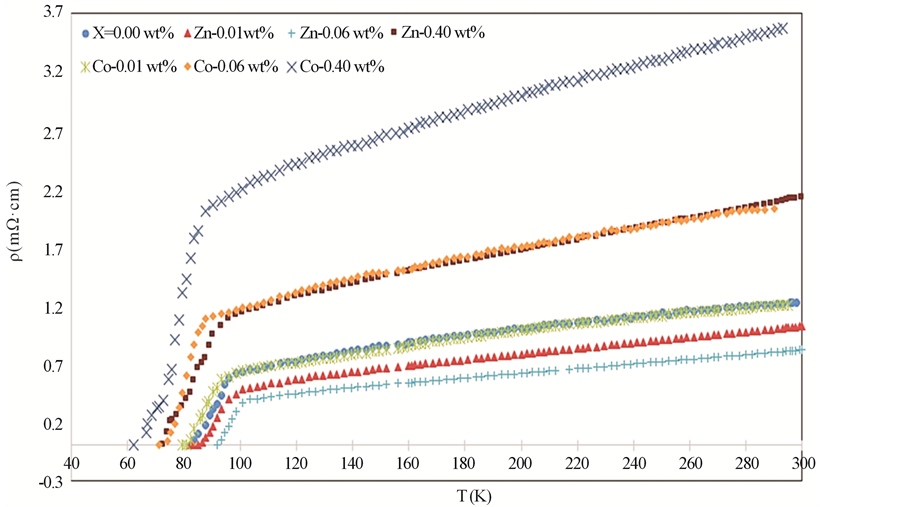
Figure 5. Electrical resistivity with temperature for GdBa2Cu3O7−δ, (ZnFe2O4)x GdBa2Cu3O7−δ and (CoFe2O4)xGdBa2Cu3O7−δ (x = 0.01, x = 0.06 and x = 0.4 wt%).
CoFe2O4 do not enter the crystal structure of Gd-123 phase. The increase in  with x > 0.06 and 0.02 wt% for (ZnFe2O4)xGdBa2Cu3O7−δ and (CoFe2O4)xGdBa2Cu3O7−δ, respectively could be due to the unsuspected temperature-dependent scattering (magnetic impurities scattering) contribution by nanosized ZnFe2O4 and CoFe2O4 [37] .
The superconducting transition temperature Tc, which displays the superconducting transition within the grains, is determined as the temperature corresponding to the crest in dρ/dT curve [38] . In addition, the values of Tc for different nanosized ZnFe2O4 and CoFe2O4 additions are shown in Figure 6. It is obvious that for (ZnFe2O4)xGdBa2Cu3O7−δ, Tc increases from 91.77 K to 97.64 K as x varies from 0.0 to 0.06 wt%, then it decreases for x > 0.06 wt%. The increases of Tc with x can be explained due to the increase in the volume fraction of Gd-123 and the decrease of porosity up to x = 0.06 wt%. As a matter of fact, the suppression of Tc is most likely due to the trapping of mobile free carriers, pair-breaking due to spin interaction [39] [40] and the non-uniform distribution of nanoparticles at grain-boundaries of the host Gd-123 superconductor which increases the grain boundaries resistance. The enhancement rate of Tc for Gd-123 phase added with nanosized ZnFe2O4 is 6.5%, while the retardation rate is 6.8%. In the other hand, Tc decreases from 91.77 K to 78 K for (CoFe2O4)xGdBa2Cu3O7−δ as x increases from 0.0 to 0.4 wt%. The suppression of Tc is most likely due the progressive decoupling of the superconducting grains with microscopic in homogeneities such as secondary phases, cracks, and grain boundaries that are non-uniformly filled with the nanoparticles [27] . This behavior can also be interpreted as a result of the ferromagnetism role of nanosized CoFe2O4 which would cancel the supercurrents and destroy the long-range coupling of Cu ion in the CuO layer. The retardation rate of Tc for Gd-123 phase added with nanosized CoFe2O4 is 15%.
The transport critical current density Jc, for all samples, was measured using a criterion of 1 mV/cm. The variation of Jc for (ZnFe2O4)xGdBa2Cu3O7−δ and (CoFe2O4)xGdBa2Cu3O7−δ with x wt% is shown in Figure 7. It is
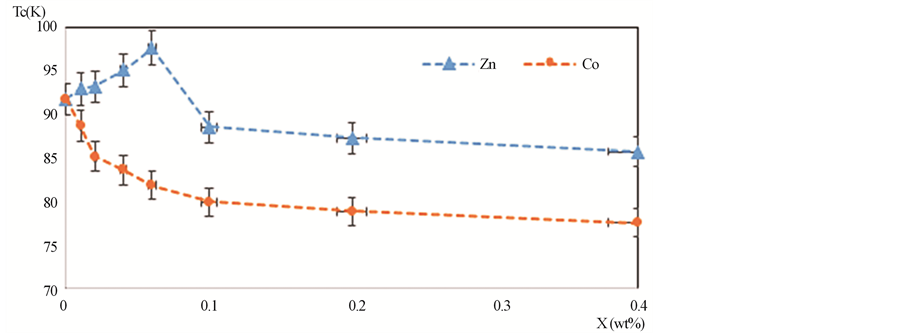
Figure 6. Superconducting transition temperature Tc versus versus x wt% for (ZnFe2O4)x GdBa2Cu3O7−δ and (CoFe2O4)xGdBa2Cu3O7−δ.
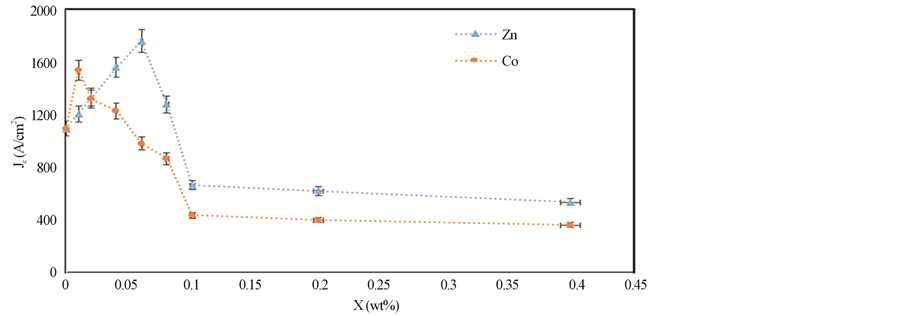
Figure 7. Variation of Jc with x for (ZnFe2O4)xGdBa2Cu3O7−δ and (CoFe2O4)xGdBa2Cu3O7−δ with 0.00 ≤ x ≤ 0.40.
clear that, for (ZnFe2O4)xGdBa2Cu3O7−δ, Jc increases as x increases from 0.0 to 0.06 wt% and then it decreases with further increases in x. Whereas, Jc is enhanced with x up to 0.01 wt% for (CoFe2O4)xGdBa2Cu3O7−δ and then it decreases with further increase in x, but its value remain greater than that for the free sample until x = 0.04 wt%. The increase in Jc may be attributed to the increase in the volume fractions of Gd-123 phase or the diffusion of nanosized ZnFe2O4 and CoFe2O4 in the added samples over the pore surfaces, grain boundaries and twin boundaries. This can increase flux pinning and coupling between grains, leading to increase the critical current density. While, the decrease in Jc is attributed to the suppression of volume fractions of Gd-123 phase. Another probable reason is the large agglomerations between the grains and not through the boundaries and voids due to the excessive addition of nanosized ZnFe2O4 and CoFe2O4 nanoferrites which deteriorate the intergranular critical current density [41] . The samples added with 0.06 wt% nanosized ZnFe2O4 and 0.01 wt% nanosized CoFe2O4, increase Jc by 60.6% and 40.5%, respectively. Therefore the addition of nanosized ZnFe2O4 is more significant than that of nanosized CoFe2O4 in improving the flux pinning and critical current density of the prepared samples. This result could be related to the ferromagnetic properties of nanosized CoFe2O4 which contributes to the breaking of Cooper pairs representing the supercurrent [42] .
4. Conclusion
The PIXE analysis for (ZnFe2O4)xGdBa2Cu3O7−δ and (CoFe2O4)xGdBa2Cu3O7−δ superconducting phases, with 0.0 ≤ x ≤ 0.4 wt%, has successfully determined the actual contents of Gd, Ba and Cu which are very close to the nominal contents. Zn and Fe showed a systematic increase with x, while Co was not detected due to the overlapping of its KX-rays with the LX-rays of Gd. On the other hand, the PIXE technique has not successfully determined the O-stoichiometry. The O-stoichiometry obtained by non-Rutherford backscattering using 3 MeV proton beam was very close to the nominal values and its value increased for high additions. Tc increased with increasing ZnFe2O4 content up to x = 0.06 wt% and then decreased for further increase in x. This behavior indicates that the optimal ZnFe2O4 addition is x = 0.06 wt% leading to a best enhancement in Tc and Jc attributed to the enhancement of the volume fraction of Gd-123 phase and the reduction in the voids between grains. The addition of CoFe2O4 caused a deterioration in Tc and Jc for x > 0.01 wt% resulting from the ferromagnetic nature of CoFe2O4 which may destroy the long-range coupling of Cu ion in the CuO layer.
Acknowledgments
This work was performed in the Superconductivity and Metallic-glass lab, Physics Department, Faculty of Science, Alexandria University, Alexandria, Egypt with cooperation with the accelerator Laboratory, Lebanese Atomic Energy Commission, CNRS, Beirut, Lebanon.
Cite this paper
Hadi Basma,Salem Marhaba,Mohamad Roumié,Mohamad Albast,Ramadan Awad,Ali Abualy, (2015) Ion Beam Analysis and Electric Properties of GdBa2Cu3O7-δ Added with Nanosized Ferrites ZnFe2O4 and CoFe2O4. Materials Sciences and Applications,06,828-840. doi: 10.4236/msa.2015.69085
References
- 1. Reddy, P., Shekar, S. and Somaiah, K. (1994) Elasticity Studies of RE-Ba-Cu-O High-Tc Superconductors. Journal of Materials Letters, 21, 21-29.
http://dx.doi.org/10.1016/0167-577X(94)90119-8 - 2. Zhang, Y.F., Izumi, M., Li, Y.J., Murakami, M., Gao, T., Liu, Y.S. and Li, P.L. (2011) Enhanced JC in Air-Processed GdBa2Cu3O7δ Superconductor Bulk Grown by the Additions of Nano-Particles. Journal of Physics C, 471, 840-842.
http://dx.doi.org/10.1016/j.physc.2011.05.069 - 3. Sakai, N., Lee, S., Chikumoto, N., Izumi, T. and Tanabe, K. (2011) Delamination Behavior of Gd123 Coated Conductor Fabricated by PLD. Journal of Physics C, 471, 1075-1079.
http://dx.doi.org/10.1016/j.physc.2011.05.127 - 4. Nariki, S., Sakai, N. and Murakami, M. (2000) Fabrication of Large Melt-Textured Gd-Ba-Cu-O Superconductor with Ag Addition. Physica C, 341-348, 2409-2412.
http://dx.doi.org/10.1016/S0921-4534(00)01292-2 - 5. Harada, T. and Yoshida, K. (2002) The Effects of Pr-Doping on the Critical Current Density in YBa2Cu3O7δ. Journal of Physics C, 383, 48-54.
http://dx.doi.org/10.1016/S0921-4534(02)01261-3 - 6. Bardeen, J. and Stephen, M. (1965) Theory of the Motion of Vortices in Superconductors. Journal of Physical Review, 140, A1197.
http://dx.doi.org/10.1103/PhysRev.140.A1197 - 7. Dou, S.X., Wang, X.L., Guo, Y.C., Hu, Q.Y., Mikheenko, P., Horvat, J., Ionescu, M. and Liu, H.K. (1997) Introduction of Pinning Centres into Bi-(Pb)-Sr-Ca-Cu-O Superconductors. Journal of Superconductor Science and Technology, 10A, 52.
http://dx.doi.org/10.1088/0953-2048/10/7A/006 - 8. Abdeen, W., Mohammed, N.H., Awad, R., Mahmoud, S.A. and Hasebbo, M. (2013) Influence of Nano-Ag Addition on Phase Formation and Electrical Properties of (Cu0.5Tl0.5)-1223 Superconducting Phase. Journal of Superconductivity and Novel Magnetism, 26, 623-631.
http://dx.doi.org/10.1007/s10948-012-1803-y - 9. Xu, C., Hu, A., Ichihara, M., Sakai, N., Hirabayashi, I. and Izumi, M. (2007) Enhanced Flux Pinning of Air-Processed Gd-123 by Doping ZrO2 Nanoparticles. Physica C, 460-462, 1341-1342.
http://dx.doi.org/10.1016/j.physc.2007.04.168 - 10. Xu, C., Hu, A., Sakai, N., Hirabayashi, I. and Izumi, M. (2006) Flux Pinning Properties and Superconductivity of Gd-123 Superconductor with Addition of Nanosized SnO2/ZrO2 Particles. Physica C, 445-448, 357-360.
http://dx.doi.org/10.1016/j.physc.2006.04.082 - 11. Xu, Y., Hu, A., Xu, C., Sakai, N., Hirabayashi, I. and Izumi, M. (2008) Effect of ZrO2 and ZnO Nanoparticles Inclusions on Superconductive Properties of the Melt-Processed GdBa2Cu3O7δ Bulk Superconductor. Physica C: Superconductivity, 468, 1363-1365.
http://dx.doi.org/10.1016/j.physc.2008.05.056 - 12. Kong, W. and Abd-Shukor, R. (2010) Enhanced Electrical Transport Properties of Nano NiFe2O4-Added (Bi1.6Pb0.4)- Sr2Ca2Cu3O10 Superconductor. Journal of Superconductivity and Novel Magnetism, 23, 257-263.
http://dx.doi.org/10.1007/s10948-009-0524-3 - 13. Roumié, M., Marhaba, S., Awad, R., Kork, M., Hassan, I. and Mawassi, R. (2014) Effect of Fe2O3 Nano-Oxide Addition on the Superconducting Properties of the (Bi,Pb)-2223 Phase. Journal of Superconductivity and Novel Magnetism, 27, 143-153.
http://dx.doi.org/10.1007/s10948-013-2288-z - 14. Lei, L., Zhao, G., Xu, H., Wu, N. and Chen, Y. (2011) Influences of Y2O3 Nanoparticle Additions on the Microstructure and Superconductivity of YBCO Films Derived from Low-Fluorine Solution. Materials Chemistry and Physics, 127, 91-94.
http://dx.doi.org/10.1016/j.matchemphys.2011.01.030 - 15. Elokr, M.M., Awad, R., El-Ghany, A.A., Shama, A.A. and El-wanis, A.A. (2011) Effect of Nano-Sized ZnO on the Physical Properties of (Cu0.5Tl0.25Pb0.25)Ba2Ca2Cu3O10δ. Journal of Superconductivity and Novel Magnetism, 24, 1345-1352.
http://dx.doi.org/10.1007/s10948-010-0831-8 - 16. Abou-Aly, A.I., Abdel Gawad, M.M.H., Awad, R. and G-Eldeen, I. (2011) Improving the Physical Properties of (Bi, Pb)-2223 Phase by SnO2 Nano-Particles Addition. Journal of Superconductivity and Novel Magnetism, 24, 2077-2084.
http://dx.doi.org/10.1007/s10948-011-1171-z - 17. Abou-Aly, A.I., Mohammed, N.H., Awad, R., Motaweh, H.A. and El-Said Bakeer, D. (2012) Determination of Superconducting Parameters of GdBa2Cu3O7δ Added with Nanosized Ferrite CoFe2O4 from Excess Conductivity Analysis. Journal of Superconductivity and Novel Magnetism, 25, 2281-2290.
http://dx.doi.org/10.1007/s10948-012-1621-2 - 18. Moutalbi, N., Ouerghi, A., Djurado, E., Noudem, J.G. and M’chirgui, A. (2011) Vortex Pinning in Bulk-Processed Y-Ba-Cu-O with ZrO2 Nano-Particles: Optimum Pinning Center Size. Physica C, 471, 97-103.
http://dx.doi.org/10.1016/j.physc.2010.12.012 - 19. Yildirim, G. (2013) Beginning Point of Metal to Insulator Transition for Bi-2223 Superconducting Matrix Doped with Eu Nanoparticles. Journal of Alloys and Compounds, 578, 526-535.
http://dx.doi.org/10.1016/j.jallcom.2013.07.016 - 20. Khan, N.A. and Aziz, S. (2012) Single and Multi-Walled Carbon Nanotubes Doped (Cu0.5Tl0.5)Ba2Ca2Cu3O10δ Superconductors. Journal of Alloys and Compounds, 538, 183-188.
http://dx.doi.org/10.1016/j.jallcom.2012.05.074 - 21. Rehn, L.E. (1992) Ion Beams in High-Temperature Superconductivity Research. Nuclear Instruments and Methods in Physics Research Section B, 64, 161-168.
http://dx.doi.org/10.1016/0168-583X(92)95458-4 - 22. Mohammed, N.H., Roumié, M., Motaweh, H.A., Awad, R., El-Said Bakeer, D. and Nsouli, B. (2010) Determination of Stoichiometry and Superconducting Properties of Tl-1234 and (Cu0.25Tl0.75)-1234 Phases Substituted by Erbium. Journal of Superconductivity and Novel Magnetism, 23, 465-474.
http://dx.doi.org/10.1007/s10948-009-0599-x - 23. Abou-Aly, A.I., Mohammed, N.H., Roumié, M., El Khatib, A., Awad, R. and Nour El Dein, S.A. (2009) Ion Beam Analysis and Physical Properties Measurements of (Tl0.8Hg0.2x Sbx)Ba2Ca2Cu3O9δ. Journal of Superconductivity and Novel Magnetism, 22, 495-504.
http://dx.doi.org/10.1007/s10948-009-0447-z - 24. Awad, R., Roumié, M., Abou-Aly, A.I., Mahmoud, S.A. and Barakat, M.M. (2011) Ion Beam Analysis and Normal-State Conduction Mechanisms for (Bi, Pb)-2223 and (Tl, Pb)/Sr-1212 Superconducting Phases Substituted by Ruthenium. Journal of Superconductivity and Novel Magnetism, 25, 273-291.
http://dx.doi.org/10.1007/s10948-011-1296-0 - 25. Rekaby, M., Roumié, M., Abou-Aly, A.I., Awad, R. and Yousry, M. (2014) Magnetoresistance Study of Y3Ba5Cu8O18 Superconducting Phase Substituted by Nd3+ and Ca2+ Ions. Journal of Superconductivity and Novel Magnetism, 27, 2385-2395.
- 26. Awad, R., Roumié, M., Isber, S., Marhaba, S., Abou Aly, A.I. and Basma, H. (2015) Investigation of Temperature Dependence of the Irreversibility Line of GdBa2Cu3O7δ Added with Nanosized Ferrite ZnFe2O4. Journal of Super- conductivity and Novel Magnetism, 28, 535-539.
http://dx.doi.org/10.1007/s10948-014-2752-4 - 27. Abou Aly, A.I., Awad, R., Mohammed, N.H., Motaweh, H.A. and El-Said Bakeer, D. (2012) Determination of Superconducting Parameters of GdBa2Cu3O7δ Added with Nanosized Ferrite CoFe2O4 from Excess Conductivity Analysis. Journal of Superconductivity and Novel Magnetism, 25, 2281-2290.
http://dx.doi.org/10.1007/s10948-012-1621-2 - 28. Chen, J.C., Xu, Y., Wu, M.K. and Guan, W. (1996) Ion-Size Effect on Normal-State Transport Properties in R0.8Pr0.2Ba2Cu3y Systems (R = Yb, Er, Dy, Gd, Eu, and Nd). Physical Review B, 53, 5839-5847.
http://dx.doi.org/10.1103/PhysRevB.53.5839 - 29. Roumié, M., Nsouli, B., Zahraman, K. and Reslan, A. (2004) First Accelerator Based Ion Beam Analysis Facility in Lebanon: Development and Applications. Nuclear Instruments and Methods in Physics Research B, 219, 389-393.
http://dx.doi.org/10.1016/j.nimb.2004.01.088 - 30. Nazarova, E.K., Nenkov, K., Fuchs, G. and Muller, K.-H. (2006) Effects of Calcium Substitution on the Superconducting Properties of R1xCaxBa2Cu3Oz (R = Eu, Gd, Er; 0 ≤ x ≤ 0.3) Polycrystalline Samples. Physica C: Superconductivity, 436, 25-31.
http://dx.doi.org/10.1016/j.physc.2006.01.002 - 31. Awad, R. (2008) Study of the Influence of MgO Nano-Oxide Addition on the Electrical and Mechanical Properties of (Cu0.25Tl0.75)-1234 Superconducting Phase. Journal of Solid State Science and Technology, 21, 461-466.
http://dx.doi.org/10.1007/s10948-008-0385-1 - 32. Mayer, M. (1997) SIMNRA User’s Guide, Report IPP 9/113. Max-Planck-Institut für Plasmaphysik, Germany.
- 33. Abou-Aly, A.I., Awad, R., Ibrahim, I.H. and Abdeen, W. (2009) Effect of Sm-Substitution on the Electrical and Magnetic Properties of (Tl0.8Hg0.2)-1223. Journal of Alloys and Compounds, 481, 462-469.
http://dx.doi.org/10.1016/j.jallcom.2009.02.156 - 34. Koo, J.H. and Cho, G. (2003) The Spin-Gap in High Tc Superconductivity. Journal of Physics: Condensed Matter, 15, L729-L733.
http://dx.doi.org/10.1088/0953-8984/15/46/L03 - 35. Isber, S., Awad, R., Abou-Aly, A.I., Tabbal, M. and Kaouar, J.M. (2005) Electric Resistivity and Magnetic Susceptibility Studies of Tl-1223 Substituted by Cobalt. Superconductor Science and Technology, 18, 311.
- 36. White, A.E., Dynes, R.C. and Garno, J.P. (1989) Destruction of Superconductivity in Quench-Condensed Two- Dimensional Films. Physical Review B, 33, 3549-3552.
http://dx.doi.org/10.1103/PhysRevB.33.3549 - 37. Abou-Aly, A.I., Awad, R., Ibrahim, I.H. and Abdeen, W. (2009) Excess Conductivity Analysis for Tl0.8Hg0.2Ba2Ca2 Cu3O9δ Substituted by Sm and Yb. Solid State Communications, 149, 281-285.
- 38. Salamati, H. and Kameli, P. (2003) Effect of Deoxygenation on the Weak-Link Behavior of YBa2Cu3O7δ Superconductors. Solid State Communications, 125, 407-411.
http://dx.doi.org/10.1016/S0038-1098(02)00809-8 - 39. Khan, N.A., Mumtaz, M., Ullah, A., Hassan, N. and Khurram, A.A. (2010) Suppression of Tc in Co-Doped (Cu0.5Tl0.5)Ba2Ca2Cu3xCoxO10δ Superconductor. Journal of Alloys and Compounds, 507, 142-145.
http://dx.doi.org/10.1016/j.jallcom.2010.07.141 - 40. Karacaa, I., Uzun, O., Kolemen, U., Ylmaz, F. and ahin, O. (2009) Effects of ZnO Addition on Mechanical Properties of Bi1.84Pb0.34Sr1.91Ca2.03Cu3.06O10 Prepared by a Wet Technique. Journal of Alloys and Compounds, 476, 486-491.
http://dx.doi.org/10.1016/j.jallcom.2008.09.077 - 41. Farbod, M. and Batvandi, M.R. (2011) Doping Effect of Ag Nanoparticles on Critical Current of YBa2Cu3O7δ Bulk Superconductor. Physica C: Superconductivity, 471, 112-117.
http://dx.doi.org/10.1016/j.physc.2010.11.005 - 42. Wang, X.L., Horvat, J., Gu, G.D., Uprety, K.K., Liu, H.K. and Dou, S.X. (2000) Enhanced Flux Pinning by Fe Point Defects in Bi2Sr2Ca(Cu1xFex)2O8+δ Single Crystals. Physica C: Superconductivity, 337, 221-224.
http://dx.doi.org/10.1016/S0921-4534(00)00105-2
NOTES

*Corresponding author.