Materials Sciences and Applications
Vol.4 No.4(2013), Article ID:30642,10 pages DOI:10.4236/msa.2013.44032
Relationship between Fracture Toughness and Fracture Surface Fractal Dimension in AISI 4340 Steel
![]()
1NAVAIR Jacksonville, Jacksonville, USA; 2Materials Science & Engineering Department, University of Florida, Gainesville, USA.
Email: jmech@mse.ufl.edu
Copyright © 2013 Luis R. Carney, John J. Mecholsky Jr. This is an open access article distributed under the Creative Commons Attribution License, which permits unrestricted use, distribution, and reproduction in any medium, provided the original work is properly cited.
Received February 20th, 2013; revised March 19th, 2013; accepted April 18th, 2013
Keywords: Fractal Fracture; Ductile Failure; Brittle Failure; Mechanical Behavior
ABSTRACT
This study analyzes the relationship between fracture toughness and the fracture surface fractal dimension for a set of twenty-four CT-type AISI 4340 steel specimens heat treated to a variety of tensile strengths. Specimens were tested in accordance with ASTM E 399. Their respective fracture surfaces were plated, polished, photographed under an SEM in BSE mode and measured according to the Richardson method to obtain fractal dimensions. For brittle materials the limited results are consistent with previous literature: increasing fractal dimension with increasing toughness. For partially or fully ductile materials the results indicate a decrease in fractal dimension with an increase in fracture toughness. The data are modeled using a variation of the function applied to ceramics. Fracture in a ductile mode is characterized by the formation of dimples which exhibit fractal characteristics. The results are discussed in terms of the micromechanisms of fracture.
1. Introduction
In recent years, a great deal of interest has developed in the area of quantitative fractography—the science of relating fracture surface features to material properties or behavior. Investigations into the various modes of failure have produced significant advances in the qualitative and quantitative understanding of how and why fractures develop [1-3]. A continuation of studies of this kind is expected to provide a better understanding of the fracture process, lead to the development of tougher materials and establish tools and procedures for the measurement of toughness properties from fracture surfaces alone. One of the concepts that has emerged as a potentially useful tool in these efforts is that of fractal geometry.
Fractal geometric analysis, when applied to a fracture surface, provides a measure of its irregularity which can be correlated to the plane-strain fracture toughness, KIC. Results to date have been mixed. Some studies have shown a positive correlation, some have shown a negative correlation and others still report no correlation at all [4-6].
A review of the literature shows that the efforts in relating KIC to the fractal dimension have employed a wide variety of materials, fracture mechanisms, and measurement methods. Despite inconsistencies in the results, some general consensus is now emerging among researchers [4,7-17]. Similar classes of materials are thought to exhibit similar behavior.
The present study is intended to suggest best practices and procedures for fractal analysis, demonstrate a relationship between KIC and the fractal dimension for AISI 4340 steel and offer an explanation of why such a relationship exists.
2. Background
Fractal geometry offers a means of describing the degree of tortuosity on the boundaries of an object. The mathematical representation of a fractal boundary line is given by:
 (1)
(1)
The linearized version is:
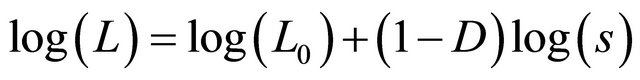 (2)
(2)
where in both (1) and (2): L = measured length, Lo = a constant (Euclidean length), s = measurement scale and D = fractal dimension.
In the particular case of irregular surfaces, for instance, it is possible to obtain fractal dimensions between 2.0 and 3.0. A planar surface would be expected to produce values near 2.0 while more tortuous surfaces would be greater than 2.0 and progressively approach 3.0 [5].
A surface exhibiting a high fractal dimension is often rougher than one exhibiting a lesser dimension. Roughness, however, is not sufficient to establish the value of a fractal surface. Fractal objects possess at least these two important qualities [6]: scale invariance and self-similarity: fractal objects display identical levels of irregularity no matter what the magnification of the object.
2.1. Fractal Dimension-Toughness Relationship in Ceramics
A significant portion of the work performed on fracture surfaces has been accomplished on ceramics [18,19]. The fundamental relationship suggested by Passoja, Mecholsky and co-workers [20-24].
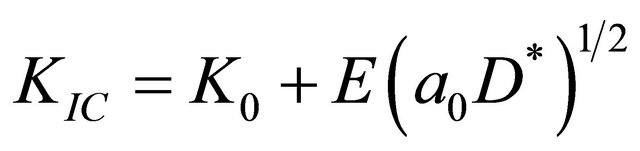 (3)
(3)
where KIC = plane strain fracture toughness, K0 = value of toughness at D* = 0 (for ceramics ~0), D* = fractional portion of the fractal dimension, E = elastic modulus and a0 = characteristic length.
Mecholsky and co-workers have interpreted a0 to be a length characteristic of the material (a structure parameter). The suggestion is made that a0 could represent more esoteric “distance related” features such as free volume, glass-crystal clusters, stretched bonds or glass phase stretched bonds [25] in inorganic glasses and glass ceramics (Figure 1).

Figure 1. Fracture toughness-fractal dimension relationships in graphical form for various classes of ceramics [25,34,35].
2.2. Previous Work in Fractal Dimension Measurement in Metals
Many researchers have long suspected a toughness-fracture topography relationship in metals [5,26-31]. Mandelbrot, Passoja, et al. [26] used impact toughness specimens of type 300-grade maraging steel and the perimeter-area version of the slit-island method. Their study was duplicated by Ray and Mandal [32] (using a high strength low alloy steel), Hilders and Pilo [33] (using a ferrite-pearlite steel) by employing Charpy V-notch impact specimens and the perimeter-area slit-island method. The ductile alloy revealed a decreasing fractal dimension with increasing impact toughness [26] while the brittle alloys exhibited the opposite behavior [32,33].
The results noted above are consistent with the behavior of brittle materials reported by Mecholsky [25,34] (Figure 1), comparable with the study of Underwood and Banerji [36] who also report an increase in fractal dimension with increasing toughness (temper embrittled steel) and generally in harmony with the observations of Pande et al. [28] in ductile titanium alloys who show a roughly decreasing fractal dimension with increasing dynamic tear energy (a measure of toughness).
Not all studies using impact toughness are consistent, however. According to Wiencek and co-workers [37], no relationship exists between the fractal dimension and impact toughness. Bouchaud et al. [38-40] on the other hand, indicate that fracture surfaces exhibit an essentially constant value.
Mu and Lung [41] have studied the change in fractal dimension directly against fracture toughness in two medium carbon steels. In one set of specimens the heat treatment was altered to vary the fracture toughness while in the second set the temperature was regulated.
In both cases the study showed a decrease in fractal dimension with increasing fracture toughness.
Williford [42] made one of the first attempts to collate the known information about fracture toughness-fractal surface relationships and establish a unified model. Williford [42] indicated that toughness increased with fractal dimension for brittle materials and decreased with fractal dimension for ductile materials. Each of the data sets employed were collected and analyzed in different ways from their respective sources. The toughness and fractal dimension values were obtained using different methods, thus making comparisons technically difficult and potentially inappropriate.
The difficulties encountered in the early literature by Williford [42] persist to the present. Studies continue to emerge which contain data that is difficult to correlate to the work of other authors. It is one of the aims of this work to follow the methods prescribed by Hill et al. [34] so that a foundation of consistent data can be created and made available to researchers in quantitative fractography.
3. Experimental Procedure
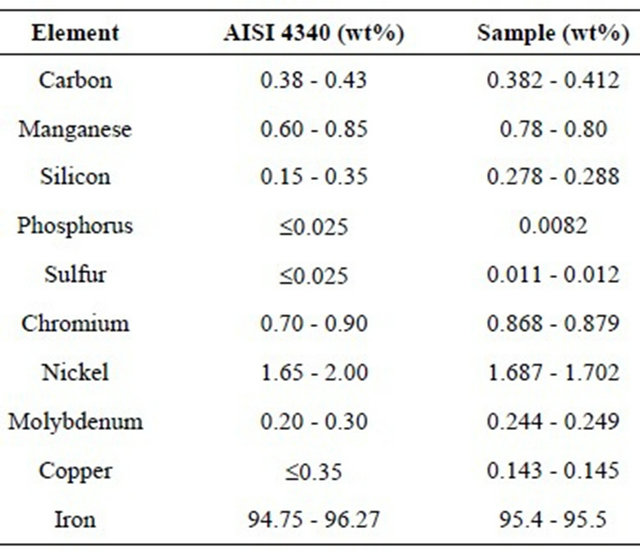
A steel meeting the compositional requirements of The American Institute of Steel and Iron AISI 4340 was used in this study. The chemical composition was measured through Glow Discharge Spectroscopy (Leco GDS- 750A). The results were consistent with the requirements of AISI 4340 and are given in Table 1.
Twenty-four rectangular compact tension (CT) type fracture toughness samples were manufactured according to the requirements of ASTM E 399 [43]. All samples were configured to meet a standard L-T orientation. The specimens measured 6.35 cm wide × 6.1 cm high × 1.27 cm thick.
In an effort to minimize cracking and machining difficulties, the samples only had the pin holes drilled and its hole corners rounded prior to hardening (Austenitizing + Oil Quenching only). Following hardening, the samples were electric discharge machined (EDM) to create chevron type (V-shaped) starter notches.
Consistent with AMS 2759/1, [44] Heat Treatment of Carbon and Low alloy Steel Parts, the samples were Austenitized at 816˚C and held for a minimum of 25 minutes, quenched in oil (at 16˚C - 71˚C) and allowed to cool to room temperature. ASTM E 399 requires that fracture toughness samples have sharp fatigue cracks of a prescribed length and shape. In this study, cracks of the required size, geometry and orientation were produced by stress corrosion cracking (SCC) using a solution of 5% HCl/H2O and an applied load of 2.2 kN for ~30 minutes. Immediately following this operation, specimens were cleaned and neutralized by immersion in an ultrasonic cleaning chamber filled with water/soap solution for 30 minutes. Specimens were then hot air dried (~49˚C) for another 30 minutes at 50˚C and coated with a light oil.
Table 1. Chemical composition of raw material.
The pre-cracked collection of 24 CT samples was divided into eight sets of three. The first set was placed aside to form an untempered subset. The remaining specimens were tempered at 480˚C in an industrial air furnace. The furnace temperature was held constant at 480 ˚C and each set was kept in the furnace for a different duration, comprising between 5 and 95 minutes, to obtain hardness values in the range of 52 to 40 HRC. Hardness may be used to link to approximate mechanical properties. The microstructural features observed at both extremes of the hardness range were similar. The samples displayed the martensitic laths typical of AISI 4340 steel heat treated to 40 HRC and above. No abnormal structures, inclusions or chemical anomalies (segregation) were observed.
In an effort to ensure that all samples exhibited uniform heat treatment through their thickness, a microhardness traverse was performed in accordance with ASTM E 384 [45], Knoop 500 g scale. The 54 HRC mounted and polished cross section employed for microstructural evaluation (untempered) was used in the traverse. The mean microhardness value was uniform and measured to be 598 HK500 g ± 15 HK500 g.
Grain size was measured using an SEM from precracked intergranular regions using a method developed by Raymond [46]. Average grain size was determined to be 8 µm (ASTM 11). Fracture toughness tests were conducted generally in accordance with ASTM E 399 [43].
3.1. Slit-Island Production and Image Capture
One side of every fracture toughness specimen was electroless nickel plated for 15 minutes. A layer measuring approximately 6 microns was deposited. A grinding and polishing procedure (600 grit SiC to 0.05 micron Al2O3) caused the removal of nickel plate from high spots on the fracture surfaces. This removal resulted in the production of numerous flat islands of steel surrounded by nickel plate. These islands were readily identified under a CamScan MaXim 2040 SL scanning electron microscope (SEM) in backscatter electron imaging (BEI) mode.
Three slit islands were photographed from each sample. A magnification of ×500 - ×800 was found to produce sufficient resolution and a clear view of each area of interest. The islands were selected on the following basis:
1) The island must fill between 70% and 90% of the image window;
2) The island must have an undamaged contour (free from pits, voids, large scratches);
3) The island must not exhibit metallurgical irregularities on its perimeter (free of inclusions or MnS stringers);
4) The image must have good contrast between the base metal and the surrounding Ni plate;
5) Slit islands were to be located within the flat planestrain region of the sample (away from the angular shear lips).
Image processing was performed in a standard desktop computer operating a software program known as Image Pro (V. 3.0.01.00) and an accessory program known as Materials Pro (V. 3.1) (Media Cybernetics, USA). In essence, Materials Pro performs the same operations an operator would perform in a manually executed Richardson plot [47]. The minimum requirement established by the software is that analyzed areas contain 30 pixels or more. The software then obtains D, the slope of the log (ruler length) vs log (perimeter), such that D = 1. D*. For an irregular curve, D* falls in the range of 0 < D* < 1.
The slit island method was used to determine the fractal dimensional increment. A minimum of three BEI images were obtained from each of the twenty four samples. Each image was used “as is” if the image analysis program could accurately distinguish its boundaries from the surrounding nickel plate. Otherwise, the island was printed on paper for manual contrast enhancement, re-scanned and digitally analyzed. The fractal dimension for a specimen was determined by taking the average of the three islands measured. An example of two slit islands prior to and following manual enhancement is illustrated in Figure 2.
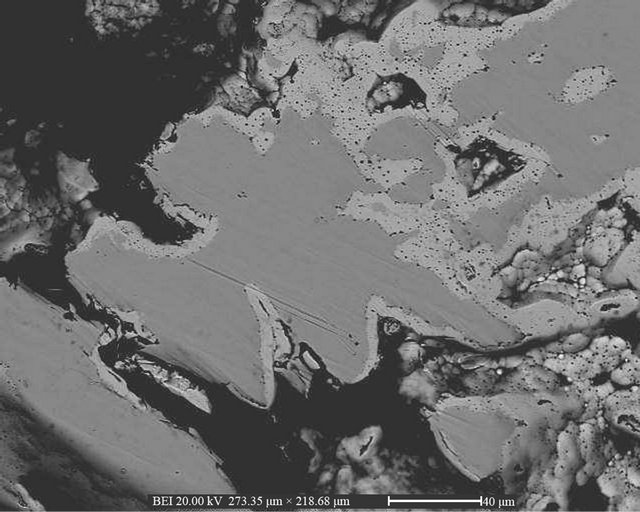 (a)
(a)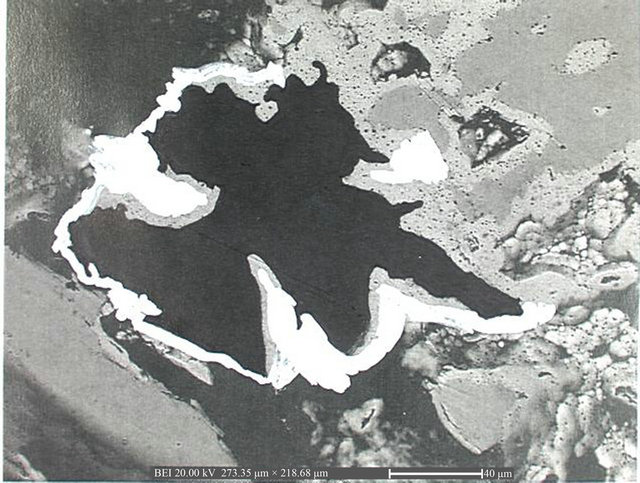 (b)
(b)
Figure 2. (a) Slit islands acquired under a SEM in BSE mode; (b) Slit islands manually enhanced to increase contrast for digital profile capture and measurement.
4. Results and Discussion
Figure 3 summarizes the results obtained for fracture toughness and fractal dimension measurements. In general, the results illustrated in Figure 3 show a decrease in D* with increasing fracture toughness. Some inconsistencies, however, were noted in the extremes of the curve. At the low fracture toughness values, the D* values dropped unexpectedly. At the high fracture toughness end, the D* values were observed to rise above the downward trend. Fractographic studies were under-taken to understand the source of these inconsistencies.
Scanning electron microscopy of the fracture surfaces showed one, two or three fracture mechanisms. Samples were observed to have separated through the grain boundaries (intergranular or “IG” separation), cleavage (transgranular) and/or microvoid coalescence (dimple rupture).
Three images were recorded for each fracture toughness value set for measurement of their respective proportions of intergranular separation, cleavage fracture and ductile fracture (a general term which includes dimple rupture, tearing and localized plastic flow). Once each image was collected, it was printed, manually enhanced to readily distinguish ductile areas from cleavage and intergranular facets, re-scanned and computer processed. The results are provided in Table 2.
The data presented in Table 2 was compared against the fracture toughness-fractal dimension results of Figure 3. One explanation for the drop in fractal dimension values at low fracture toughness (untempered specimens of Set # 1) is that the fracture mechanism in these specimens is dominated by IG separation and cleavage.
At the greater fracture toughness values (above ~90 MPa m1/2) the explanation for the deviation in linearity is related to the departure from ideal linear-elastic conditions. The strict sample thickness requirements (“B” dimension) of ASTM E 399 were no longer satisfied. At above ~90 MPa√m the data should be considered to represent a K0 value rather than a KIC value.
Figure 3 illustrates that the set of 24 fracture toughness samples can be divided into essentially two categories based on the predominant fracture mechanism. The first category is composed of samples where the fracture mode resulted in approximately 83% or more IG and cleavage. The second category consists of samples where IG separation and cleavage covered approximately 64% or less of the fracture surface. Samples in the second category follow in a consistent, nearly linear pattern.
In Figure 3, note that the fractal dimension values continue to drop with increasing toughness in the ductile failure range. This behavior indicates that the dimensional increment measurement (D*) is quantifying changes in the surface tortuosity and is not merely a surrogate measurement for the proportion of brittle-ductile fracture.
4.1. Suggested Model
An examination of the data collected in this study shows that a number of linear or nearly linear mathematical descriptions would be appropriate. Most studies [28,32, 33,35] with metals have explored the fractal qualities of fracture surfaces but have failed to offer mathematical relationships between these quantities or explanations for why this behavior exists.
In evaluating this data, the numbers corresponding to the samples exhibiting a high degree of intergranular fracture was not used. This set (Set # 1) was excluded on the basis that the fracture mechanism is significantly different (predominately brittle) from those exhibiting large proportions of dimple rupture. A number of studies have reported that the behavior of brittle and ductile materials is distinctly different and should be addressed separately [42].
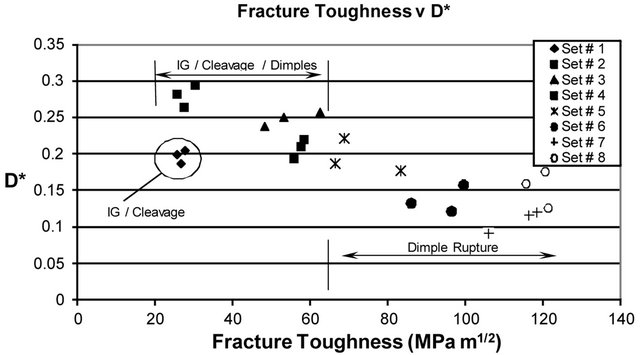
Figure 3. Fracture toughness vs. D*. Fractographic features and validity of fracture toughness results are noted.
Table 2. Percentage of area covered by ductile fracture vs. sample set.

The data obtained in this study is consistent with a variation of the Mecholsky et al. model [20-24]. In developing their equation, Mecholsky et al. relied partially on dimensional analysis. Recent work shows that their results may be well founded in atomic theory [48].
In view of the fact that the data exhibits linear characteristics and that dimensional requirements must be satisfied, KIC and D* are related as follows:
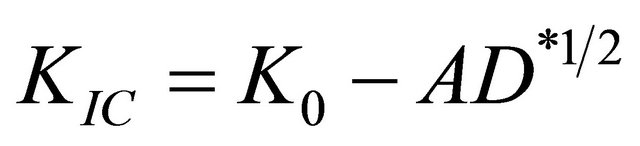 (4)
(4)
Compare this with Equation (3). The variables and constants are interpreted as follows: KIC = plane strain fracture toughness, K0 = 250 = a (maximum value) constant (MPa m1/2), A = 402 MPa m1/2 = a second constant composed of  (MPa m1/2), E = Young’s modulus, a0 = a material dependent structure parameter and D* = surface fractal dimensional increment.
In accordance with this relationship 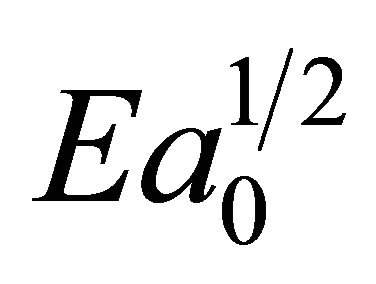 = 402 MPa√m. Using the fact that E is approximately 200 GPa for heat treated steels, a0 is equal to 4.0 × 10⁻⁶ meters. This value of a0 is of the order of the larger dimples observed on the microstructure of the ductile samples.
4.2. Interpretation
As observed in Equations (3) and (4) the relationships presently available to define D* and a0 do not adequately explain the precise meaning of these variables, however, they do suggest that they are related to each other and represent microstructural characteristics. The structure parameter is taken to be closely related to some significant structure dimension while the behavior of D* is consistent with the alloy’s flow behavior.
It has been discussed that AISI 4340 as well as many other similarly ductile high strength steels fracture by a process of microvoid nucleation, growth and coalescence. Nucleation begins at the largest particles (MnS and other inclusions). As additional strain is applied, smaller particles (cementite and other carbides) begin to participate in the nucleation process. Growth of the initial voids leads to localization of strains between cavities. The strained regions nucleate additional voids (a void sheet) which eventually connect the larger voids.
Examination of ductile fracture surfaces shows the presence of dimples of ever decreasing sizes. Ishikawa [49] has observed that this pattern of circles adjacent to smaller circles is fractal in nature (see Figure 4). The results of this study agree. Ishikawa, however, as most researchers in this area, was not able to explain the roots of this behavior.
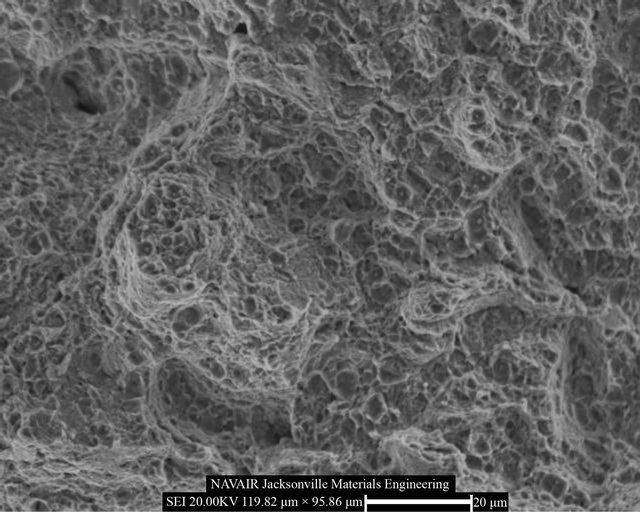
Fracture surface observations made throughout this research, the data collected, and the findings of previous researchers indicate that fracture surfaces are created by the application of some prescribed set of rules. One of the rules seems to be that dimples should have nearly the same proportions within a given range of void nucleating particle sizes. Figure 5 shows the range of dimple sizes seen in the ductile fracture surfaces in this study similar to those proposed by Isikawa [49].
A fractal surface requires that the observed fractal pattern appear similar at a wide range of magnifications. In other words, two images of dimple rupture taken at different magnifications from the same surface should appear the same, or nearly so. This requirement, in turn, implies that void sizes should follow a rule of constant proportionality between particle and void.
Garrison et al. [50-54] have examined a number of high strength steel fracture surfaces. Their findings show that one of the features that appear to remain relatively constant throughout a range of inclusion sizes, as well as being an indicator of fracture toughness, is the ratio of the void radius to the inclusion radius (Rv/Ri).

Figure 4. Ishikawa’s idealized view of a ductile fracture surface dimple pattern. Observe dimples adjacent to dimples of ever decreasing size [49].
 (a)
(a) (b)
(b)
Figure 5. Ductile Fracture Surface of AISI 4340 (set 6) showing the range of dimple sizes and possible “dimples within dimples”. The size bar shown in (a) is 20 microns and in (b) is 5 microns.
One of their several graphs is shown in Figure 6. The data show that for the same range of features (dimple sizes) sampled by the slit islands used in this study (~0.8 microns and larger), the void diameters were nearly constant. Although the steel presented in this figure (AF 1410) is different than AISI 4340, the microvoid coalescence process is thought to be controlled by the same basic factors (inclusion sizes/distribution and matrix flow properties) and develops in the same manner (nucleation, growth and coalescence by void sheets).

Figure 6. Graph illustrating the void growth to inclusion size ratio (Rv/Ri) as a function of the inclusion radius for a high strength AF 1410 steel aged at 510˚C [51].
Williford [42] provides an argument for the decrease in D* with increasing KIC in the case of ductile fracture surfaces. In these materials, as the fracture toughness increases, the surface is more “stretched out” as a result of wider and deeper microvoids. On a microscopic scale the surface is becoming smoother.
This study cannot answer the role of a0 in the fracture of steel, however, some thoughts are provided for consideration. Unstable crack propagation in metallic alloys begins when a critical stress is reached over a microstructurally significant distance. Some researchers have reported this distance to be in the order of 100 to 300 micrometers, depending on alloy chemistry, testing conditions and heat treatment [55]. If this interpretation is accepted, it may also be possible to say that a number of damage sites of length a0 (sub-units of the critical length) join over the microstructurally significant distance, and thereby, lead to unstable crack propagation. This topic should be one of the subjects for future research.
5. Summary and Conclusions
The results of this study provide the basis for forming the following conclusions:
1) The fractal dimension was measured on AISI 4340 Steel that was heat treated to provide a range of values from ductile to brittle. This is one of the few studies that examines one material in various conditions to study the effect of microstructure and fracture toughness on the generation of the fractal geometry of the fracture surface;
2) For the material that failed in a ductile manner, the fractal dimension decreased with increasing fracture toughness. With the materials that failed in a brittle or semibrittle manner, the values are consistent with an increase in the fractal dimension with an increased toughness;
3) The decreasing values of D* with increasing fracture toughness may be modeled by a variation of an equation developed for brittle materials [21]. This function suggests the involvement of a structure parameter (a0), having units of length. The value for a0 obtained in this study suggests a relationship to the largest dimple size;
4) D* is taken to represent the degree of ductility available in the alloy matrix (the material that surrounds the primary voids). An increase in fracture toughness is found when dimples are more stretched out.
REFERENCES
- S. R. Lampman, “ASM Handbook Vol. 19: Fatigue and Fracture,” ASM International, Ohio, 1996.
- V. J. Colangelo and F. A. Heiser, “Analysis of Metallurgical Failures,” John Wiley & Sons, New York, 1974.
- J. J. Mecholsky, “Fractography in Failure Analysis,” American Society for Testing and Materials, Philadelphia, 1978.
- J. C. Russ, “Fractal Surfaces,” Plenum Press, New York, 1994.
- B. B. Mandelbrot, “The Fractal Geometry of Nature,” WH Freeman Co., New York, 1982.
- J. J. Mecholsky Jr., “Fractal Analysis and Fractography: What Can We Learn That’s New?” Key Engineering Materials, Vol. 413, 2009, pp. 145-153.
- V. Y. Milman, N. A. Stelmashenko and R. Blumenfeld, “Fracture Surfaces: A Critical Review of Fractal Studies and a Novel Morphological Analysis of Scanning Tunneling Microscopy Measurements,” Progress in Materials Science, 1994, Vol. 38, 1994, pp. 425-474. doi:10.1016/0079-6425(94)90006-X
- G. P. Cherepanov, A. S. Balankin and V. S. Ivanova, “Fractal Fracture Mechanics—A Review,” Engineering Fracture Mechanics, Vol. 51, No. 6, 1995, pp. 997-1033. doi:10.1016/0013-7944(94)00323-A
- A. M. Gokhale and E. E. Underwood, “A General Method for Estimation of Fracture Surface Roughness: Part I. Theoretical Aspects,” Metallurgical Transactions A, Vol. 21, No. 5, 1990, pp. 1193-1199.
- A. M. Gokhale and W. J. Drury, “A General Method for Estimation of Fracture Surface Roughness: Part II. Practical Considerations,” Metallurgical Transactions A, Vol. 21, No. 5, 1990, pp. 1201-1207.
- W. Lei and B. Chen, “Fractal Characterization of Some Fracture Phenomena,” Engineering Fracture Mechanics, Vol. 50, No. 2, 1995, pp. 149-155. doi:10.1016/0013-7944(94)00180-P
- J. J. Friel and C. S. Pande, “Direct Determination of Fractal Dimension of Fracture Surfaces Using Scanning Electron Microscopy and Stereoscopy,” Journal of Materials Research, Vol. 8, No. 1, 1993, pp. 100-104.
- M. Coster and J. L. Chermant, “Recent Developments in Quantitative Fractography,” International Metals Review, Vol. 28, No. 4, 1983, pp. 228-250.
- Z. P. Bazant, “Scaling Laws in Mechanics of Failure,” Journal of Engineering Materials and Technology, Vol. 119, No. 9, 1993, pp. 1828-1844.
- D. E. Roach and A. D. Fowler, “Dimensionality Analysis of Patterns: Fractal Measurements,” Computer and Geosciences, Vol. 19, No. 6, 1993, pp. 849-869. doi:10.1016/0098-3004(93)90055-A
- L. L. Mishnaevsky, “Methods of the Theory of Complex Systems in Modelling of Fracture: A Brief Review,” Engineering Fracture Mechanics, Vol. 56, No. 1, 1997, pp. 47-56. doi:10.1016/S0013-7944(96)00110-5
- L. V. Meisel, “Perimeter-Area Analysis, the Slit-Island Method and the Fractal Characterization of Metallic Fracture Surfaces,” Journal of Physics D: Applied Physics, Vol. 24, No. 6, 1991, pp. 942-952. doi:10.1088/0022-3727/24/6/020
- A. Carpinteri, “Fractal Nature of Material Microstructure and Size Effects on Apparent Mechanical Properties,” Mechanics of Materials, Vol. 18, No. 2, 1994, pp. 89-101. doi:10.1016/0167-6636(94)00008-5
- A. Carpinteri, G. Ferrara and L. Imperato, “Scaling Laws for Strength and Toughness of Disordered Materials: A Unified Theory Based on Fractal Geometry,” Engineering Fracture Mechanics, Vol. 48, No. 5, 1994, pp. 673-689. doi:10.1016/0013-7944(94)90175-9
- D. E. Passoja, “Fundamental Relationships between Energy and Geometry in Fracture,” In: J. Varner and V. D. Frechette, Eds., Fractography of Glasses and Ceramics, American Ceramic Society, Westerville, 1988, pp. 101- 126.
- J. J. Mecholsky, T. J. Mackin and D. E. Passoja, “SelfSimilar Crack Propagation in Brittle Materials,” In: J. Varner and V. D. Frechette, Eds., Fractography of Glasses and Ceramics, American Ceramic Society, Westerville, 1988, pp. 127-134.
- J. J. Mecholsky, D. E. Passoja and K. S. Feinberg-Ringel, “Quantitative Analysis of Brittle Fracture Surfaces Using Fractal Geometry,” Journal of the American Ceramic Society, Vol. 72, No. 1, 1989, pp. 60-65. doi:10.1111/j.1151-2916.1989.tb05954.x
- J. J. Mecholsky and S. W. Freiman, “Relationship between Fractal Geometry and Fractography,” Journal of the American Ceramic Society, Vol. 74, No. 12, 1991, pp. 3136-3138. doi:10.1111/j.1151-2916.1991.tb04313.x
- J. J. Mecholsky, “Quantitative Fractography: An Assessment,” In: J. R. Varner and V. D. Frechette, Eds., Ceramics Transaction: Fractography of Glasses and Ceramics II, American Ceramic Society, Westerville, 1991, pp. 413-451.
- J. J. Mecholsky, Fractography, Fracture Mechanics and Fractal Geometry: An Integration,” In: J. R. Varner, V. D. Frechette and G. D. Quinn, Eds., Ceramic Transactions: Fractography of Glasses and Ceramics III, American Ceramic Society, Westerville, 1996, pp. 385-393.
- B. B. Mandelbrot, D. E. Passoja and A. J. Paullay, “Fractal Character of Fracture Surfaces of Metals,” Nature, Vol. 308, 1984, pp. 721-722. doi:10.1038/308721a0
- C. S. Pande, L. R. Richards and S. Smith, “Fractal Characteristics of Fractured Surfaces,” Journal of Materials Science Letters, Vol. 6, No. 3, 1987, pp. 295-297. doi:10.1007/BF01729330
- C. S. Pande, L. E. Richards, L. E. Louat, B. D. Dempsey and A. J. Schwoeble, “Fractal Characterization of Fractured Surfaces,” Acta Metallurgica, Vol. 35, No. 7, 1987, pp. 1633-1637. doi:10.1016/0001-6160(87)90110-6
- G. Bo and Z. H. Lai, “Fractal Characteristics of J-R Resistance Curves of Ti-6A1-4V Alloys,” Engineering Fracture Mechanics, Vol. 44, No. 6, 1993, pp. 991-995. doi:10.1016/0013-7944(93)90119-D
- W. A. Spitzig, G. E. Pellisier, C. D. Beachem, A. J. Brothers, M. Hill and W. R. Warke, “Electron Fractography,” American Society for Testing and Materials, Philadelphia, 1968.
- G. R. Yoder and V. Weiss, “Superplasticity in Eutectoid Steel,” Metallurgical Transactions, Vol. 3, No. 3, 1972, pp. 675-681. doi:10.1007/BF02642750
- K. K. Ray and G. Mandal, “Study of Correlation between Fractal Dimension and Impact Energy in a High Strength Low Alloy Steel,” Acta Metallurgica et Materialia, Vol. 40, No. 3, 1992, pp. 463-469. doi:10.1016/0956-7151(92)90394-T
- O. A. Hilders and D. Pilo, “On the Development of a Relation between Fractal Dimension and Impact Toughness,” Materials Characterization, Vol. 38, No. 3, 1997, pp. 121-127. doi:10.1016/S1044-5803(96)00148-9
- T. J. Hill, A. Della Bona and J. J. Mecholsky, “Establishing a Protocol for Measurements of Fractal Dimensions in Brittle Materials,” Journal of Materials Science, Vol. 36, No. 11, 2001, pp. 2651-2657. doi:10.1023/A:1017900526824
- T. J. Mackin, J. J. Mecholsky and D. E. Passoja, “Crack Propagation in Brittle Materials as a Fractal Process,” Materials Research Society, Warrendale, 1987.
- E. E. Underwood and K. Banerji, “Fractals in Fractography” Materials Science and Engineering, Vol. 80, 1986, pp. 1-14. doi:10.1016/0025-5416(86)90297-1
- K. Wiencek, A. Czarski and T. Skowronek, “Fractal Characterization of Fractured Surfaces of a Steel Containing Dispersed Fe3C Carbide Phase,” Materials Characterization, Vol. 46, No. 2-3, 2001, pp. 235-238. doi:10.1016/S1044-5803(01)00129-2
- E. Bouchaud, G. Lapasset and J. Planes, “Fractal Dimension of Fractured Surfaces: A Universal Value?” Europhysics Letters, Vol. 13, No. 1, 1990, pp. 73-79.
- E. Bouchaud, G. Lapasset and J. Planes, “Statistics of Branched Fracture Surfaces,” Physical Review B, 1993, Vol. 48, No. 5, 1993, pp. 2917-2928. doi:10.1103/PhysRevB.48.2917
- E. Bouchaud, “Scaling Properties of Cracks,” Journal of Physics: Condensed Matter, Vol. 9, No. 21, 1997, pp. 4319-4344. doi:10.1088/0953-8984/9/21/002
- Z. Q. Mu and C. W. Lung, “Studies on the Fractal Dimension and Fracture Toughness of Steel,” Journal of Physics D: Applied Physics, Vol. 21, No. 5, 1988, pp. 848-850. doi:10.1088/0022-3727/21/5/031
- R. E. Williford, “Scaling Similarities between Fracture Surfaces, Energies, and a Structure Parameter,” Scripta Metallurgica, Vol. 22, No. 2, 1988, pp. 1749-1754. doi:10.1016/S0036-9748(88)80333-8
- American Society for Testing and Materials, “Standard Test Method for Plane-Strain Fracture Toughness of Metallic Materials,” 1990.
- Society of Automotive Engineers, “Heat Treatment of Steel Parts: Aerospace Materials Specification 2759C,” 2000.
- American Society for Testing and Materials, “Test Method for Microhardness of Materials,” Philadelphia, 1999.
- Louis Raymond, “Metal Progress Datasheet: Nomogram for Determining ASTM Grain Size,” Metals Progress, Vol. 126, No. 6, 1984, p.34.
- Media Cybernetics, “Materials-Pro Analyzer User Guide,” Silver Springs, 1996.
- J. K. West and L. L. Hench, “The Effect of Environment on Silica Fracture: Vacuum, Carbon Monoxide, Water and Nitrogen,” Philosophical Magazine A, Vol. 77, No. 1, 1998, pp. 85-113. doi:10.1080/13642819808206385
- K. Ishikawa, “Fractals in Dimple Patterns of Ductile Fracture,” Journal of Materials Science Letters, Vol. 9, No. 4, 1990, pp. 400-402. doi:10.1007/BF00721011
- W. M. Garrison Jr., “A Micromechanistic Interpretation of the Influence of Undissolved Carbides on the Fracture Toughness of a Low Alloy Steel,” Scripta Metallurgica, Vol. 20, No. 5, 1986, pp. 633-636. doi:10.1016/0036-9748(86)90480-1
- W. M. Garrison Jr. and N. R. Moody, “The Influence of Inclusion Spacing and Microstructure on the Fracture Toughness of Steel,” Metallurgical Transactions A, Vol. 18, No. 7, 1987, pp. 1257-1263.
- W. M. Garrison and N. R. Moody, “Ductile Fracture,” Journal of Physics and Chemistry of Solids, Vol. 48, No. 11, 1987, pp. 1035-1074. doi:10.1016/0022-3697(87)90118-1
- W. M. Garrison Jr., “A Microstructural Interpretation of the Fracture Strain and Characteristics Fracture Distance,” Scripta Metallurgica, Vol. 18, No. 6, 1984, pp. 583- 586. doi:10.1016/0036-9748(84)90345-4
- W. M. Garrison Jr., A. L. Wojcieszynski and L. E. Iorio, Conference Proceedings of 1997 TMS Annual Meeting, Orlando, 1997, pp. 361-372.
- R. O. Ritchie, W. L. Server and R. A. Wullaert, “Critical Fracture Stress and Fracture Strain Models for the Prediction of Lower and Upper Shelf Toughness in Nuclear Pressure Vessel Steels,” Metallurgical Transactions A, Vol. 10, No. 10, 1979, pp. 1557-1570. doi:10.1007/BF02812022