Natural Science
Vol.5 No.5(2013), Article ID:32068,6 pages DOI:10.4236/ns.2013.55072
Estimation of road dust using BSNEs
![]()
Department of Civil, Environmental and Natural Resources Engineering, Luleå University of Technology, Luleå, Sweden; *Corresponding Author: qijia@ltu.se
Copyright © 2013 Qi Jia et al. This is an open access article distributed under the Creative Commons Attribution License, which permits unrestricted use, distribution, and reproduction in any medium, provided the original work is properly cited.
Received 28 March 2013; revised 30 April 2013; accepted 14 May 2013
Keywords: Road Dust; Dust Measurement; BSNEs
ABSTRACT
Mining is a core industry in Sweden and plays an important role in the economic development throughout the country. Though the importance of mining dust has been well recognized, the quantification of dust production with regard to individual source activity has rarely been done in Sweden. Depending on the type of source activity, dust estimation method can be chosen from three alternatives: exposure profiling methods, back calculation method, and wind erosion prediction method. Also included in the paper is an example of experiment, which was executed on two unpaved roads in Lulea, Sweden by using exposure profiling method. The experiment concluded that dust emission due to vehicle transportation is strongly dependent on traveling speed and road bed material.
1. INTRODUCTION
Mining is a core industry in Sweden and plays an important role in the economic development throughout the country. Determination of dust emission from mining activities can give mine environmental engineers and manager’s prior information on the likely impact of air quality. Effective mitigate measures can be devised based upon the dust estimation. Though the importance of mining dust has been well recognized, there are not so many field measurements outside the United States. Real-world measurements are usually very difficult because of different influencing factors. Some research has been done on road dust. Fitz et al. [1] used SCAMPER (System of Continuous Aerosol Monitoring of Particulate Emissions from Roadways) mobile platform to measure PM10 concentration. Kuhns et al. [2] developed TRAKER (Testing Re-entrained Aerosol Kinetic Emissions from Roads)
system to measure road dust. In Sweden TRAKER system has been used to study the relationship between dust concentration, vehicle speed, and tyre types, to find hot spots of dust emission, and to exam, the efficiency of dust control [3-5]. In Malmberget mine and Aitik mine in Northern Sweden, some simple measurements have been done using dust deposition gauges and air quality monitor. These measurements give a general view of dust generation over the entire mining site. However, quantification of total dust from individual source activity is somewhat complicated.
A proper designed dust estimation method for individual mining activity helps to define hot sources and predict the dust generation for planned new mines. Depending on the type of source activity, dust estimation method can be chosen from three alternatives: exposure profiling methods, back calculation method [6], and wind erosion prediction method [7]. Exposure profiling method is to measure the passage of airborne particulate matter immediately downwind from the source by simultaneous multipoint sampling of particle concentration over the effective cross section of a dust plume. Dust generation can be calculated by integration dust concentration over the cross section of the dust plume. This method can be applied at the source such as haul roads, crushers, stockpiles. For the activities which take place in a big area, and the cross section of the dust plume is difficult to be defined. Back calculation should be possible to estimation dust emission rate from the source. This method measures the downwind dust concentration at a certain point. The emission rate from the source activity is obtained by back calculation using a generalized atmospheric dispersion model. Wind erosion prediction method is applicable for the exposed vacant surfaces with no application of mechanical works, e.g. tailings dams. The prediction system simulates the changes of the soil condition during the process of wind erosion based on the initial condition of soil and weather conditions, and thus estimates the amount of erodible material. The paper also includes an example of experiment, which was executed on two unpaved roads in Lulea, Sweden by using exposure profiling method. The experiment concluded that dust emission due to vehicle transportation is strongly dependent on traveling speed and road bed material. More dust can be emitted with increasing driving speed and silt content in road bed material.
2. A CASE STUDY-DUST EMISSION FROM UNPAVED ROADS IN LULEÅ, SWEDEN
In this section, an example of dust measurement by using exposure profiling methods is described. The measurements were done using BSNE samplers (Big Spring Number Eight) [8] BSNE sampler has a relative large inlet area of 10 cm2, and its efficiency has been tested for various grain sizes [9-11].
2.1. Materials and Methods
The measurements were carried out on two unpaved roads in Luleå Sweden. The first road is located in Hertsö area in the west along the city center of Lulea (Figure 1). The road surface is natural soil with some boulders and there are vegetation covers along both sides of the road, which can hinder dust spreading (Figure 2). The second road is at a construction site located in Björsby north of the Luleå city center (Figure 1). The road surface is composed of fine materials, and no vegetation exists at the construction site (Figure 3).
The car used for dust generation is Ford Mondeo with

Figure 1. Luleå.


Figure 2. The unpaved road in Hertsö and the road surface.


Figure 3. The unpaved road in Björsby and the road surface.
an approximate weight of 1730 kg and 4 wheels (Figure 4). The car drove 15 runs for each of the following speeds: 20 km/h, 30 km/h, 40 km/h and 50 km/h. For the first road, BSNE samplers were installed at the heights of 0.25 m, 0.50 m, 0.75 m and 1.00 m down wind direction onthe road. Two sets of BSNE samplers were installed at the same side of the road in order to collect adequate dust quantity (Figure 5). No samplers needed at the up to wind direction on the road because the wind velocity was insufficient to activate wind erosion of surface material, and the background dust was assumed to be 0. The same setup was used for the other road, but the heights of the samplers were at 0.58 m, 0.83 m, 1.08 m and 1.33 m, and the measurements were only done for the driving speed of 20 km/h. According to the obeservation during the measuremt. The height of the dust plume was always between 1 m to 1.5 m.
The weather during the measurement was rather dry and sunny. Besides the BSNE samplers, two weather stations were installed at the height of 1 m and 2 m. The average wind velocity with the height of 1 m and 2 m were 2.40 m/s and 3 m/s which cannot cause wind erosion. The wind direction was mostly from southwest. The measurements were done on the road sections which were perpendicular in the wind direction to ensure the largest amount of dust to be obtained in the samplers. Measurements on the two roads were done on the same day so that the weather factors were almost the same.
The dust in the samplers was collected by a brush with a great care to avoid sample loss. All the samples were weighed in the lab by a balance with the precision of 0.0001 g. The amount of the dust collected was insufficient for size analysis. All particles are assumed to be below 60 µm which corresponds with the maximum size

Figure 4. The dust generation by vehicle traveling.

Figure 5. The experimental setup.
of grain that can be transported in short-trem suspension under average wind speed and turbulence [12]. The samples of surface materials from the two roads were sent to the soil mechanics’ laboratory in Luleå University of Technology for moisture content and particle size analysis. Moisture content was measured by oven drying material at 105˚C to constant weight. The difference to the weight before and after the drying process is the amount of the water existed in the sample.
2.2. Calculations and Discussions
The amount of dust collected from BSNE samplers at the first road were plotted against the height for four driving speeds (Figure 6). The results for the second road compared with the first road with the same driving speed of 20 km/h are shown in Figure 7. All the figures show that the dust mass is highest at the lowest height and decreases with increasing height reaching zero at the top of the dust plume. It is reasonable to assume the zero dust mass to the ground surface level, which means the dust emission increasing sharply to the maximum value at a

Figure 6. Vertical dust flux profile for road 1 for the driving speed of 20, 30, 40, and 50 km/h.

Figure 7. Vertical dust flux profile for road 1 and road 2 for the driving speed of 20 km/h.
small height of near the surface. However, it is difficult to pinpoint the height of the maximum dust mass by these tests. It could be only inferred that the maximum point is located between ground level and the height of the lowest measurement.
The second road produced much more dust due to different road surface conditions (Figure 7). It is not easy to use vertical dust profile in Figure 6 to make the interpretation of relationship between dust production and driving speed. To visualize the relationship total dust production should be calculated.
Usually, dust production in a vacant area is calculated by using mass per unit area and the total area. Since a road is a line source, a better option to calculate dust production is to use mass per unit length traveled and the traveling length. The dust emission per unit length is calculated by integrating dust mass along the height of the dust plume. First, the amount of dust collected from different heights must be corrected for the efficiency of BSNE. Here the overall efficiency of 90% is used. The corrected dust mass is then divided by the inlet area of BSNE samplers (2 × 10 cm2) to calculate the dust amount per square meter at the four measuring heights. Integrating the dust amount from the road surface at the top of the dust plume, we get the total dust produced (µg/cm) in every centimeter traveled by the car. The integrations were done with 4th order polynomials, which fitted quite well with vertical dust profiles in Figure 6. In Figure 8 is plotted the calculated total dust production per centimeter travelled against driving speed for the first road and indicated a proportional relationship. Figure 9 shows a significant difference between the two roads in calculated total dust production per centimeter travelled. Besides the driving speed, the surface condition on the road may also impact on dust production.
Soil texture and the moisture content of the surface materials from the two roads are tabulated in Table 1. The second road has a higher amount of fine grains with size below 63 µm than that of the first road. Soil texture is the most important soil factor influencing dust production. With finer fraction existing the more dust can be generated. The second road contains a bit more rock content compared with that of the first one. But this could increase the abrasion between the tire and the road surface which results in additional dust production. Both surface samples showed very low moisture content, and no surface crust observed in the sites. Vegetation covers are present along the two sides of the first road, which would reduce dust spreading rather than dust production. The second road has not vegetation protection at all, and the dust could spread to the surrounding areas.
The linear dependence of dust emission on vehicle speed seems to be a better fit for the result from the experiment for the first road in a current study than exponential dependence (Figure 10). The R2 value of linear relationship is 10 percent higher than that of exponential relationship. R2 value is increased by 2 percent when the data was fitted with a power law. Based on R2 value in fig.10 the relationship between dust emission and vehicle speed is best described by a power law for the road in Hertsö area (road 1, R32 = 0.92), though the linear dependence showed just slight lower performance (R12 = 0.9). It should be mentioned, however, that US EPA [13] excluded vehicle speed as a parameter in estimating dust emission factors for unpaved roads but other researchers confirmed this relationship [3,14-16].
The moisture content and the soil texture of the surface material are important factors for road dust generation. Both roads in this study have low content of moisture within the surface material during the measurement (Table 1). Silt content as a factor influencing dust generation has been confirmed by several studies [6,12,17], which showed an increased dust level with increasing silt content. To visualize the silt content as an influencing factor, more data points are required. Two data points from [14] were plotted together with the data from this study (Figure 11). All the data were measured at the same driving speed of 20 km/h. All the data were corrected for the vehicle weight before plotting Figure 11

Figure 8. Total dust emission per centimeter the car drove within the speed of 20, 30, 40 and 50 km/h for the road 1.
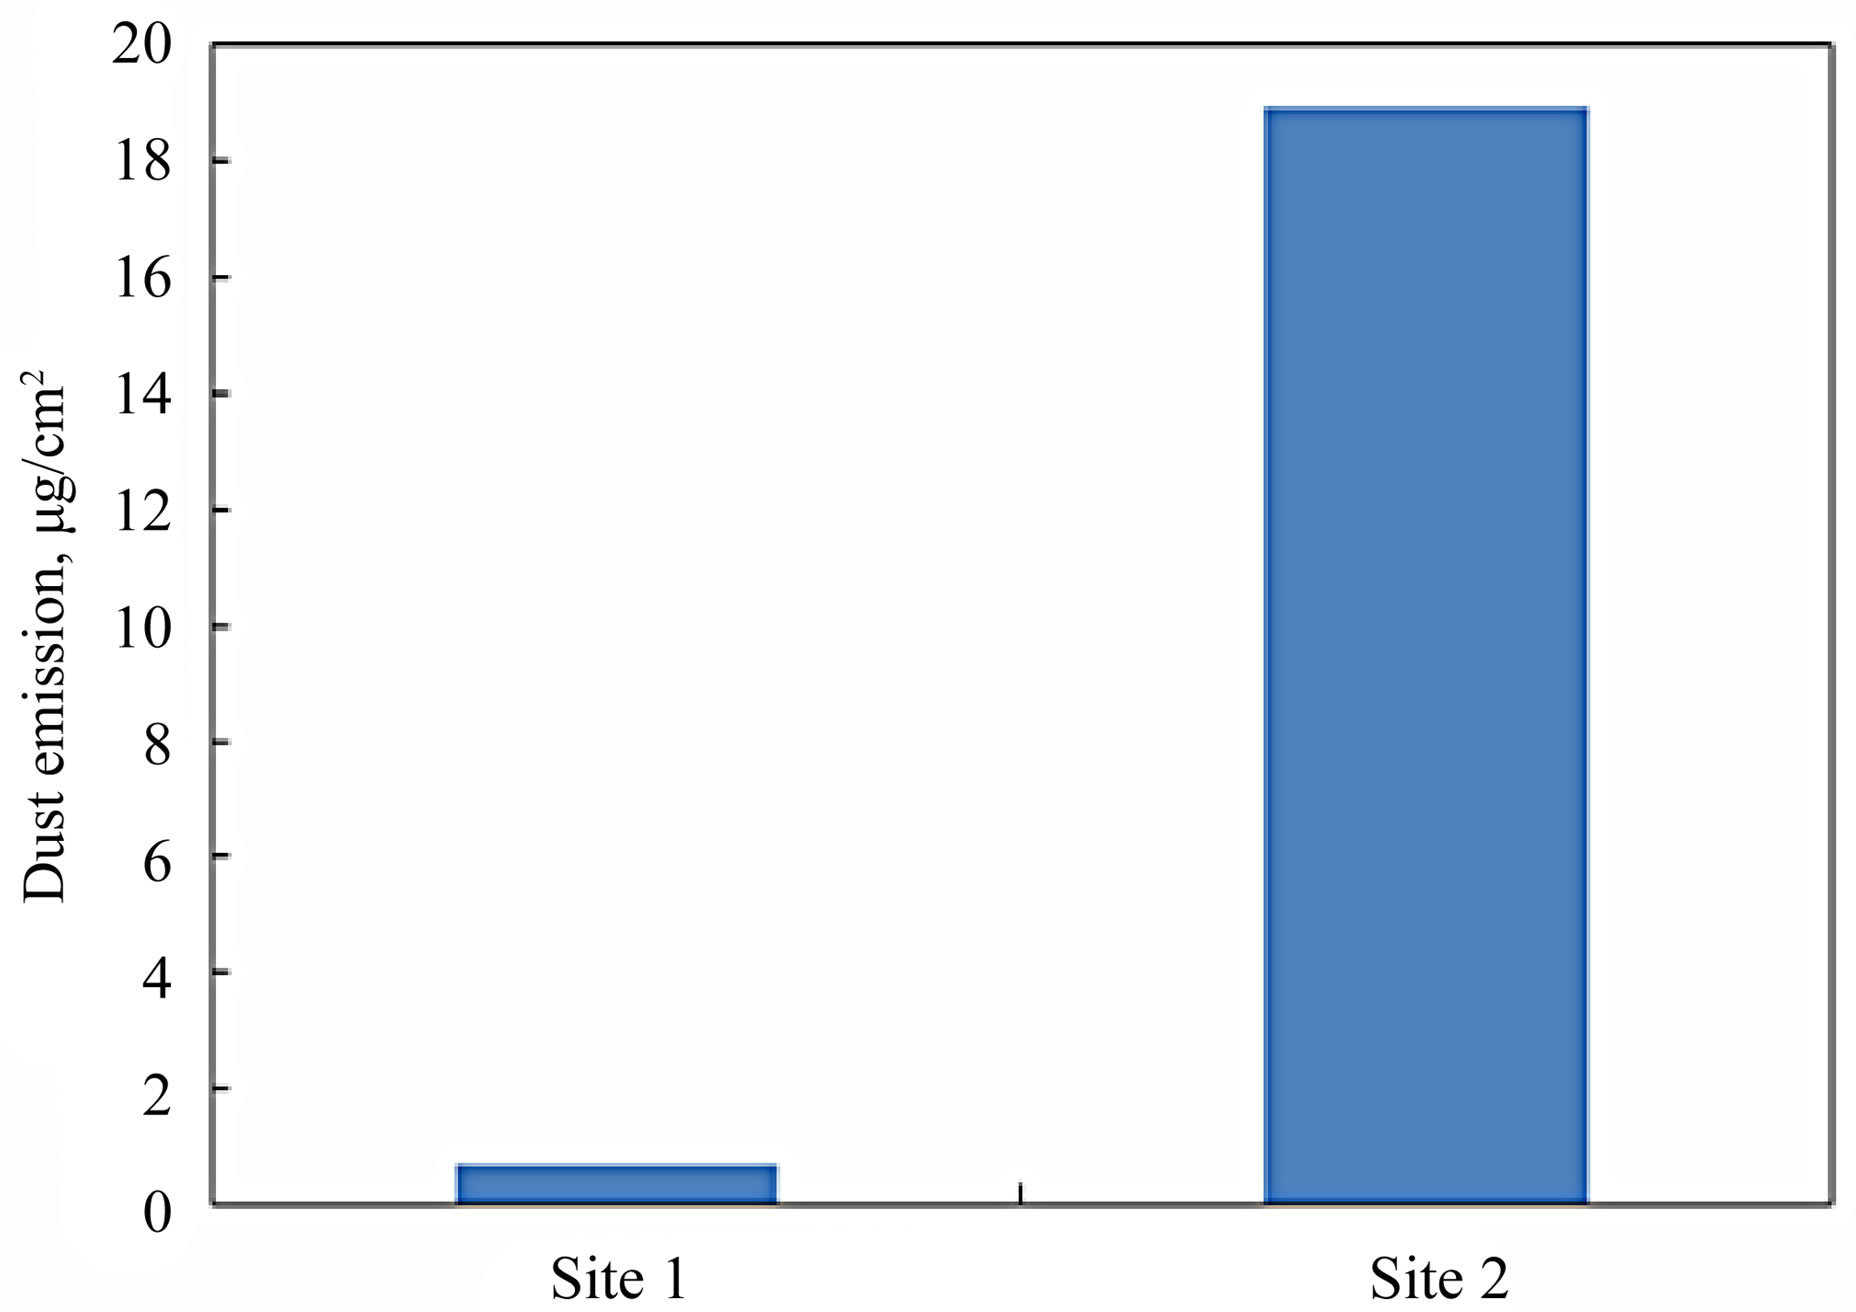
Figure 9. Total dust emission per centimeter the car drove within the speed of 20 km/h for the road 1 and road 2.

Table 1. Soil texture.

Figure 10. Dust emission versus driving speed for road1 and curve fitting.

Figure 11. Dust emission versus silt content at the driving speed of 20 km/h.
shows a linear relationship which is in consistence with earlier finding that dust generation increases with silt content.
The results from this experiment indicated that there is a strong relationship between vehicle speed and dust emission. This is in agreement with several recent studies. Dust emission has been reported to increase with driving speed exponentially or linearly; however, the power law is the best description in the data from this study. Earlier researchers have reported increased dust emission with increasing silt content, and this is confirmed by this study.
3. CONCLUSION
Exposure profiling methods, back calculation method, and wind erosion prediction method are three methods used for dust quantification in mining area. The application to the methods depends upon the characteristics of the source activity. The measurement of the dust generation from the two unpaved roads by using exposure profiling methods shows that there is a strong relationship between vehicle speed and dust emission.
REFERENCES
- Fitz, D.R., Bumiller, K., Etyemezian, V., Kuhns, H. and Nikolich, G. (2005) Measurement of PM10 emission rate from roadways in Las Vegas, Nevada using a SCAMPER mobile platform with real-time sensors. The 14th International Emission Inventory Conference, Las Vegas, 12-14 April 2004.
- Kuhns, H., Etyemezian, V., Landwehr, D., MacDougall, C., Pitchford, M. and Green, M. (2001) Testing re-entrained aerosol kinetic emissions from roads (TRAKER): A new approach to infer silt loading on roadways. Atomospheric Environment, 35, 2815-2825. doi:10.1016/S1352-2310(01)00079-6
- Hussein, T., Johansson, C., Karlsson, H. and Hansson, H. (2008) Factors affecting non-tailpipe aerosol particle emissions from paved roads: On-road measurements in Stockholm, Sweden. Atmospheric Environment, 42, 688-702. doi:10.1016/j.atmosenv.2007.09.064
- Pirjola, L., Johansson, C., Kupiainen, K., Stojiljkovic, A., Karlsson, H. and Hussein, T. (2010) Road dust emissions from paved roads measurement using different mobile systems. Air & Waste Management Association, 60, 1422- 1433. doi:10.3155/1047-3289.60.12.1422
- Edvardsson, K. (2010) Evaluation of dust suppressants for gravel roads: Methods development and efficiency studies. Doctoral Thesis in Civil Architectural Engineering, Stockholm.
- US EPA (1995) Compilation air pollutant emission factors. Report No. AP-42, US Environmental Protection Agency, Research Triangle Park, North Carolina.
- Simon, J. van D. and Edward, L.S. (2001) A field test of the wind erosion prediction system, 2001 ASAE Annual international meeting. Sacramento Convention Center, Sacramento.
- Fryear, D.W. (1986) Afield dust sampler. Journal of Soil and Water Conservation, 41, 117-120.
- Goossens, D. and Offer, Z.Y. (2000) Wind tunnel and field calibration of six aeolian dust samplers. Atmospheric Environment, 34, 1043-1057. doi:10.1016/S1352-2310(99)00376-3
- Goossens, D., Offer, Z.Y. and London, G. (2000) Wind tunnel and field calibration of five aeolian sand traps. Geomorphology, 35, 233-252. doi:10.1016/S0169-555X(00)00041-6
- Sharrat, B., Feng, G. and Wendling, L. (2007) Loss of soil and PM10 from agricultural fields associated with high winds on the Columbia Plateau. Earth Surface Processes and Landforms, 32, 621-630. doi:10.1002/esp.1425
- Pye, K. and Tsoar, H. (1990). Aeolian Sand and Sand Dunes. Unwin Hyman, London.
- Gillies, J.A., Etyemezian, V., Kuhns, H., Nikolic, D. and Gillette, D.A. (2005) Effect of vehicle characteristics on unpaved road dust emission. Atmospheric Environment, 39, 2341-2347. doi:10.1016/j.atmosenv.2004.05.064
- Goossens, D. and Buck, B. (2009) Dust emission by offroad driving: Experiments on 17 arid soil types, Nevada, USA. Geomorphology, 107, 118-138. doi:10.1016/j.geomorph.2008.12.001
- Gustafsson, M., Blomqvist, G., Gudmundsson, A., Dahl, A., Swietlicki, E., Ljungman, A. and Lindbom, J. (2007) Particle characteristics and toxicological effects of particles from the interaction between tires, road pavement and winter traction material. The Science of the Total Environment, 393, 226-240. doi:10.1016/j.scitotenv.2007.12.030
- Etyemezian, V., Kuhns, H., Gillies, J., Chow, J., Hendrickson, K., McGown, M. and Pitchford, M. (2003) Vehiclebased road dust emission measurement: III-effect of speed, traffic volume, location, and season on PM10 road dust emission in the Treasure Valley, ID. Atmospheric Environment, 37, 4583-4593. doi:10.1016/S1352-2310(03)00530-2
- Gillette, D.A. (1979) Environmental factors affecting dust emission by wind erosion. In: Morales, C., Ed., Saharan Dust, John Wiley, Hoboken, pp. 71-94.