Smart Grid and Renewable Energy
Vol.2 No.4(2011), Article ID:8274,11 pages DOI:10.4236/sgre.2011.24040
An Optimal Management System of a Wind Energy Supplier
![]()
1Faculté des Sciences Ben M’Sik, Casablanca, Morocco; 2Ecole Normale Supérieure de l’Enseignement Technique, Mohammedia, Morocco; 3Faculté des Sciences et Technique, Mohammedia, Morocco; 4Ecole Nationale Supérieure d’Electricité et de Mécanique, Casablanca, Morocco.
Email: {*o.bouattane, abraihani}@yahoo.fr
Received August 4th, 2011; revised September 20th, 2011; accepted September 27th, 2011.
Keywords: Wind Energy, Pumping, Lighting, Heating, Battery Charging, MPPT, Energy Management
ABSTRACT
In this paper, we propose a real time approach to optimize the supplied energy of a wind station. This station is used for electric energy storage in battery bank, water pumping, lighting and heating systems. The characterization of the wind generator allows us to estimate the available electrical wind energy of the platform. A data sheet of the required energy for each load (battery charging, wind pumping system, lighting system and heating system) is drawn up. Basing on the issued data sheet we develop and implement a management system for optimal energy distribution. To improve the proposed management system, we introduce a real time data acquisition (DAQ-S) and data processing (DP-S) subsystems. The DAQ-S measures all the required electrical parameters needed by the proposed DP-S to perform an optimal algorithm activating our smart decision system to allow a rational and effective use of the electrical wind power.
1. Introduction
Due to the depletion of fossil fuels and to the increase of polluted emissions: renewable energy production (hydro, solar, wind, geothermal...) is rapidly growing. Wind power is one of the renewable energy sources which have been widely developed in recent years. Wind energy has many advantages such as no pollution, relatively it low cost involved and is an inexhaustible source. Wind generators are considered as the most promising suppliers in terms of competitiveness in electrical power production. The wind energy is used for more than thousand years ago for water pumping [1], grinding grain and other low-power applications like lighting and heating systems.
In the pumping domain, we distinguish essentially two well known methods of wind pumping. They are mechanical and electrical wind pumping systems. The first method is suitable for shallow wells and small flow rates [2]. Electrical wind pumping system has more advantages than the mechanical one [3,4]. Also, the electro-wind pumping systems present greater annual efficiency of rate 5% to 6% comparing to mechanical wind pumping system of the same size [5].
More recently, the small wind-electric pumping systems have become increasingly popular, both due to greater flexibility over mechanical systems and to the advantage of being able to use spare electricity for other purposes.
In [6] a theoretical frame work has been developed which allows for the steady-state design of wind-electric water pumping system and the understanding of the system behavior at transient conditions. The critical role of energy storage in the start-up process has been discussed. The authors in [6] concluded that water pumping is a major application for small wind-electric systems and believed that the present considerations may potentially have a considerable impact, leading to better understanding and a proper design of such systems.
To reduce the water pumping cost, the electric pumping system consists essentially of a turbine coupled to a common induction motor which drives a centrifugal pump [6]. This method reduces the number of components and use storage tank water. Another solution replaces the water storage tank by electrical power storage in the battery bank and then supplies the pump via an inverter [7]. This solution requires five components to convert the wind energy into electrical energy (Wind Generator, rectifier, charge controller, batteries and inverter). In our case, we mix the two solutions, power storage in the battery bank and water storage tank.
For a rational use of this wind energy, several technical studies have been developed to increase wind system efficiency and performance. From a technological standpoint, some authors have presented a method for control design of boost converter for small size wind generator systems that are applied to battery charging application [8]. A boost converter is used to regulate the battery bank voltage in order to implement a maximum power point tracking (MPPT) process and limit the maximum current through the battery. In [9], it was proposed a new topology, where a boost converter operates in parallel with a three-phase bridge rectifier. At low speed, the boost converter is used to draw the current from the generator to the batteries. With the proposed topology, the extraction of power at low speeds is evidenced by the experimental result that improves the system performance. In [7] the analysis of the different stages of the energy conversion process and efficiency of the corresponding system were presented. This analysis included measuring the wind generator power curve, the efficiency of each component and the overall efficiency of the wind pumping system. The authors have concluded that the turbine blades could convert at most 35% of the available wind kinetic energy into rotational energy. From this energy 51% could be lost by the electrical components of the system; rectifier, batteries, and inverter. This means that just 17% of the wind energy could be available for water pumping. Since a great amount of energy is lost during its conversion process, new configurations should be developed and analyzed to avoid such losses. For the energy storage components, the measured data indicated that the rectifier, the battery bank, and the inverter operated with the average efficiencies of 95%, 78% and 86% respectively. This study showed that a great amount of energy is lost during the energy conversion process. Thus, a rational exploitation of this energy is necessary; this is the purpose of the study of this paper. This study involves the development of a strategy for the rational and optimal use of the net energy provided by our platform. Our different uses are the electric energy storage, electric wind pumping, lighting and heating systems.
This paper is organized as follows: In Section 2, we describe the system studied. We begin by a description of our platform, then we present the baseline theory of wind energy conversion and we end by determining the energy requirements for use. In Section 3, we present our optimal management system of the platform. In this section, we propose a statical analysis method based on monthly averages data. Next, a detailed description of our optimization method is presented. Different results are presented and discussed in Section 4 and we end with a conclusion and perspective.
2. System Description
2.1. Presentation of the Platform
The platform studied in this paper is installed at “Ecole Normale Supérieure de l’Enseignement Technique – ENSETMohammedia”, Morocco, latitude 33˚41′23″ North, longitude 7˚23′23′′ West. It is depicted in Figure 1 and possesses:
• A 3 KW Wind Generator (WG) of two blades, 4.6 m in diameter, operating at variable speed. The turbine is located at 21 m above the ground on a tubing tower.
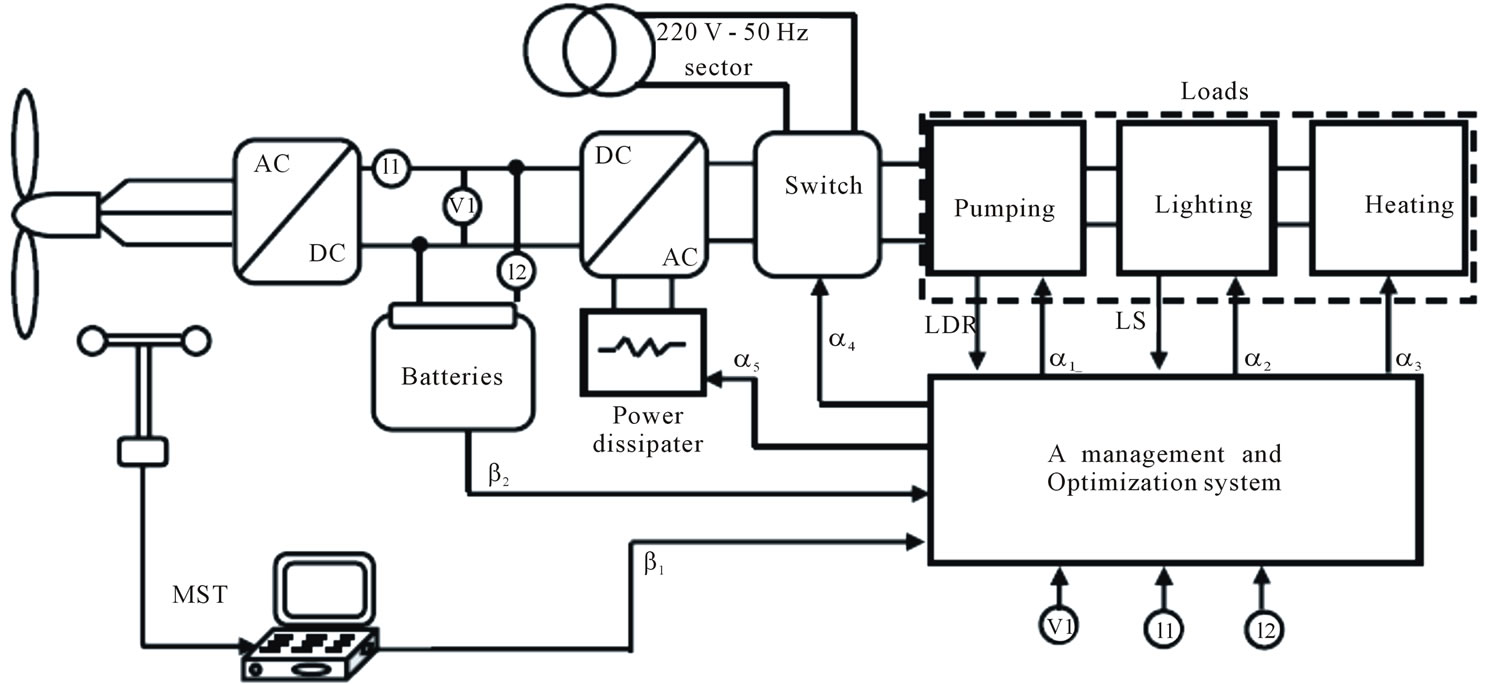
Figure 1. Architecture of the proposed management and optimization system.
• Non-controlled 6-pulse rectifier (48 V AC - 24 V DC).
• A battery bank (12 V, 210 Ah).
• A 3 KW inverter that generated 220 V at 50 Hz which supplies a single-phase electric pump to feed water tank, lighting and heating systems in addition to a power dissipater system and• Meteorological measuring station (MST), located at a height of 8 m above the ground.
The MST is composed by an anemometer, weathervane and a computer to store data. Data provided by the station are in the form of a table containing the measurement date, the sampling period, the speed and wind direction and the temperature of the neighboring region.
In order to monitor the platform, a data acquisition system (DAQ-S) is introduced in the platform with the MST system and another system to measure and record the needed electrical parameters.
The main task of our optimal management system is to compute and deliver the required various commands for a rational distribution of electrical wind energy. Notice that, the light sensors (LDR) and the level sensors (LS) are used to provide information on lighting system and water tank storage level respectively.
2.2. Baseline Theory of Wind Energy Conversion
The well known equation of the available wind power Pw is given by the following expression:
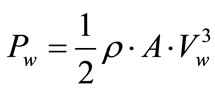 (1)
(1)
where
• is the wind density;
• A is the turbine swept area;
• Vw is the wind speed.
The wind power is converted into mechanical power Pturbine by the turbine blades, according to the equation:
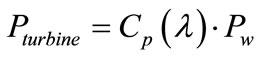 (2)
(2)
where Cp is the power coefficient of the turbine and l the specific speed which is a function of the wind speed Vw and the blade rotation speed Ω :
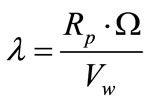 (3)
(3)
where Rp is the radius of the blades.
The generated electrical power Pe is defined by:
 (4)
(4)
hturbine is the generator’s efficiency.
2.3. Wind Energy Availability in the Studied Site
In our previous study [10], we showed that electrical supplied power of the studied platform has been modeled by:
 (5)
(5)
where Pe is the electrical power and Vw the wind speed.
Thus, a statistical study on the collected data, allowed us to estimate the potential of wind energy in the east region of Mohammedia.
In this paper, the study is focused on the resulted data base of the year 2006 as shown in Figure 2.
2.4. Electrical Power Requirement
The considered platform is used to supply electrical energy for pumping, lighting and heating systems. It is necessary to evaluate the energy need for each load.
2.4.1. Pumping System
The pump is designed to fill a water tank of volume VR (m3). The electric power Pp required to pump water at a head h and flow rate Q may be estimated as in [11] by:
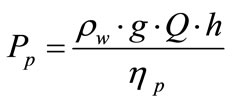 (6)
(6)
where rw is the density of water, g is the gravitational constant and hp is the pump efficiency.
The time required to fill the tank will be:
 (7)
(7)
In our case, we consider a nominal pump power ,
,  ,
,  and VR = 9 m3. So TR = 3 hours.
2.4.2. Lighting and Heating Systems
The lighting and heating systems are the second load of our platform. The lighting system includes a set of Li lamps that requires an overall power PL:
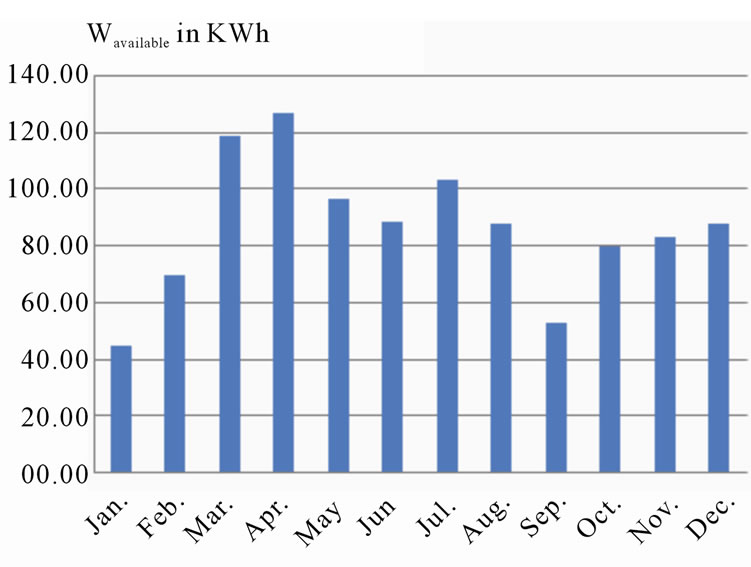
Figure 2. Potential for wind energy during year 2006.
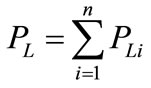 (9)
(9)
We choose n = 20 and PLi = 30 W.
In the same way, the heating system requires a global power:
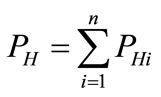 (10)
(10)
where n = 5 and PHI = 1 KW.
2.4.3. Charging Battery
The storage batteries are employed to accumulate extra energy during periods when the power generated by the wind turbine is greater than the load demand. This extra energy would be used later when the generated power is insufficient to meet the load demand.
In battery charging domain, several electronic solutions were proposed, the most relevant, was proposed by [12] in which a steady-state model of a wind-electric battery charging station was largely detailed. This study showed that using a single AC/DC converter is cheaper and the required power for charging the parallel-series combination of m*n batteries are given by:
 (8)
(8)
where Udc is the voltage at the battery terminals, Rint and Eoc are the internal parameters of each battery. The configuration used in our platform corresponds to (m,n) = (2,2).
2.5. Need of Energy
To determine the energy requirement, we referred to the features and operating conditions of each load. Thus, based on the daily weather situation in the eastern region of Mohammedia city and in accordance with solar calendar provided by [13], from which we determine the time required for lighting, based on duration day for each season. For pumping and heating, we have established the need for water and heating during the same period of year. This allowed us to compute the total amount of required energy during its defined operational time (Wtotal in KWh) per month. Table 1 summarizes these energy requirements.
From these data, we note that the heating system requires a very high energy compared with the energy provided by our platform. For this reason we will consider only the energy required for pumping and lighting systems. This energy will be denoted Wrequest. Therefore, the heating system will receive the extra energy Wextra. Where:
 (9)
(9)
The extra energy needed will be supplied by the 220 V -50 Hz sector. Notice that the available energy (Wavailable) can be provided by the wind generator and/or the storage battery. In the case of satisfaction of all the load needs, the charge controller is switched to the power dissipater.
3. Optimal Management System of the Platform
After the identification stage of the available and the required energy, we developed a strategy to distribute the available energy over the different loads during the year.
3.1. Monthly Energy Analysis
Here, we propose a statically analysis approach which is based on monthly averages data. The curves, in Figure 3, show the evolution of various energies per month. We see that needed energy for pumping system and lighting system are globally satisfied. The extra residual energy (Wresidue) may be injected into the heating system. To satisfy the energy demands for heating, we will use the 220 V - 50 Hz sector. So, the sector must provide the difference:
 (10)
(10)
This analysis method allowed us to estimate the monthly energy availability of the platform. In fact, it is an approach that uses the database measurements of the meteorological station. For better accuracy, we propose a dynamic method which considers the real time sampling

Table 1. Required energy of each load per month.

Figure 3. Various energy per month.
periods to compute the energy. This approach uses the different data acquisition system measurements and distributes the available energy in real time on the different loads. This approach is detailed in the following section.
3.2. Optimization Method
The proposed solution distributes the available energy to satisfy the needs of different loads. To do this, we consider that our system is composed of a generator providing power Pg and loads requiring power Pu.
3.2.1. Generator
We consider the system “wind turbine and batteries” as an energy source providing a variable power Pg(t). At each time t, Pg(t) depends on the wind speed and the charge level of the batteries. Pg(t) is expressed by :
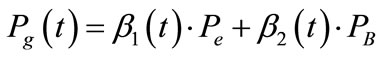 (11)
(11)
where Pe is the nominal power of the wind turbine and PB is the nominal power of the batteries. The parameters b1(t) and b2(t) describe the status of the wind turbine and batteries respectively:
 . (12)
Notice that:
• b1(t) = 0: Wind turbine is unable to start i.e. Pe = 0;
• b1(t) = 1: Wind turbine runs at its nominal speed, i.e. Pe = Penominal.
In Figure 4 we show the transfer curve of our wind turbine and its useful zones according to the coefficient b1(t).
• b2(t) > 0: batteries are in supplying mode and deliver the power b2(t).PB.
• b2(t) < 0: batteries are in charging mode and receive the power b2(t).PB.
Finally at each moment, the generator must guarantee a power Pg to satisfy the power Pu required by the use.
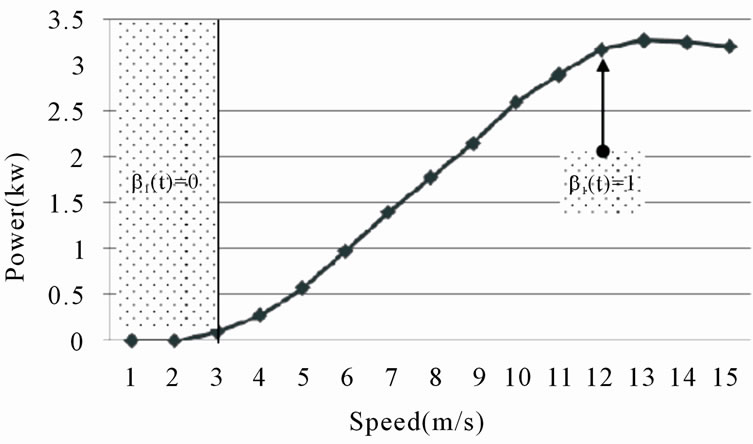
Figure 4. Transfer curve and useful zones of the wind turbine.
This means that the system must satisfy the balancing criterion Pg(t) = Pu(t).
3.2.2. Load Features
Our load system is composed by three kinds of charge associated to their power consumption respectively:
• A pump: Pp;
• A lighting system of n lamps: PL;
• A heating system: PH.
The power required changes instantaneously and depends on conditions of use.
This power is expressed by:
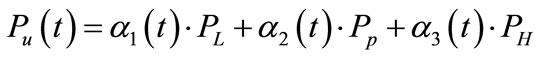 (13)
(13)
The ai = 1,2,3 are adjusted automatically according to the available power and conditions of use to preserve the balancing criterion. To do so, at each sampling time Ti, we must determine Pg(Ti) and calculate Pu(Ti) in order to have  and retain this equality over
  interval. At
 , we measure the power generator (wind generator and batteries) and adjust each ai in order to ensure
  and retain this equality over the interval
 , etc…
To achieve this energy dsitribution, we compute the total available energy  so it must be identical to the total energy required for each load. Notice that
  where we assume that
  is constant over the interval
 .
.
3.2.3. Management Procedure and Condition of Use
The balancing condition search uses the coefficients  that depend on some conditions previously set by the operating mode of loads. For example, the conditions at night are not the same during the day. Similarly, the energy demand varies from month to month depending on the season in question.
We notice here some constraints on the operating mode of the system:
• If it’s dark, the lighting must have the highest priority over other loads, so . In addition, we consider a minimum of power PLmin of 500W ensuring proper lighting of the area in question. If the available power at a time t is below this limit, the difference is supplied by the 220 V - 50 Hz sector by
 .
.
• During the day . All available energy is directed toward pumping, if necessary, even if the batteries are empty. In the case where
 , extra energy is directed to the batteries at first, if necessary, and to the heating system at the second time. Finally, the remained extra energy is routed to the power dissipater.
Generally:
• The battery charging is ensured only if the needs of users is satisfied (no lighting and no pumping) or in case of extra energy.
• The heating control is done only when extra energy is notified. The cases where batteries are full, lighting and pumping are satisfied. If there is no need, this extra energy is routed to the power dissipater system by adjusting .
.
• The 220 V - 50 Hz sector supplier is used only to provide the additional energy when need is.
3.2.4. Processing Procedure
The flowchart of the processing procedure is shown in Figure 5. To achieve this task, we need some procedures. First, we measure the wind speed Vw and the batteries states by b2. Then we calculate the power Pg as described in (11). This will allow us to compute the available energy Wavailable at any sampling slot time Ti by:
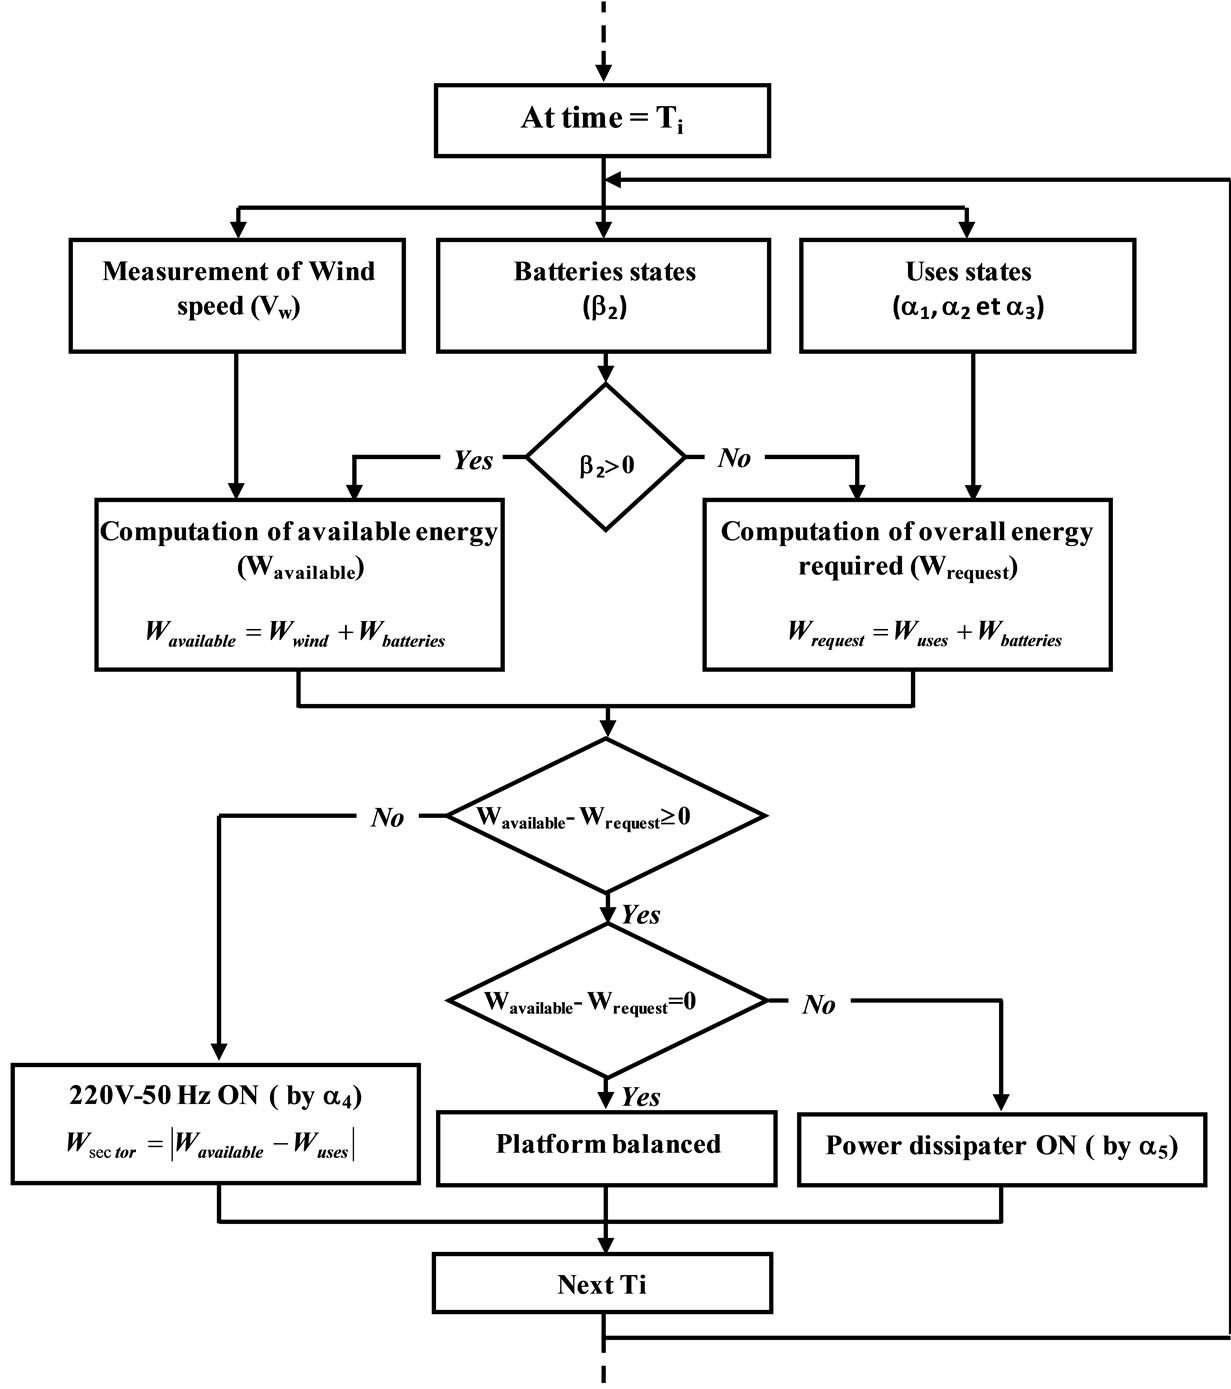
Figure 5. Management and processing procedure.
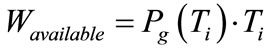 (14)
(14)
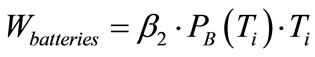
The total energy required Wrequest is also determined basing on the states of loads, called ai=1,2,3, and the batteries states b2:
 (15)
(15)
where
 (16)
(16)
Pu(Ti) is evaluated by (13) at the time t = Ti and
 (17)
(17)
Finally, we perform some tests to assign the energy to continuously satisfy the needs of each load.
4. Results and Discussion
In this section, we present the simulation results of our approach. We consider data collected of one day (December 1, 2006) with a sampling period of 5 minutes. In Figure 6(a), we present the different power curves before performing the proposed optimization approach. When the power Pextra is positive or null, it means that all the load needs are satisfied. Otherwise, it means that the sector supplier must provide the difference. This is to satisfy the required power for lighting and pumping systems. The execution of our optimization approach brings up other values of the power requirement taking into account the operating conditions of lighting and pumping systems (Figure 6(b)). When the available power is null, this means that the sector must supply the overall power to satisfy the loads needs. Notice that during the considered day of study, the loads needs are satisfied from 00:00 until 2:15 am. Otherwise, the sector must provide the energy needed to meet the loads requirements. The available power, in Figure 6(c), is distributed over the different loads depending on the operating conditions previously set. Figure 6(d) shows the power required for the lighting system belongs to the interval [500 W, 600 W]. The power distribution for the pumping system is shown in Figure 6(e) The extra power of Figure 6(f) must be routed to the batteries to fill the deficit of charge. Otherwise it will be dissipated in the power dissipater. Finally, the Figure 6(g) depicts the reduction of sector supplier power by the proposed optimization method. In this figure, the dashed curve PsectorI shows the needed power that the sector must provide during the 24 hours of the day in study. This means that during these 24 hours, the sector had to produce 13.2 KWh.
 (a)
(a)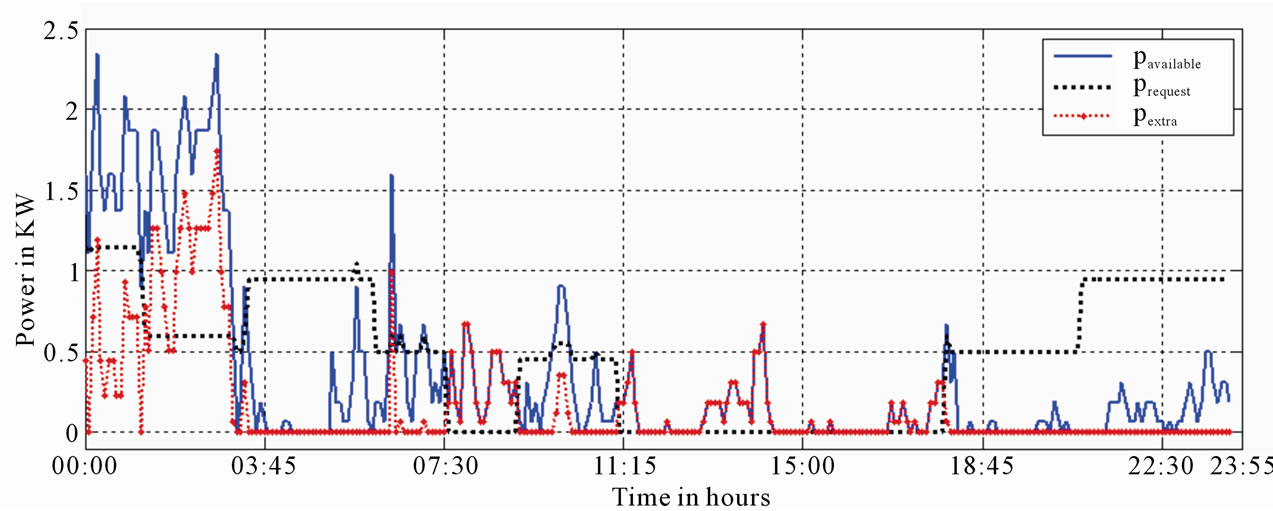 (b)
(b)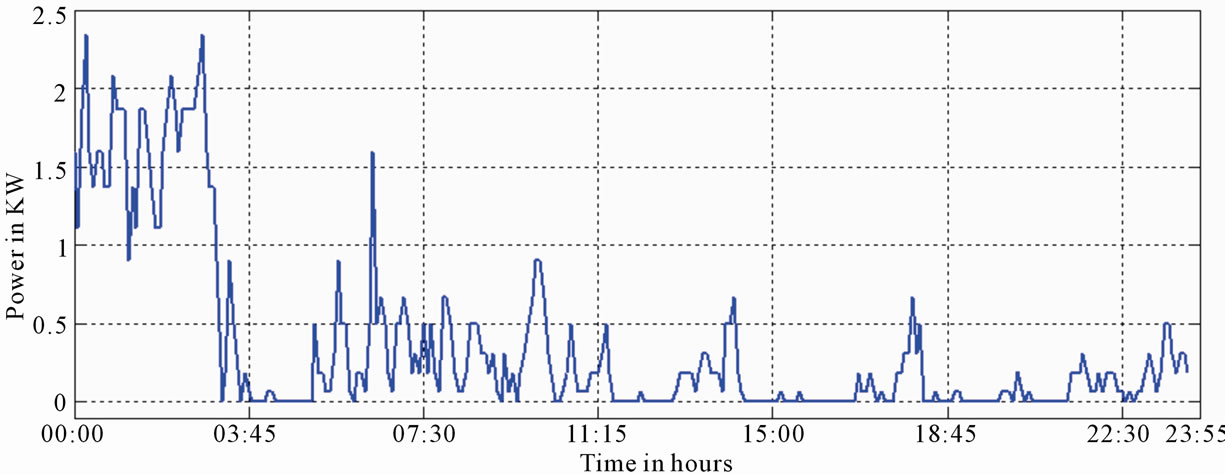 (c)
(c) (d)
(d) (e)
(e) (f)
(f)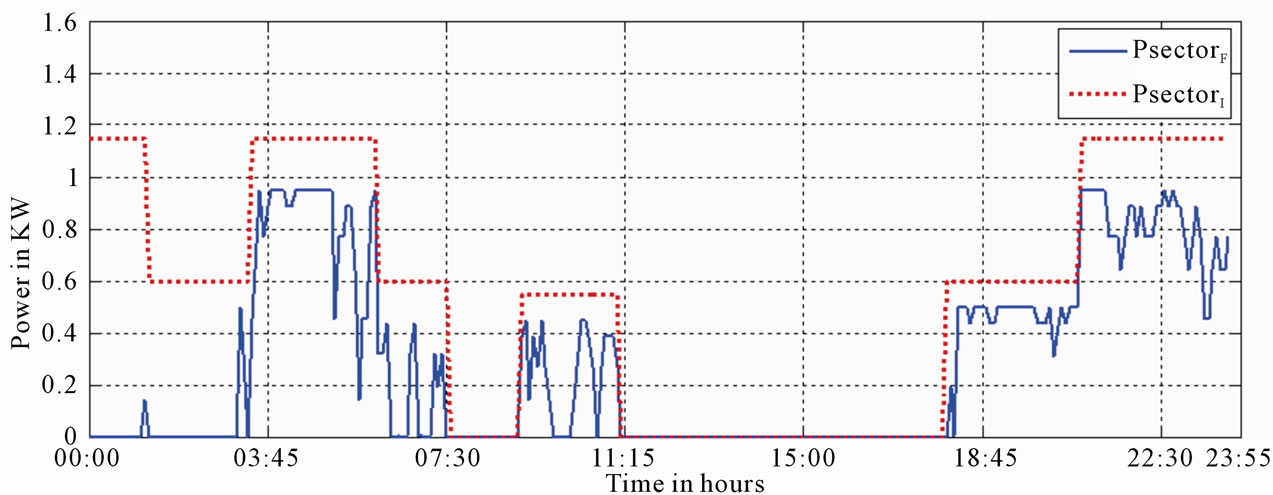 (g)
(g)
Figure 6. (a) Waveforms of powers before application of optimization approach; (b) Waveforms of powers after application of optimization approach; (c) Available power; (d) Lighting power need; (e) Pumping power need; (f) extra power (g) Sector supplier power.
The second curve named PsectorF shows the power supplied by the sector using our management system. In this case, the required energy is only 4.66 KWh, i.e. our system has saved 8.54 KWh during this period (24 hours). The difference between the first and the second curves correspond to the notified gain by our system.
5. Conclusions
In this paper, we have proposed a smart approach to optimize the energy use of a wind energy station. It is a dynamic method for exploiting the available energy during a sampling period. Simulation results have shown that during the considered 24 hours, the available energy during each sampling period was spread over the different loads in order to minimize the contribution of the 220 V - 50 Hz sector. Notice that, using our system, we have saved 8.54 KWh that the sector had to provide during those 24 hours.
As a following perspective of this work, we will enhance this smart system by a suitable choice of the different electronic and electric components of our circuit system. Furthermore, we will define a hard control strategy to seek smoothly the system components. Finally, the developed management system will be implemented as a smart chip.
REFERENCES
- M. S. Miranda, “Analysis of a Wind Electric Pumping System Using Isolated Induction Generator,” M. Sc. Thesis, PPGEE-UFMG, Belo Horizonte, 1997 (in Portugues).
- B. D. Vick and R. N. Clark, “Ten Years of Testing a 10 KW Wind Electric System for Small Scale Irrigation,” ASAE Annual International Meeting, Orlando, 1998, p. 984083.
- O. Badran, “Wind Turbine Utilization for Water Pumping in Jordan,” Journal of Wind Engineering and Industrial Aerodynamics, Vol. 91, No. 10, 2003, pp. 1203-1214. doi:10.1016/S0167-6105(03)00073-4
- M. S. Miranda, O. C. lya Rinato and R. S. Selênio, “An Alternative Isolated Wind Electric Pumping Sysytem Using Induction Machine,” IEEE Transaction on Energy Convers, Vol. 14, No. 4, December 1999, pp. 1611-1616.
- B. D. Vick and R. N. Clark, “Testing of 2-Kilowatt Wind Electric System for Water Pumping,” Proceeding of Wind Power 2000 Annual Conference, Palm Springs, 2000, pp. 9-19.
- M. Velasco, O. Probst and S. Acevedo, “Theory of Wind Electric Water Pumping,” Science Direct, Renewable Energy, Vol. 29, No. 6, 2004, pp. 873-893. doi:10.1016/j.renene.2003.10.001
- D. D. Lara, G. G. Merino, B. J. Pavez and J. A. Tapia, “Efficiency Assessment of Wind Pumping System,” Energy Conversion and Management, Vol. 52, No. 2, 2011, pp. 795-803. doi:10.1016/j.enconman.2010.08.004
- H. M. de O. Filho, R. P. T. Bascopé, L. H. S. C. Barreto, F. L. M. Antunes and D. S. Oliveira Jr. “Control Design of Converters for Wind Energy Conversion Systems Applied to Battery Charging,” VIII Conferência Internacional de Aplicaçöes Industrials, Poços de Caldas. Induscon, 2008.
- I. R. Machado, D. de S. O. Jr., L. H. S. C. Barreto and H. M. de O. Filho, “Small Size Wind Generation System for Battery Charging,” International Conference on Renewable and Power Quality, Sevilla, 28-30 Mach 2007.
- A. Hamdoun, O. Bouattane, A. Raihani and A. Mesbahi, “Caractérisation et Evaluation Energétique D’Une PlateForme Eolienne,”6 ème Rencontre Nationale des Jeunes Chercheur en Physique 24 et 25-12-09, Casablanca, Décembre 2009.
- M. Sathyajith, “Wind Energy: Fundamentals, Resources Analysis and Economics,” Springer Berlin Heidelberg New York, 27 February 2006, pp. 132-151.
- V. Gevorgian, D. A. Corbus, S. Drouilhet and R. Holz, “Modeling, Testing, and Economic Analysis of A WindElectric Battery Charging Station,” Windpower’98 Blakersfield California, 27 April - 1 May 1998.
- http://www.ephemeride.com/calendrier/solaire/19/?