Journal of Power and Energy Engineering
Vol.04 No.09(2016), Article ID:70919,16 pages
10.4236/jpee.2016.49006
Simple DSP Implementation of Maximum Power Pointer Tracking and Inverter Control for Solar Energy Applications
Woonki Na1*, Thomas Carley2, Luke Ketcham2, Brendan Zimmer3, Pengyuan Chen1
1Department of Electrical and Computer Engineering, California State University, Fresno, CA, USA
2Caterpillar Inc., Peoria, IL, USA
3Robert Bosh Inc., Detroit, MI, USA

Copyright © 2016 by authors and Scientific Research Publishing Inc.
This work is licensed under the Creative Commons Attribution International License (CC BY 4.0).
http://creativecommons.org/licenses/by/4.0/


Received: June 3, 2016; Accepted: September 25, 2016; Published: September 28, 2016
ABSTRACT
In this paper, a simple Digital Signal Processor (DSP) based Maximum Power Pointer Tracking (MPPT) control and Inverter Control is presented for solar energy applications, especially photovoltaic and wind energy systems. The proposed MPPT controlled boost converter is able to reduce the inrush current and the overshoot of the output voltage of the system. Details of the proposed Maltab-Simulink based MPPT and Inverter Control are shown and implemented using a DSP. The proposed system is analyzed and simulated for verification. To validate the system, a 100 W prototype test-bed is built and tested. The results show that the proposed system can be applicable for solar energy applications.
Keywords:
DSP, MPPT, Inverter, Solar Energy

1. Introduction
Solar and wind energy systems have become increasingly popular as the desire for clean energy has grown. Typically, these energy systems consist of buck or boost converter and DC/AC inverter. For instance, a solar power converter incorporates a photovoltaic panel, buck or boost converter (DC/DC converter) depending on the input voltage level, and inverter system to create 60 Hz, or 50 Hz AC grid power [1] [2] . Also, Maximum Power Point Tracking (MPPT) algorithm plays an important role in the DC/DC converter to extract the maximum power under any circumstance. Up to date, various MPPT algorithms have been developed [3] - [14] .
In order to achieve the maximum power point (MPP) of photovoltaics, MPPT algorithms are normally used. One of MPPT algorithms, Incremental Conductance (INC) algorithm mainly relies on the tangential value of the photovoltaic (PV) operation point to predict the right direction of MPP. Fixed step-size INC algorithm [13] is focused on stability and effectiveness of the algorithm due to the fact that adaptive step-size could adversely affect the MPPT controller under certain circumstances with noise and condition changes, whereas the disadvantage of the fixed step-size INC is the slow response to the environmental condition changes. The other popular MPPT algorithm, Perturb & Observe (P & O) can iteratively perturb the PV voltage and observe the changes in PV power so that it can continuously move the operation point along the direction towards the MPP. P & O algorithm does not involve derivative operations [14] and hence it would have easy implementation. However, the most of MPPT algorithm would aim at finding a MPP rather than preventing an inherent in-rush current and minimizing the overshoot of the DC/DC converter for any MPPT algorithm. In this paper, a DSP based simple soft-start MPPT algorithm, and Sinusoidal Pulse Width Modulation (SPWM) algorithm are presented. With the merit of simplicity of the Perturbation and Observation (P & O) among the MPPT algorithms, a simple soft-start MPPT is developed based on P & O. The P & O method is achieved by constantly changing the output power according to the load current direction (increasing or decreasing) [10] [11] . The proposed MPPT algorithm could be easily implemented in either solar or wind systems [12] and even could prevent from the inrush current and minimize the overshoot of the boost converter. In the inverter control, a simple Matlab/Simulink based DSP implementation method is proposed. The overall system is described in Section 2. In Section 3, DSP implementation of MPPT and inverter control is explained. Section 4, the conclusion is addressed.
2. Overall System
Based on objectives of photovoltaic systems, photovoltaic systems can be generally classified into stand-alone and grid-connected photovoltaic systems. Stand-alone photovoltaic systems are designed to supply local electric load, and generally consist of energy storage devices for meeting excessive electricity demands. Grid-connected photovoltaic systems are designed to deliver photovoltaic power to electric grids. In this section, a brief introduction of stand-alone photovoltaic systems is described because our research is focused on the stand-alone photovoltaic system.
The fundamental topology of a stand-alone photovoltaic system is shown in Figure 1.
A stand-alone system consists of the following components:
− Solar Cells/Solar Panels/Solar Arrays
− Maximum Power Point Tracking Controller
− Voltage regulator of photo voltaics
− PWM Generator
− DC-DC Converter

Figure 1. The topology of the stand-alone photovoltaic system.
− DC Electric Load
− DC-AC Inverter (Optional).
Prior to addressing the MPPT algorithm, the overall hardware set up is described in this section. In the hardware setup, a conventional boost power converter is built for solar applications as seen in Figure 2. First, the DC voltage from a photovoltaic panel is stepped up using a boost converter. A Maximum Power Point Tracking (MPPT) algorithm based on Perturb and Observe method can control the duty cycle of the boost converter to ensure the maximum possible power drawn from the panel. The purpose of the boost converter in this system is to take the input voltage from the photovoltaic panels and boost it to a voltage being high enough for the inverter to convert the DC voltage to 120 volt AC (rms), for a conventional utility power supply. In order to build a 100W small prototype system as seen in Figure 3, two solar panels, the model number is BP350J [14] are used, which can provide up to 50 watts of power. It has a nominal voltage of 12 V. The MOSFETs, inductor, diode, and capacitor were well chosen with consideration of current and voltage ratings. This means that the MOSFET has to have a high breakdown voltage, and be able to withstand high currents. The MOSFET chosen for the hardware setup is the IRFP4768PbF [15] , which has a breakdown voltage of 250 V. and a maximum of the drain current of 93 A. The diode, D1 chosen is the HFA50PA60C [16] . This is an ultrafast diode with a reverse recovery time of 50ns. The reverse voltage is 600 V and forward current is 25 A. The inductor and capacitor were chosen by considering voltage and current ratings in our system.
Figure 3(a) of Figure 3 shows the solar panel used in this research and Figure 3(b) of Figure 3 shows an experimental set up DC/DC boost converter. The simulation results in Figure 4 are of the boost converter turning on to 70% duty cycle, boosting an input voltage from 20 V to 66 V. In Figure 4, the voltage is seen to spike above the expect output voltage and then slowly settle down. Much like the output voltage, there is a

Figure 2. Overall system configuration.
 (a)
(a)
 (b)
(b)
Figure 3. Hardware setup. (a) Solar panel; (b) Boost converter.
large spike in current as the boost converter turns on. This is because of the large value of the output capacitance. If the boost converter was turned on slowly by using software implemented soft start that slowly incremented the duty cycle on turn on, these spikes can be avoided.
3. DSP Implementation of Maximum Power Pointer Tracking and Inverter Control
3.1. MPPT (Maximum Power Pointer Tracking) Algorithm
Maximum Power Point Tracking (MPPT) controllers are popular in both stand-alone
 (a)
(a) (b)
(b)
Figure 4. Boost converter simulation results. (a) Output voltage; (b) Inductor current.
and grid-connected photovoltaic systems. A MPPT controller can be designed as a physical analog circuit as an embedded system. The main objective of a MPPT controller is to extract potential maximum power from photovoltaic cells by continuously perturbing the operation point of the photovoltaic cells. The operation point of photovoltaics consists of two parameters, the photovoltaic voltage and photovoltaic power. It can be treated as a point on a P-V curve. The operation point will reach the maximum power point if the MPPT controller rationally perturbs the photovoltaic voltage. At the end of every control interval, a new photovoltaic voltage reference is calculated by the MPPT algorithm and sent to the photovoltaic voltage regulator. Recently, even though numerous MPPT algorithms have been researched [1] - [12] , the adopted MPPT algorithms of commercialized solar energy applications are still based on the conventional Perturb & Observe (P & O) algorithm due to its easy implementation and robust performance. A Voltage Regulator of photovoltaic cells is essential for a MPPT controller. The voltage regulator is to make the photovoltaic voltage trace its reference value, which is provided by the MPPT algorithm. There are few MPPT research papers that mention photovoltaic voltage regulators by showing a PI/PID controller in their control loop. The fulfillment of the photovoltaic voltage regulation requires a proper compensator which can improve the transient response of a photovoltaic system. The design of such a compensator must consider the photovoltaic model and its associated power electronic system. The proposed feedback control loop for the voltage regulation is shown in Figure 5. The fundamental control signal of a photovoltaic system is a Pulse-Width-Modulation (PWM) signal, which can be generated by an analog circuit or by a microcontroller. In a photovoltaic system, the PWM signal causes the system to perform two structures in every switching interval. The widths of switch-on and switch-off intervals determine system dynamics. In other words, by changing the duty- ratio of the PWM signal, the DC-DC converter (which is shown in Figure 1 and Figure 6) can change the proportion of its input terminal voltage to its output terminal voltage. The equivalent internal impedance of PV cells is able to be perturbed. In consequence, the photovoltaic power can be changeable [11] .

Figure 5. The topology of the voltage regulation of a photovoltaic system.

Figure 6. Boost converter with its PWM signal.
A DC-DC converter can step-up/step-down the voltage level of its input DC power. In a photovoltaic system, the input photovoltaic voltage level may not exactly meet the requirement. Therefore, the first objective of a photovoltaic DC-DC Converter is to change the voltage level of input photovoltaic power. The second objective is to realize the voltage regulation of photovoltaics, as associated with a voltage or current control.
Several MPPT algorithm research assumed that the electric load of photovoltaic MPPT systems can be only resistive. Such assumption may be impractical. The transient response of a power converter may be undesirable and unpredictable if electric load is only resistive. Thus, the output voltage regulation of the converter is to be considered. To avoid the above issue related to the converter’s output voltage regulation, the appropriate electric load for a stand-alone photovoltaic system should consist of depth-recycled batteries and ultra-capacitors. These can absorb the increasing photovoltaic power, and stabilize the voltage of the output terminal at a relative fixed level if the load’s capacitance is sufficiently large so that MPPT can effectively work in the system. However, in our research, the output voltage regulation depending on the load parameter is out of scope of the paper because to design the output voltage regulation of the system, a detailed small signal model based transfer function is to be derived in the case of adopting a linear voltage regulator. By the way, aforementioned, a MPPT algorithm based on Perturb and Observe is used for the system. Perturb and Observe (P & O) introduces an initial perturbation to the boost converter voltage by changing the gate signal duty cycle and then observations are made using sensing circuitry to change the gate signal duty cycle to move closer to the Maximum Power Point (MPP). Perturb and Observe uses voltage and current measurements to calculate change in power over a change in time (∆P) and change in the duty cycle (∆D) of the signal sent to the gate of the switch in the boost converter.
Given that ∆P and ∆D can be either positive or negative respectively, there are four cases to determine whether the duty cycle of the gate signal should be increased or decreased as shown in Table 1. The case 1, when power has increased and the duty cycle has increased, the duty cycle should continue to increase toward the MPP. The case 2 is similar except the duty cycle should continue to decrease toward the MPP. The cases3 and 4 occur when the power has decreased, so the duty cycle has moved the PV voltage away from the MPP. The duty cycle is then reversed. It is decreased in the case 3 and increased in the case 4. The flowchart in Figure 7 explicitly explains the P & O algo-

Table 1. P & O cases.

Figure 7. Boost converter simulation results. (a) Output voltage; (b) Inductor current.
rithm. A Simulink DSP Program Model for the MPPT algorithm in Figure 8 starts with basic testing of the Analog to Digital Conversion (ADC) inputs. Voltages from the voltage sensing circuit were read into the Texas Instrument 32-bit fixed-point DSP TMS320F2812 [17] and were validated on the scope functionality in Code Composer Studio software developed by Texas Instrument. The ADC is set to read in measurements every 100 µs. Once the sensing voltages are read a windowed average of 1 sec is taken to increase the accuracy of the measurements. Gain blocks are used to account for the voltage division of the voltage sensor and to convert from Volts to Amps for the current sensor. A product, unit delay, and sum blocks are used to find the change in power over the averaged 1 sec measurement. Similarly two unit delay blocks and a sum block are used to find change in duty cycle over the 1sec time period. A product block

Figure 8. Simulink model for MPPT and soft start block.
is used to determine if the duty cycle will increase or decrease. A sub-process block was made in Simulink to increase, or decrease the duty by 1%. If the input to the block is less than zero the output is −1, if the input to the block is greater than zero the output is +1, and if the input to the block is equal to zero the output is +0.01 for an offset. As shown in Figure 9, the soft start increases the duty cycle by 5% every 5 sec until 40 sec where the duty cycle is at 30% and is then controlled by the MPPT updated every 1 sec.
3.2. Performance of the Conventional P & O MPPT
This section discusses the performance of the conventional P&O algorithm. The conventional P & O algorithm generally exhibits a trade-off between the tracking velocity and MPPT efficiency. This nature can be seen by simulating behaviors of the conventional P & O algorithm with two different perturbation intensities, 0.1 V and 2.0 V. In this simulation, the perturbation frequency is set to 1 Hz. In the following analysis, the term “perturbation intensity” is denoted by “p-i”. Figure 10 illustrates that the P & O algorithm with larger perturbation intensity shows a faster tracking velocity, while Figure 11 shows that the algorithm with a weaker perturbation intensity presents a higher MPPT efficiency by comparing both average powers with different perturbation intensity.
3.3. Inverter Control
Many photovoltaic systems are designed to supply to AC loads, like motors or pumps.

Figure 9. P & O simulation duty cycle output (%) based on time change (0 - 100 sec).

Figure 10. Power with different intensities

Figure 11. Power with different intensities.
In such case, a DC-AC Inverter is added into the system topology. A DC-AC Inverter can be directly cascaded to a DC-DC converter, or can be connected to the medium energy storage devices, such as ultra-capacitors and batteries. The fundamental components of a grid-connected photovoltaic system involve photovoltaic arrays and a DC-AC inverter. The basic topology is shown in Figure 12. To convert the standard AC power (120 V/60 Hz), the required voltage level of the input DC power should be greater than 240 V[Volt]. However, to meet this voltage requirement, the size of the input photovoltaics has to be enlarged.
As seen in Figure 1 and Figure 12, the inverter takes the DC output of the boost converter or the Photovoltaic array directly, and turns it into AC power. The inverter uses a classical H-Bridge topology shown in Figure 13. The H-bridge is comprised of a voltage source (Vd) and four power switches. A purely resistive load (Rload) is also shown in Figure 13, but in the test LC filter is connected before Rload. To produce AC power at the load a method known as Sinusoidal PWM (SPWM) is used. An excellent description of SPWM is given in papers [18] [19] . To generate an AC output with frequency f1, a sinusoidal control signal Vcontrol at frequency f1 is compared with a triangular waveform Vcarrier as shown in Figure 14. When Vcontrol is greater than Vcarrier the PWM output is HIGH, otherwise the PWM output is LOW. The frequency of the carrier (fcarrier) determines the switching frequency of the inverter (fs).

Figure 12. The topology of a grid-connected inverter.
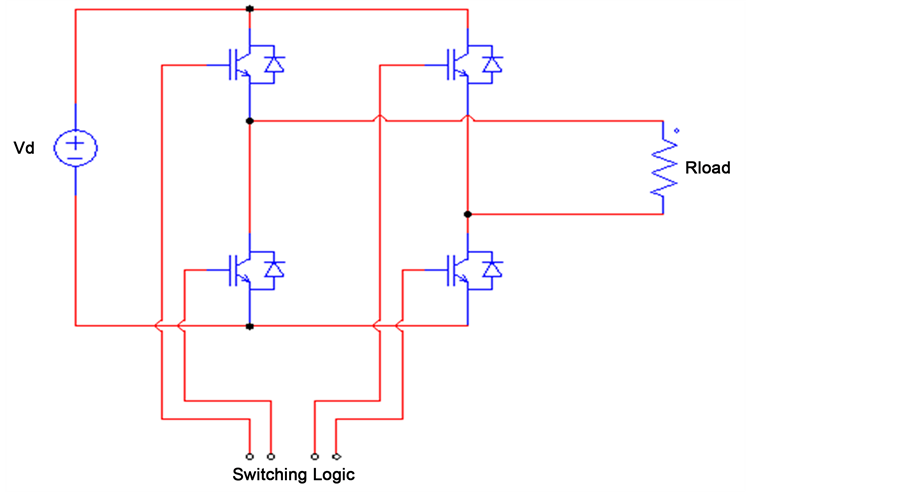
Figure 13. Single phase inverter schematic with a resistive load.

Figure 14. Bipolar SPWM Description (mi = 0.8, mf = 15).
An important ratio called the modulation index (mi) can be described as:
 (1)
(1)
Also, the modulation ratio (mf) can be defined as:
 (2)
(2)
An important feature of SPWM is that it allows for the control of the output frequency and the control of the out-put voltage amplitude. The output frequency and output amplitude are governed by the following equations:
 (3)
(3)
 (4)
(4)
These Equations(1) - (4) mean that the output voltage frequency is the same as the control signal frequency, and the peak value of the fundamental output component can be controlled by varying the modulation index mi. To create the SPWM signals a TMS320F2812 DSP based eZdsp [20] prototyping board was used. A Simulink block diagram and the auto-code generation tool were used to create a program for the DSP board. Software called Code Composer Studio sends the program to the DSP board. Code Composer Studio also allows for real time debugging of the DSP. A software to create the Bipolar SPWM signals is included in a Matlab/Simulink file called inverter_bipolar.mdl in Figure 15. A novel way to create the SPWM signals can be achieved by directly feeding a specialized sine wave into a PWM block. The PWM block accepts values between 0 and 100. The values correspond to the negative duty (in percent). For example, to create a 20% positive duty cycle, a value of 80 should be input to the PWM block. In Figure 16, the PWM output pairs 1, 2 (W1) and 3, 4 (W2) are used. The input to W1 creates the output on PWM output 1. PWM output 2 is automatically created as the logical inverse of PWM output 1. Likewise W2 corresponds to PWM output 3, and PWM output 4 is automatically created as the inverse of PWM output 3.
In Figure 10, the modulation index is a function of the Amplitude and Bias parameters. Bias should always be set to 50. The equation for Amplitude is given as:

Figure 15. Screenshot of Inverter_bipolar.mdl.

Figure 16. Setting of Sine Wave block.
 (5)
(5)
For example: for a modulation index of 0.7, set Bias to 50 and Amplitude to 35. An alternative way to set amplitude of the sine wave (hence setting the modulation index) would be set to Amplitude and Bias to 50 and use a gain block at the output of the sine block. In this case the gain would directly correspond to the modulation index. Table 2 shows the operating parameters of the inverter for the experimental set up.
The frequency of the reference sinusoid can be set by entering the desired frequency (in radians/sec) into the Frequency parameter. The Sample time field dictates the frequency of the carrier, fcarrier. Figure 17 shows the connection diagram between the DSP PWM outputs and the individual IGBTs. Note that the gate drives have not been shown in Figure 17. To test the small-scale operation of the solar inverter system a DC power supply was connected to the boost converter to mimic the DC output of a solar panel. The output waveform of the filter was then recorded with an oscilloscope, as shown in Figure 18. Fast Fourier Transform (FFT) analysis was performed on the signal to check the output frequency. Figure 18 shows a sinusoidal output of the LC filter in the upper

Figure 17. Connection between DSP and inverter.

Figure 18. Inverter output experimental result with FFT analysis.
Table 2. Operating parameters.
half of the plot. The lower half of the plot is the frequency spectrum of the output. The output signal is 15 Vpp. The large DC component at the fundamental frequency, 60 Hz in the FFT analysis is shown because the output is operating at 60 Hz. The almost complete absence of spikes at other frequencies indicates there is little harmonic distortion at the output voltage.
4. Conclusion
In this paper, a simple DSP implementation for a soft start based Perturb & Observation based MPPT algorithm and inverter control has been presented for solar energy applications. To validate the proposed MPPT algorithm and inverter control, a 100 W test-bed is built and tested. The proposed MPPT algorithm and inverter control are simply implemented in Matlab/Simulink based DSP program for a solar application. The results show that it could successfully reduce the inrush current and the overshoot of the output voltage in the system by changing the duty cycle gradually under consideration of the MPPT algorithm, and its inverter control is also successfully implemented in terms of reducing harmonic distortion.
Cite this paper
Na, W., Carley, T., Ketcham, L., Zimmer, B. and Chen, P.Y. (2016) Simple DSP Implementation of Maxi- mum Power Pointer Tracking and Inverter Control for Solar Energy Applications. Journal of Power and Energy Engineering, 4, 61- 76. http://dx.doi.org/10.4236/jpee.2016.49006
References
- 1. Blaabjerg, F., Love, T., Terekes, T., Teodorescu, K.M. (2011) Power Electronics: Key Technology for Renewable Energy Systems. Power Electronics, Drive Systems and Technologies Conference, Tehran, 16-17 February 2011, 445-466.
- 2. Blaabjerg, F. and Chen, Z. (2003) Power Electronics as an Enabling Technology for Renewable Energy Integration. Journal of Power Electronics, 3, 81-89.
- 3. Enslin, J.H.R. and Snyman, D.B. (1991) Combined Low-Cost, High-Efficient Inverter, Peak Power Tracker and Regulator for PV Applications. IEEE Transactions on Power Electronics, 6, 73-82.
http://dx.doi.org/10.1109/63.65005 - 4. Hussein, K.H., Muta, I., Hoshino, T. and Osakada, M. (1995) Maximum Photovoltaic Power Tracking: An Algorithm for Rapidly Changing Atmospheric Conditions. Proceedings of the Institution of Electrical Engineers, 142, 59-64.
- 5. Hua, C., Lin, J. and Shen, C. (1998) Implementation of a DSP-Controlled Photovoltaic System with Peak Power Tracking. IEEE Transactions on Industrial Electronics, 45, 99-107.
http://dx.doi.org/10.1109/41.661310 - 6. Koizumi, H., et al. (2006) A Novel Microcontroller for Grid-Connected Photovoltaic Systems. IEEE Transactions on Industrial Electronics, 53, 1889-1897.
http://dx.doi.org/10.1109/TIE.2006.885526 - 7. Roman, E., et al. (2006) Intelligent PV Module for Grid-Connected PV Systems. IEEE Transactions on Industrial Electronics, 53, 1066-1073.
http://dx.doi.org/10.1109/TIE.2006.878327 - 8. Noguchi, T., et al. (2002) Short-Current Pulse-Based Maximum-Power-Point Tracking Method for Multiple Photovoltaic-and-Converter Module system. IEEE Transactions on Industrial Electronics, 49, 217-223.
http://dx.doi.org/10.1109/41.982265 - 9. Tafticht, T., Agbossou, K., Doumbia, M. and Cheriti, A. (2008) An Improved Maximum Power Point Tracking Method for Photovoltaic Systems. Renewable Energy, 33, 1508-1516.
http://dx.doi.org/10.1016/j.renene.2007.08.015 - 10. Gow, J. and Manning, C. (2000) Controller Arrangement for Boost Converter Systems Sourced from Solar Photovoltaic Arrays or Other Maximum Power Sources. Proceedings of the Institution of Electrical Engineers, 147, 15-20.
- 11. Enslin, J., Wolf, M., Snyman, D. and Swiegers, W. (1997) Integrated Photovoltaic Maximum Power Point Tracking Converter. IEEE Transactions on Industrial Electronics, 44, 769-773.
http://dx.doi.org/10.1109/41.649937 - 12. Tse, K.K., et al. (2004) A Comparative Study of Maximum-Power-Point Trackers for Photovoltaic Panels Using Switching-Frequency Modulation Scheme. IEEE Transactions on Industrial Electronics, 51, 410-418.
- 13. Kollimalla, S.K. and Mishra, M.K. (2014) A Novel Adaptive P&O MPPT Algorithm Considering Sudden Changes in the Irradiance. IEEE Transactions on Energy Conversion, 29, 602-610.
- 14. http://www.solarelectricsupply.com/media/custom/upload/BP-350J.pdf
- 15. http://www.irf.com/product-info/datasheets/data/irfp4768pbf.pdf
- 16. http://www.vishay.com/docs/94074/vs-hfa50pa.pdf
- 17. http://www.ti.com/product/tms320f2812
- 18. Tian, Y. (2007) Analysis, Simulation and DSP Based Implementation of Asymmetric Three-Level Single-Phase Inverter in Solar Power System. Thesis, Florida State University, Tallahassee.
- 19. Zhou, L.N. (2005) Evaluation and DSP Based Implementation of PWM Approaches for Single-Phase DC-AC Converters. Thesis, Florida State University, Tallahassee.
- 20. http://www.ti.com/devnet/docs/catalog/