Open Journal of Marine Science
Vol.3 No.4(2013), Article ID:37969,11 pages DOI:10.4236/ojms.2013.34023
Relationship between Dam Construction and Red Tide Occurrence in Small Bays and the Seto Inland Sea, Japan with Considerations from the Gulf of Mexico
Department of Biological Resources Management, School of Environmental Science, The University of Shiga Prefecture, Hikone City, Japan
Email: ueda@ses.usp.ac.jp
Copyright © 2013 Kunio Ueda. This is an open access article distributed under the Creative Commons Attribution License, which permits unrestricted use, distribution, and reproduction in any medium, provided the original work is properly cited.
Received August 19,, 2013; revised September 21, 2013; accepted October 3, 2013
Keywords: Red Tide; Siltation; Dam Construction; Small Bays; Seto Inland Sea; Gulf of Mexico
ABSTRACT
There are many papers on red tide occurrences and eutrophication. Here, we use these data to examine the relationship between dam construction and red tide occurrence in Kesennuma Bay, Dokai Bay and the small bays of the Seto Inland Sea, Japan. Here, for the first time, differences in mechanisms of red tide occurrences in these small bays are demonstrated. Mud overflowing from dams likely induces red tides in these areas as the mud flows out from the mouth of the rivers, is carried along the coast by the longshore current, and then enters and is deposited into small bays. Red tide is considered to be induced by the accumulation of mud and siltation. From data on the locations and year of red tide occurrences in the Gulf of Mexico, the same mechanism as for the occurrence of red tide in small bays of Japan was found to be applicable.
1. Introduction
Red tide occurrences are a problem in coastal areas worldwide, and red tides or harmful algal blooms are toxic to fish and shellfish. There are many reports that examine various aspects of these occurrences, especially the number, location and the causative algal species of the red tide blooms. Eutrophication specifically the transport of nitrogen, phosphorus and other nutrients from the drainage basin to the ocean, are considered to induce red tide [1-6]. Much effort has been made to eliminate nutrient inputs from the basin by taking measures such as increasing the implementation of sewer systems and decreasing the use of chemical fertilizers, but red tide occurrences have not been able to be prevented until recently, especially in Japan, as shown in my previous paper [7].
In a previous paper, I reported that there was a relationship between red tide occurrences in four bays around Japan, Tokyo Bay, Ise Bay, Osaka Bay and the Ariake Sea, and dam construction on rivers flowing into these bays [7]. Red tide occurred around the estuaries of the rivers on which dams had been constructed. Based on this finding, it was considered that eutrophication was caused by the overflow of fine particles of soils from the constructed dams causing siltation in bays.
Several reports on red tide in Japan provide abundant data [8-12]; however, these reports do not provide the analysis necessary to ascertain the causes of red tides. Bays along the coast in Japan are vast, making it difficult for one or a group of researchers to collect and analyze sufficient data to address the problem. Moreover, research focused on one bay or one sea area is not sufficient for analyzing the causes of red tide occurrences.
In my previous paper I demonstrated that there is a relationship between dam construction and red tide occurrence in the larger bays of Japan [7] based on the chronology of red tide occurrences in these bays. Therefore, the chronology of red tide occurrences is very important for this analysis. Thus, it is important to collect and analyze data from various papers to be analyzed along with the data collected by the International EMECS Center in order to identify causes of red tides [8-12].
Red tides have historically been observed in small bays, such as Kesennuma Bay in Miyagi Prefecture, as well as in the small bays of the Seto Inland Sea [8-12], and these small bays have no rivers with dams flowing into them. In this paper, I investigate the relationship between dam construction on rivers near Kesennuma Bay and in the Seto Inland Sea along with the red tide occurrence in these areas, and I compare these with red tide occurrences in the Gulf of Mexico reviewed by Magana et al. [13].
2. Materials and Methods
Of the bays of Japan, Kesennuma Bay (K) and Dokai Bay (D) were researched in detail; the chronologies of red tide occurrences, including red tide severity and period of the red tide, were collected from the literature [8- 10]. In the Seto Inland Sea of Japan, similar data on red tide occurrences concerning the area and year of red tide occurrences was collected by direct observation [11,12]. Red tide occurrences have been reported worldwide, but they are rare in the Gulf of Mexico, and the chronological red tide occurrence data reported by Magana et al. [13] for the Gulf of Mexico was used for comparison.
In the Seto Inland Sea, Harima-nada Sea (H), Suonada Sea (S), and Dokai Bay (D) were investigated in this paper (Figure 1). Information about dams in Japan was obtained from The Japan Dam Foundation website [14], and the information about dams in the United States and Mexico was obtained from a website created by C. Abeyta [15] and from Wikipedia [16], respectively.
Information about red tide occurrences in Kesennuma Bay was obtained from a paper by Ito et al. [8] on the relationship between water quality parameters and the occurrences and phytoplankton species of red tides in Kesennuma Bay. Information about red tide occurrences in Dokai Bay was obtained from papers by Yamada et al. [9,10]. Yamada et al. monitored the abundance of Skeletonema tropicum, a species responsible for red tide in Dokai Bay from 1991 to 2006, and reported monthly cell density data along with temperature and eutrophic substances, such as T-N, T-P and PO4-P. [9].
Information about red tide occurrences in the Seto Inland Sea was obtained from Setouti Net, which is part of the Enclosed Sea Net on the website created and maintained by the Ministry of the Environment [11,12]. The data sources are summarized in Table 1.
3. Results
Kesennuma Bay (K) in Tohoku District, Harima-nada Sea (H), Suo-nada Sea (S), and Dokai Bay (D) were investigated in this paper (Figure 1). In these areas, the relationship between red tide occurrence and dam construction was investigated. Results obtained in Kesennuma Bay, Dokai Bay, Suo-nada Sea and Harima-nada Sea from the chronology of red tide occurrences are shown as follows.
3.1. Kesennuma Bay
The Kitakami River in Tohoku District has many dams as shown in Figure 2. Before 1934, the Kitakami River flowed only into Sendai Bay, but the next year, the Kitakami River was separated into two branches (Figure 2): the Old Kitakami River which flows into Sendai Bay and the Kitakami River, which flows into Oppa Bay. The location of dams constructed on the Kitakami River is shown in Figure 2.
Based on a count of the number of days of red tide from the report of Ito et al. [8], the relationship between red tide occurrences in Kesennuma Bay and dam construction on the Kitakami River system was developed and is shown in Figure 3. Yuda Dam (A) was con structed

Figure 1. The areas investigated in this report are Kesennuma Bay (K) in Tohoku District, Harima-nada Sea (H), Suo-nada Sea (S), and Dokai Bay (D) in Seto Inland Sea.

Table 1. Source & year of data used in this paper.

Figure 2. Map showing the dams constructed along the Kitakami River and its tributaries, Kesennuma Bay and the other bays in Tohoku District. The dams are as follows: Yuda Dam (A) constructed in 1964, Shijyusida Dam (B) constructed in 1968, Gosho Dam (C) constructed in 1981, Kitazawa Dam (D) constructed in 1987, Ippoui Dam (E) and Irihata Dam (F) constructed in 1990, and Aratozawa Dam (G) constructed in 1998.

Figure 3. Relationship between dam construction and red tide occurrences in Kesennuma Bay. The letters A to E indicate the dams shown in Figure 2. Arrows point from the dam to the red tide occurrences attributable to the construction of these dams.
in 1964. Shijyusida Dam (B) constructed in 1968 is considered to be linked to red tide occurrences from 1972 to around 1980. Gosho Dam (C) constructed in 1981 is estimated to be linked to red tide occurrences from 1984 to 1989. Ippoui Dam (E) and Irihata Dam (F) constructed in 1990 are estimated to be linked to red tide occurrences from 1994 to 1996. But Aratozawa Dam (G), which was constructed in 1998, was linked only to low red tide occurrences observed after 2001 (Figure 3) compared with Ippoui Dam and Irihata Dam.
3.2. Dokai Bay
Dokai Bay is located in Kyushu District (Figure 1) but is treated as being part of the Seto Inland Sea (Figure 4). Dokai Bay is considered to be influenced by the Suonada Sea. The river closest to Dokai Bay is Koya River in the Seto Inland Sea. There is a possibility that the dam built on Koya River affected the occurrence of S. tropicum in Dokai Bay.
In 1990, the Yunohara (B) and Utsui (D) dams (Figures 4 and 5) were completed on the Koya River. The occurrences of S. tropicum observed in 1994 in Dokai Bay are estimated to have been induced by the construction of these dams.
In 1994, Inunaki Dam (E) (Figures 4 and 5) was constructed on the Onga River located to the west of Dokai Bay and the occurrences of red tides in Dokai Bay from 1997 to 1999 are estimated to be correlated to the completion of Inunaki Dam (E).
For purposes of analysis, the data reported by Yamada et al. [10] was transformed in this study to show the severity of S. tropicum occurrences as follows: monthly cell density of >10,000 was transformed to severity value of 5, 4000 to 10,000 was set to 4, 400 to 4000 was set to 3, 40 to 400 was set to 2, 4 to 40 was set to 1 and 0 to 4

Figure 4. The location of Dokai Bay and Kanmon Channel. Letters indicate Utanokawa Dam (A), Yunohara Dam (B), Koyagawa Dam (C), Utsui Dam (D) and Inunaki Dam (E).
was set to 0. The relationship between the red tide severity and dam construction is shown in Figure 5.
3.3. Suo-nada Sea
The number of red tide occurrences in the Suo-nada Sea was obtained from the Enclosed Sea Net [11]. The relationship between dam construction and red tide occurrence were researched here and is shown in Figure 6. Table 2 shows the main dams constructed on rivers that flow into the Suo-nada Sea.

Figure 5. Relationship between dam construction and red tide occurrence in Dokai Bay. Letters are the same as in Figure 4. Arrows point from the dam to the red tide occurrences attributable to the dams.

Table 2. Main dams built on rivers flowing into the Suonada Sea.
In my previous paper I showed the relationship between dam construction and red tide occurrence in the big bays in Japan [7]. Similar to these big bays, Figure 6 shows the correlation between the number of annual red tide occurrences in the Suo-nada Sea and the surface area of the reservoirs associated with the dams constructed in that year. Figure 6 shows that red tide occurrences showed a tendency of occurring a few years after the construction of the dam.
The earliest map of areas of red tide occurrences in the Suo-nada Sea is for 1960 (Figure 7) and the next earliest map is for 1970. Both are available on the Enclosed Sea Net [10]. In the area surrounding the Suo-nada Sea, the following dams (surface area, year of construction) were built by 1960: Saba River Dam (116 ha, 1955) on the Saba River, Kotou River Dam (249 ha, 1948) on the Kotou River and Koya River Dam (161 ha, 1955) on the Koya River. The Serikawa Dam (135 ha, 1956) and the Shinohara Dam (21 ha, 1958) were constructed on the Oita River. The Saba River is the closest river to Tokuyama Bay of the rivers on which dams had been constructed.
3.4. Harima-nada Sea
Similar to the Suo-nada Sea, the relationship between the number of red tide occurrences in the Harima-nada Sea obtained from the Enclosed Sea Net and surface areas (ha) of dams are shown in Figure 8. The main dams constructed on rivers that flow into Harima-nada Sea are showed in Table 3.
There is an obvious relationship between red tide occurrence and dam construction, similar to that found for Kesennuma Bay, Dokai Bay and the Suo-nada Sea. The increased number of red tide occurrences is markedly

Figure 6. Relationship between the number of red tide occurrences per year in the Suo-nada Sea and the surface area of dams built on the rivers flowing into the Suo-nada Sea. Arrows show correlations between dams and the number of red tide occurrences.

Figure 7. Locations of red tides observed in the Suo-nada Sea in 1960 and rivers around the Suo-nada Sea.
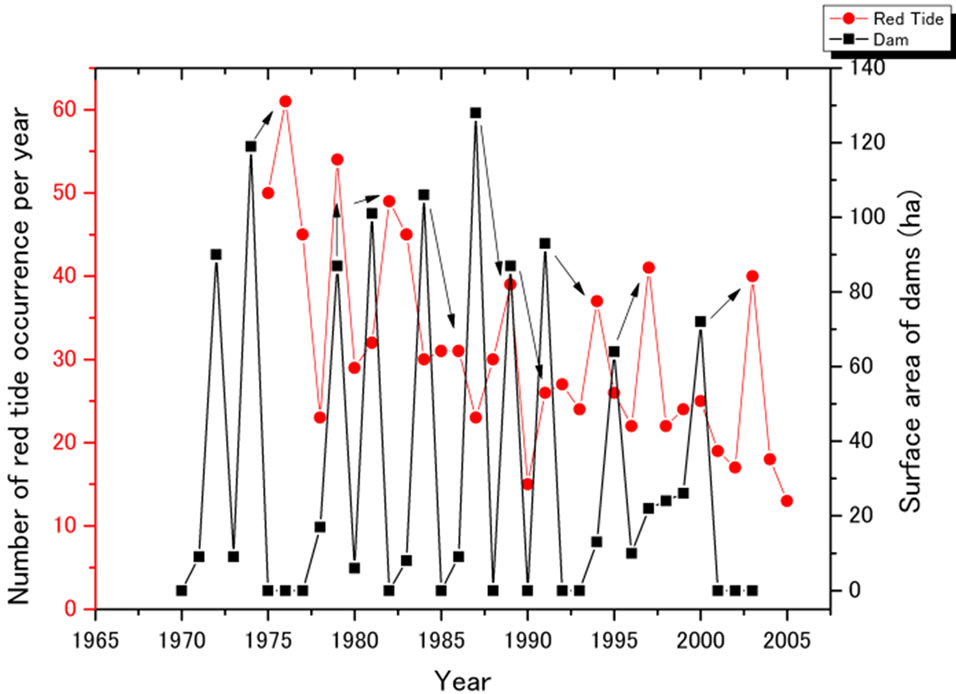
Figure 8. Relationship between the number of red tide occurrences per year in the Harima-nada Sea and the surface area of dams built on the rivers flowing into the Harimanada Sea. Arrows show correlations between dam construction and the number of red tide occurrences.
higher a few years after dam constructions (Figure 8).
Figure 9 shows the earliest map of reported coastal areas with red tide occurrences in the Harima-nada Sea. By 1960, the Asahi River Dam (421 ha, 1954) and the Yubara Dam (455 ha, 1954) had been built on the Asahi River; the Hikihara Dam (88 ha, 1957) had been constructed on the Ibo River; and the Kamogawa Dam (54 ha, 1951) and the Hunaki Dam (16 ha, 1959) had been completed on the Kako River. Two dams on the Asahi

Table 3. Main dams constructed on rivers flowing into the Harima-nada Sea.
River are considered to induce red tides around Kakuijima Island. The longshore current flowing from the Ibo River is estimated to be dispersed offshore by the Chikusa River, which has no dam and flows into the Harima-nada Sea between Kakuijima Island and the Ibo River.
Asahi River is close to the Yoshii River, but the mouths of both rivers flow into Kojima Bay and the outflow of the two rivers is considered to become one flow in Kojima Bay.

Figure 9. The location of the red tide observed in Harima-nada Sea in 1960 and rivers around Harima-nada Sea.
4. Discussion
Miyagi Prefecture reported the occurrences of red tide from 1978 to 2011 in Sendai Bay and along the Sanriku Coast, which includes Oppa Bay, Onagawa Bay, Okatu Bay, Sizukawa Bay and Kesennuma Bay [17]. In Kesennuma Bay, the number and areas of red tide occurrences were well documented along with water quality parameters by Ito et al. [7]; from 1972 to 2003 red tide occurrences continued for periods lasting from several days to over seven months.
Ito et al. [8] reported that the mud that had been estimated to be deposited at the inner part of the seafloor of Kesennuma Bay through drainage from factories and that contributed to eutrophication and phytoplankton growth, including red tide, was removed in work conducted from 1976 to 1987. Red tide occurrences in Kesennuma Bay decreased after the removal of the mud (Figure 3), demonstrating a correlation between mud accumulation and red tide occurrences.
In a previous paper, the link between mud delivered from the rivers on which dams had been constructed and red tides was clearly established. However, only one small river without a dam flows into Kesennuma Bay. The situation in Kesennuma Bay is different than that observed in other big bays along the Japan coast [7].
It is considered that mud is not necessarily introduced to bays only by a dam constructed on a river that flows into the bay but also can be carried into the bay by a nearby river. Thus, it is estimated that the Kitakami River had an influence on Kesennuma Bay due to its proximity.
In Figure 3, the construction of Aratozawa Dam was shown to be linked with only low red tide occurrences. The lack of influence due to the Aratozawa Dam is considered to be explained by the fact that the overflow from this dam flows into the Old Kitakami River and flows into Sendai Bay (Figure 2); therefore, this dam does not influence the Sanriku Coast and Kesennuma Bay.
Based on results obtained in this study, the mud that accumulates in Kesennuma Bay is estimated to be deposited by the Kitakami River. In 1995, red tide was also recorded in Shizukawa Bay located south of Kesennuma Bay and north of the Kitakami River [17]. This mud was found to be transported away from the dam and from the mouth of the Kitakami River to the Pacific Ocean where the mud is considered to not be deposited around the mouth of the river but is carried northward by longshore currents (Figure 2) as far as Shizukawa Bay and Kesennuma Bay. The longshore currents are well known to be caused by waves along the coast. After reaching Shizukawa Bay, part of the mud is estimated to be deposited in the bay due to slowing current speed, and red tide is estimated to be induced in this area. Similarly, the longshore current speed is estimated to slow after reaching Kesennuma Bay, and fine particles of mud are deposited there and are estimated to induce red tide.
Red tides were observed from 1981 to 2008 in Oppa Bay, Okatu Bay and Onagawa Bay [17]. Oppa Bay, Okatu Bay and Onagawa Bay have no inflow from rivers with dams. The mud is estimated to be carried southward from the mouth of the Kitakami River by longshore currents as far as Oppa Bay, Okatu Bay and Onagawa Bay to be deposited in the bay, and red tide is estimated to be induced there.
Similar to Kesennuma Bay, Dokai Bay is estimated to be affected mostly by the dams on the Koya River, which is to the east of Dokai Bay, and by the dam on the Onga River, which is located east of Dokai Bay.
During the ebb tidal current, the flow from the Koya River that flows into the Kanmon Channel averages about 5 knots for 5 to 6 h [18]. This flow rate is sufficient for mud to clear the Kanmon Channel of about 21 km length. Thus, mud from the Koya River reaches the mouth of Dokai Bay from the estuary of the Koya River. After reaching the estuary of Dokai Bay, the tidal current slows and mud in the stream is estimated to be deposited around this area. During the period of the full tidal current, part of the mud is considered to flow into Dokai Bay and is deposited there (Figure 4).
In Dokai Bay, mud that had accumulated on the seafloor and that was estimated to mainly be derived from the drainage of factories located around Dokai Bay was dredged from 1973 to 1976 [19]. The Koya River Dam (C) in Figure 4 with a surface area of 161 ha was built on the Koya River in 1955 and the Rikimaru Dam (F) in Figure 4 with a surface area of 79 ha was built on the Onga River in 1965. It is thought that these dams delivered a considerable amount of mud to the Dokai Bay until 1973.
The number of red tide occurrences in the Suo-nada Sea fluctuated markedly from 1975 to 2005 (Figure 6). To date, red tide occurrences are estimated to be induced by eutrophication brought about by domestic waste water, agricultural effluent and so on. Then these fluctuations are considered to be caused by eutrophication. It is considered that when the number of red tide occurrences increases, the quantity and/or concentration of eutrophic substances such as T-N and T-P becomes bigger and higher. But there is no paper that reports the increase and decrease of eutrophic substances that correspond with the fluctuation of red tide occurrences. Moreover, the main sources of eutrophic substances causing the each peak of the number of red tide occurrences in Figure 6 were not analyzed and identified in Suo-nada Sea.
The obtained results show a correlation between the number of red tide occurrences per year in the Suo-nada Sea and the surface area of dams on rivers flowing into the Suo-nada Sea (Figure 6). Red tides have a tendency to be induced a few years after the dam is constructed. Thus, red tide occurrences can be expected in the bays and enclosed seas several years after starting to receive water from rivers with dams.
The earliest maps showing areas of red tide occurrences in the Suo-nada Sea and Harima-nada Sea are from 1960. Using the map in 1960, it is possible to identify causes of red tide events. However, due to the boom in dam construction from 1960 to 2000, the maps showing areas of red tide occurrences after 1970 are difficult to interpret.
Similar to the mechanism in Kesennuma Bay, occurrences of red tides in Tokuyama Bay are considered to be induced by mud carried by longshore currents from the Saba River on which the Saba River Dam had been constructed in 1955. One of the reasons is that the Saba River is the closest river on which a dam had been constructed, and the other is that the dam was completed five years before the first red tide event was recorded in 1960. Mud originating from factories around Tokuyama Bay and transported from the Saba River by the longshore current is considered to be deposited into the bay as the sea current slows and stagnates there.
Fishermen brought a suit against the companies that were active around Tokuyama Bay for the red tide occurrences and the mediated settlement included the requirement for those companies to remove the accumulated mud from Tokuyama Bay [20]. This illustrates the relationship between red tide occurrence and mud accumulation.
Red tide was observed along the coast of Fukuoka Prefecture, which faces the Suo-nada Sea (also called the Buzen Sea) in 1960 (Figure 6). Until 1960, no big dams had been constructed on the rivers flowing into the Buzen Sea, including the Tono, Ima, Yamakuni and Yakkan rivers. This phenomenon requires further consideration now.
Similar to Suo-nada Sea, in Harima-nada Sea the number of red tide occurrences fluctuates greatly from 60 in 1976 to 20 in 1978 (Figure 8). After 1978, the fluctuation in the number of red tide occurrences continued. There are no reports that identify factors, explain this fluctuation and specify the sources of eutrophication. In this paper, fluctuation in the number of red tide occurrences is explained for the first time.
There is a large industrial area in the area facing Tokuyama Bay and Dokai Bay. Further, there were many food processing factories, including those related to the fishery industry, on Kesennuma Bay before the Great Tohoku Earthquake and tsunami in 2011, but in the area facing Kakuijima Island in the Harima-nada Sea, there are no big industrial areas that compare to those in Tokuyama Bay and Dokai Bay. In the coastal area near Kakuijima Island, there is no fishery industry. However, red tide occurrence was reported in 1960 (Figure 7). From these conditions, the red tide occurrence near Kakuijima Island can not be explained by mud carried from factories. It should be considered that the red tide occurrence was induced by a dam constructed on the Saba River and mud carried from the dam to near Kakuijima Island.
In this discussion of red tide occurrences, the chronology of red tide occurrences and dam construction is an important analysis factor. Magana et al. [13] reported the chronology of red tide occurrences in the western part of the Gulf of Mexico, and I examined the relationship between red tide occurrence and dam construction. Figure 10 summarizes the locations of rivers, constructed dams and red tide occurrences in the areas facing the Gulf of Mexico.
In 1935, there were reports of red tide occurrences along the Mexican coast. Lund reported a red tide off Padre Island, Texas on 30 June 1935, and a fish kill was observed over an area extending from Port Aransas, Texas, southwards for about 84 miles [21]. This report shows that red tide was observed in the Gulf of Mexico and not in Corpus Christi Bay. If the influence of dams constructed on the Nueces River induced the red tide, the red tide would have occurred in Corpus Christi Bay based on the occurrence of red tide in Tokyo Bay, Ise Bay, Osaka Bay and the Ariake Sea after dams were constructed [7]. Thus, this red tide should be estimated to have been induced by mud in the longshore current that flowed from the Rio Grande (Figure 10). Gunter reported that kills of marine fish and other animals were observed in the Gulf of Mexico in the summer of 1935 and that the area of fish kills extended northward over 250 miles from the Rio Grande [22].
Lund’s and Gunter’s papers are considered to report the same event. It is considered that these mortalities were caused by the red tide. It should be considered that the starting point of the bloom was at the mouth of the Rio Grande based on these two reports.
These phenomena are estimated to be due to dams constructed on the Rio Grande. The three dams built in 1934 on the Rio Grande were the San Acacia Diversion (J), Isleta Diversion (I) and Angostura Diversion (H) dams (Figure 10). After these dams were completed, it is estimated that muddy soil was carried into the Gulf of Mexico and then flowed northward and/or southward by the longshore current. This phenomenon is similar to theone identified in Kesennuma Bay and Dokai Bay of Japan.
Gunter reported a mass fish mortality that occurred in the fall of 1948 along the southern end of the Texas coast, and this phenomenon is estimated to be attributable to red tide. In 1935, the El Vado Dam (C) and in 1938, the American Diversion (N) and Caballo (L) dams were built on the Rio Grande (Figure 10). It is considered that this event is attributable to dam constructions and mud carried from the dams [22]. The red tide occurrence was induced about ten years after the completion of these dams. The reason for the long lag between the construction of the dams and the occurrence of red tides needs further consideration.

Figure 10. Location of rivers, constructed dams, red tide occurrences and the estimated directions of mud stream flows in the Gulf of Mexico. Letters indicate constructed dams.
There are two reports of red tide occurrences in 1955 and they are estimated to be correlated with dam constructions. Wilson and Ray reported an extensive red tide bloom during September 1955 near Port Isabel [23] following the completion of the Platoro Dam (390 ha, 1951) (A), Jemez Canyon Dam (570 ha, 1953) (G) and Falcon Dam (35,400 ha, 1954) (P) on the Rio Grande. It is estimated that mud was carried northward from the mouth of the Rio Grande along the Texas coast, and a portion of it entered into the Lower Laguna Madre at high tide, probably through the channel between South Padre Island and Brazos Island. Since the channel is near the mouth of the Rio Grande, the concentration of mud is estimated to be high. This phenomenon is similar to the red tide occurrence in Kesennuma Bay and Dokai Bay mentioned above.
On the other hand, mud was also carried southward and red tides were induced during October to November 1955 from Tamaulipas to Veracruz as reported by Ramirez-Granados [24]. The Rio Panuco lies between the Rio Grande and the Rio Papaloapan in Mexico. Therefore, the flow of mud from the Rio Grande or the Rio Papaloapan is estimated to be dispersed offshore by the Rio Panuco (Figure 10).
However, there have not been any reports of red tide occurrences in the Gulf of Mexico after 1969 when the Amistad Diversion Dam (N) was built on the Rio Grande. This big dam has a vast surface area of 26,300 ha, and it is estimated that construction of the dam induced big red tide occurrences in the Gulf of Mexico. The mechanism for this phenomenon will require further consideration.
Magana et al. [13] wrote that a red tide bloom was observed in 1974 along the Mexican coastline from south of the Rio Grande to Tampico, Mexico. From 1970 to 1973, three dams were constructed on the Rio Grande. Those are the Galisteo (1970, F), Heron (1971, B) and Cochiti (1973, E) dams. The completion year and the letter designation in Figure 10 are shown in parenthesis. It is considered that this red tide was induced by mud flowing southward from the Rio Grande in the longshore current.
Cortes-Altamirano et al. reported toxic red tides along the coast of Mexico near Veracruz in 1994-1995 [25]. It is estimated that these red tides were attributable to the completion of the Cerro de Oro Dam (Q) built on the Rio Papaloapan in 1989.
The Rio Grihalva is a big river in the south of Mexico on which four dams (T-W) were constructed (Figure 10). These dams were constructed from 1966 to 1986, but there were no reports of red tide occurrences and/or a mass fish mortality after 1966 around the mouth of the Rio Grihalva. This phenomenon will require further consideration and research.
It is known that red tides have occurred off the western coast of Florida for more than 160 years. Those events often include harmful algae blooms, which are toxic to fish and marine animals, according to the Florida Fish and Wildlife Conservation Commission [26]. Red tides have also been observed along the northwestern coast of Cuba [27,28].
On the other hand, there are no big rivers on the Florida Peninsula, making it is impossible for red tides to be induced by rivers in and/or near the Florida Peninsula. However, in the Gulf of Mexico, there is a Loop Current and the sea currents flow clockwise offshore from the Florida Peninsula (Figure 10) [29]. It is estimated that the outflow of the Mississippi River extends southeast into the Gulf of Mexico and that part of the outflow reaches the west coast of the Florida Peninsula and the northwestern coast of Cuba.
All red tide events and/or a fish mortality events cited in the chronology edited by Magana et al. [13] are not explained by the construction of dams. In particular, events of the massive fish kill observed between 1648 and 1875 in Veracruz, Mexico could not be explained by the construction of dams. Most events occurring after 1986 in the Gulf of Mexico also need further consideration.
However, it is estimated that there are common mechanisms that cause red tides and/or a mass fish mortality among small Japanese bays such as Kesennuma Bay, Dokai Bay, nearby Kakuishima Island in Harima-nada Sea, Tokuyama Bay in Suo-nada Sea, and the Gulf of Mexico. The mud flowing from rivers on which dams have been built is estimated to be carried from the mouth of the river along the coast by longshore currents. When the longshore current enters a small bay, the current slows and fine particles in the mud are readily precipitated, causing red tide in the bays.
5. Conclusions
The relationship between red tide occurrences and dam construction was researched and is discussed in this paper using chronological data from Kesennuma Bay, Dokai Bay, Tokuyama Bay in Suo-nada Sea and nearby Kakuishima Island in Harima-nada Sea. As a result, the same tendency was observed in these four sea areas.
Red tides occurring in these four areas were estimated to be induced by mud overflowing from dams constructed on rivers that flow into the sea near the four areas. The mud flow is estimated to be carried north and/or south along coast by a longshore current, and the flow rate is estimated to become slow or stop in the four sea areas, depositing mud deposits there and inducing red tides.
The red tides observed in the Gulf of Mexico as compiled by Magana et al. [13] were estimated to be induced by mud carried from rivers such as the Rio Grande and the Rio Papaloapan. However, some of the red tide records cited by Magana et al. need further research and consideration.
The red tides observed off the western coast of the Florida Peninsula are considered to be induced by mud carried from the mouth of Mississippi River. It is well known that there is a loop current in Gulf of Mexico and mud carried from the Mississippi River is estimated to be carried off the western coast of Florida Peninsula and northwest coast of Cuba and deposited there.
6. Acknowledgements
I would like to thank the following facilities for providing data on their websites: The Japan Dam Foundation and the Florida Fish and Wildlife Conservation Commission.
REFERENCES
- D. M. Anderson., J. M. Burkholder, W. P. Cochlan, P. M. Gilbert, C. J. Gobler, C. A. Heil, R. M. Kudela, M. L. Parsons, J. E. J. Rensel, D. W. Townsend, V. L. Trainer and G. A. Vargo, “Harmful Algal Blooms and Eutrophication: Examining Linkages from Selected Coastal Regions of the United States,” Harmful Algae, Vol. 8, No. 1, 2008, pp. 39-53. http://dx.doi.org/10.1016/j.hal.2008.08.017
- J. Heisler, P. M. Gilbert, J. M. Burkholder, D. M. Anderson, W. Cochlan, W. C. Dennison, Q. Dortch, C. J. Gobler, C. A. Heil, E. Humphries, A. Lewitus, R. Magnien, H. G. Marshall, K. Sellner, D. A. Stockwell, D. K. Stoecker and M. Suddleson, “Eutrophication and Harmful Algal Blooms: A Scientific Consensus,” Harmful Algae, Vol. 8, No. 1, 2008, pp. 3-13. http://dx.doi.org/10.1016/j.hal.2008.08.006
- I. Imai, M. Yamaguchi and Y. Hori, “Eutrophication and Occurrences of Harmful Algal Blooms in Seto Inland Sea, Japan,” Plankton & Benthos Research, Vol. 1, No. 2, 2006, pp. 71-84. http://dx.doi.org/10.3800/pbr.1.71
- H. W. Paerl, “Coastal Eutrophication and Harmful Algal Blooms: Importance of Atmospheric Deposition and Groundwater as ‘New’ Nitrogen and Other Nutrient Sources,” Limnology and Oceanography, Vol. 42, No. 5, 1997, pp. 1154-1165. http://dx.doi.org/10.4319/lo.1997.42.5_part_2.1154
- S. J. Bein, “The Relationship of Total Phosphorus Concentration in Sea Water to Red Tide Blooms,” Bulletin of Marine Science of the Gulf and Caribbean, Vol. 7, No. 4, 1957, pp. 316-329.
- S. Meksumpun, K. Ichimi, K. Tada and S. Montani, “Relationships between Biochemical Composition of Gymnodinium Mikimotoi and Environmental Conditions during a Red Tide,” Plankton Biology and Ecology, Vol. 45, No. 2, 1998, pp. 117-128.
- K. Ueda, “Relationship between Red Tide Occurrences in Four Japanese Bays and Dam Construction,” World Environment, Vol. 2, No. 6, 2012, pp. 120-126. http://dx.doi.org/10.5923/j.env.20120206.03
- H. Ito, N. Fujita and A. Chiba, “The Change of the Aquaculture Ground Environment at the Innermost in Kesennuma Bay,” Miyagi Prefectural Freshwater Fisheries. Experimental Station, Vol. 5, 2005, pp. 27-35. (in Japanese)
- M. Yamada, E. Katsuki, M. Ootsubo, K. Hamada, N. Ueda and S. Montani, “Survival Strategy of Tropical and Subtropical Marine Diatom Skeletonema tropicum in Temperate Coastal Small Bay (Dokai Bay), Japan,” The Oceanographic Society of Japan, Vol. 18, No. 2, 2009, pp. 157-167.
- M. Yamada, N. Ueda and K. Hamada, “Changes in Red Tide Occurrence and Organisms Responsible for Declining Eutrophic Level in Hyper-Eutrophic Dokai Bay, Japan,” Nippon Suisan Gakkaishi, Vol. 77, No. 4, 2011, pp. 647-655. http://dx.doi.org/10.2331/suisan.77.647
- Ministry of the Environment, “Enclosed Sea Net,” 2013. http://www.env.go.jp/water/heisa/heisa_net/index.html
- International EMECS Center, “Environmental Conservation of the Seto Inland Sea,” Asahi Print Co., Ltd., Tokyo, 2008.
- H. A. Magana, C. Contreras and T. A. Villareal, “A Historical Assessment of Karenia brevis in the Western Gulf of Mexico,” Harmful Algae, Vol. 2, No. 3, 2003, pp. 163- 171. http://dx.doi.org/10.1016/S1568-9883(03)00026-X
- The Japan Dam Foundation, “Dams in Japan,” 2013. http://damnet.or.jp/Dambinran/binran/TopIndex_en.html
- C. Abeyta, “Middle Rio Grande Bosque Initiative,” 2013. http://www.fws.gov/southwest/mrgbi/index.html
- Wikipedia, “List of Dams and Reservoirs,” 2013. http://en.wikipedia.org/wiki/List_of_dams_and_reservoirs
- Miyagi Prefecture, “Miyagi Prefectural Goverment,” 2013. http://www.pref.miyagi.jp/suikisei/shiryou/akasiojoho.pd2012
- The 6th Regional Coast Guard Headquarters, “The Information about Safety in the Seto Inland Sea and the Uwa Sea (in Japanese),” 2013. http://www1.kaiho.mlit.go.jp/KAN6/index.html
- Kitakyushu City, “Handbook of Environmental Measures in Kitakyushu City,” 2013. http://enviroscope.iges.or.jp/contents/76/index2.htm
- Asahi Newspaper, “The Established Theory by a Academic World Says That the Main Cause of Red Tides Is Waste Fluid From Factories (in Japanese),” Asahi Newspaper Company, Tokyo, 1975, p. 6.
- E. J. Lund, “Some Facts Relating to the Occurrence of Dead and Dying Fish on the Texas Coast during June, July, and August 1935,” Annual Report, Texas Game, Fish and Oyster Commission, Austin, 1934-1935, pp. 47- 50.
- G. Gunter, “The Import of Catastrophic Mass Mortalities for Marine Fisheries along the Texas Coast,” Journal of Wildlife Management, Vol. 16, No. 1, 1952, pp. 63-69. http://dx.doi.org/10.2307/3797181
- W. B. Wilson and S. M. Ray, “The Occurrence of Gymnodium brevis in the Western Gulf of Mexico,” Ecology, Vol. 37, No. 2, 1956, p. 388. http://dx.doi.org/10.2307/1933156
- R. Ramirez-Granados, “Marea Roja. Datos para su Conocimiento y Pronostico. Secretaria de Industria y Comercio. Direccion General de Pesca e Industrias Conexas. Departamento de Estudios en Biologia Pesquera,” Trabajos de Divulgacion, Vol. 4, 1963, pp. 1-9.
- R. Cortes-Altamirano, D. U. Hernandez-Becerril and R. Luna-Soria, “Mareas Rojas en Mexico: Una Revision,” Revista Latinoamericana de Microbiología, Vol. 37, 1995, pp. 343-352.
- Florida Fish and Wildlife Conservation Commission, “HAB Historical Database,” 2013. http://myfwc.com/
- G. Delgado, C. H. Lechuga-Deveze, G. Popowski, L. Troccoli and C. A. Salinas, “Epiphytic Dinoflagellates Associated with Ciguatera in the Northwestern Coast of Cuba,” Revista de Biologia Tropical, Vol. 54, No. 2, 2006, pp. 299-310.
- G. Popowski, G. Delgado, M. Sanchez and R. E. Nodar, “Gambierdiscus Toxicus Adachi y Fukuyo, en el Litoral Norte de Ciudad de la Habana,” Revista de Investigación Marina, Vol. 22, No. 1, 2001, pp. 69-72.
- J. Gyory, A. J. Mariano and E. H. Ryan, “Surface Currents in the Atlantic Ocean,” 2013. http://oceancurrents.rsmas.miami.edu/atlanti