American Journal of Analytical Chemistry
Vol.4 No.8(2013), Article ID:35709,11 pages DOI:10.4236/ajac.2013.48049
Linde Type a Zeolite and Type Y Faujasite as a Solid-Phase for Lead, Cadmium, Nickel and Cobalt Preconcentration and Determination Using a Flow Injection System Coupled to Flame Atomic Absorption Spectrometry
1Laboratorio de Espectroscopía Molecular, Facultad de Ciencias, Universidad de Los Andes, Mérida, Venezuela
2Laboratorio de Química Analítica, Centro de Química, Instituto Venezolano de Investigaciones Científicas, Caracas, Venezuela
Email: *wrondon@ivic.gob.ve
Copyright © 2013 Yaneira Petit de Peña, Wendy Rondón. This is an open access article distributed under the Creative Commons Attribution License, which permits unrestricted use, distribution, and reproduction in any medium, provided the original work is properly cited.
Received April 23, 2013; revised May 24, 2013; accepted June 15, 2013
Keywords: Cobalt; Nickel; Cadmium; Lead; Flow Injection; Preconcentration; Zeolites; Atomic Absorption
ABSTRACT
In this work, a flow injection analysis (FIA) method for the trace determination of lead, cadmium, nickel and cobalt in natural waters by formation of neutral chelates with ammonium pyrrolidine dithiocarbamate (APDC) was developed. The neutral chelates formed was retained in a mini-column packed with Linde type A zeolite (LTA) and type Y Faujasite zeolite (FAU) and then eluted with methyl isobutyl ketone (MIBK) to flame atomic absorption spectrometry (EAA) for its detection. Physicochemical characterization of this zeolite was carried out by Fourier Transform infrared spectroscopy and attenuated total reflectance (FTIR and IR-ATR), scanning electron microscopy and energy dispersive X-ray microanalysis (SEM-EDX) and X-ray power diffraction (XRD). Then, a FIA configuration was used with a column preconcentration system coupled to the detection system at room temperature (22˚C). The detection limit and the relative standard deviation for 5 determinations of different solutions of Pb2+, Co2+, Ni2+ and Cd2+ for FAU and LTA zeolite were calculated. The sampling frequency ranged from 18 - 35 h−1 and preconcentration factors from 21 - 250 were achieved, for a sample volume of 6 mL using 20 mg of sorbents, indicating a high retention of the analytes on the zeolites material. The recoveries obtained in natural waters samples were close to 100% for all ions metal using synthetic zeolites, confirming the applicability of the method. The isotherm models of Langmuir, Scatchard, Freundlich and Dubinin-Radushkevich were used to study the equilibrium data, indicating that successfully followed the Freundlich and Dubinin-Radushkevich (D-R) isotherms at low metal ion concentration. The Freundlich parameter n varied between 0.35 - 1.01, whereas D-R isotherm yields the sorption free energy E < 8 kJ∙mol−1 indicating psysisorption.
1. Introduction
The selective extraction and determination of heavy metals, especially some toxic ones, are still an intensively active research areas due to their biological mechanisms. The traditional methods for noble metals purification were precipitation and complexation procedure which needed large numbers of toxic acids and complexation agents, such as potassium or sodium cyanides that have negative impact on environment [1]. Analytical techniques such as inductively coupled plasma optical emission spectrometry (ICP-OES) [2], and inductively coupled plasma mass spectrometry (ICP-MS) [3] are available for the determination of trace metals with sufficient sensitivity for most of applications, but the high cost of maintenance and correction of inherent interferences is usually a limitation [4]. On the other hand, flame atomic absorption spectrometry (FAAS) is the most widely used analytical method in this field due to its low cost, friendly operation, high sample throughput and good selectivity. However, there are some drawbacks that lessen sensitivity of the technique, including low sample introduction efficiency and low residence time of the atoms in flame [5].
Therefore, analyte preconcentration is required. In this manner a large number of techniques for the preconcentration of lead, cadmium, cobalt and nickel, including liquid-liquid extraction [6], coprecipitation [7], microextraction [8], solid phase extraction [9], etc., have been developed [10]. The combination of flow injection analysis with atomic spectrometry (FIA-FAAS) has considerably extended capabilities of conventional atomic spectrometric methods in terms of efficiency, sensitivity, economy and freedom from interferences [11,12]. Also FIA configuration may contain mini-columns with sorbent material for the analytes preconcentration and improve selectivity in the analysis. For that reason new packing materials are still being proposed and examined [11]. Amberlites (XAD) [13,14], silica gel [15,16], bio-adsorbents [17,18], carbon nanotubes [19,20] and zeolites [21,22] have been used for preconcentration of trace metals [23], after complex formation of metal to facilitate retention on the adsorbent material., such as 8-hidroquinoline [24], APDC [21], 1-(2-Pyridylazo)- 2-naphthol (PAN) [25], ammonium diethyldithiophosphate (DDTP) [26], for ion exchange and/or complexation of metal ions has been applied to extraction-complexation of metal ions. Petit et al. [27] developed an on-line FI system for the preconcentration of Cu2+ onto a mini-column packed with synthetic zeolites; APDC was used to form neutral chelate of the metal, which is then eluted with MIBK and determined by FAAS. Preconcentration factors of copper ranging from 35 - 125 for Na-LTA and 30 - 65 for Na-FAU were readily achieved, related to the direct introduction of aqueous solutions into an atomic absorption spectrometer.
Zeolite [28] is an aluminum silicate that occurs both as natural and as produced synthetic. Zeolite has a threedimensional structure with pores. It consists of silicon, aluminum and oxygen ions. The silicon ions are neutrally charged in the crystal structure. Aluminum ions create negative places. To keep the charge in balance, a counterion (Na+, K+) or a proton (H+) is present in the pores. Some types of zeolite have just a large pore through the entire crystal structure, which is stipulated by the ring size. Changing the ratio of aluminum on silicon can also influence the pore size as well as the type of a counterion. All natural zeolites contain aluminum and are hydrophilic in nature [29,30]. The zeolites have great capacity for ionic exchange due to the charge equilibrium that attracts the closest cation, maintaining neutrality. The cationic exchange property is a function of the ratio of Si to Al. This capacity is expressed as the number of cations per mass or volume unit available for exchange [31]. Zeolites are mainly used as ionic exchangers (water softeners), molecular sieves, absorbents and catalysts. Many studies and investigations are carried out with different zeolites, due to its properties and characteristics [31]. The purpose of this work is to investigate the feasibility of adsorption of the neutral complex with the use of adsorption isotherms, as a modeling tool to describe the phenomenon that regulates the preconcentration (with separation from the matrix) of metal ions on sodium and calcium Y Faujasites (Na-FAU, Ca-FAU) and sodium and calcium A zeolite (Na-LTA and Ca-LTA) for designing a new sorbent material. Strong emphasis is devoted to study and evaluate the utility of the new sorbent to act as a selective solid phase extractor for separation and preconcentration of ultratrace amount of Pb2+, Cd2+, Ni2+ and Co2+, in spiked natural water samples prior to the determination by FIA-FAAS.
2. Experimental
2.1. Apparatus
A flame atomic absorption spectrometer Varian model SpectrAA 110 (Sao Paolo, Brazil), equipped with a bead impact system in the burner chamber and deuterium as background correction was used throughout. The flame composition was acetylene (flow rate: 2.0 L∙min−1) and air (flow rate: 10.0 L∙min−1). Nebulizer flow rate was 4.0 mL∙min−1. Signals were obtained using SpectrAA-110 software, as peak heights. Absorbance measurements and currents were carried out at 217.0 nm and 4 mA for Pb, 232.0 nm and 4 mA for Ni, 228.8 nm and 4 mA for Cd and 240.7 nm and 7 mA for Co, using hollow cathode lamps Varian. The instrumental parameters were used according to the manufacturers recommendations. A pH meter Metrohm 701A (Ohio, USA) was used for pH adjustment.
A FIA system (Figure 1) equipped with: 1) one Gilson Minipuls-3 peristaltic pump (PP, Ohio, USA) four channels as liquid propulsion devices, equipped with tubes of polyvinyl chloride; two channels for sample and APDC reagent, one for water and one channel for the propulsion of MIBK, using the displacement bottle; 2) two reactions coils, assembled with politetrafluoroethylene (PTFE) tubing; 3) the sample injection was achieved using two six-way rotatory valve Rheodyne (Berlin, Germany) provided with fixed volume loops substituted by a reaction coil (MR) followed by a minicolum in valve V2 and by another coil filled with MIBK in valve V1. PTFE tubing (0.5 mm i.d.) was used for all connections. A GraLab900 (Ohio, USA) timer was used to select preconcentration/ elution steps.
2.2. Reagents and Samples
All chemicals reagent used were of analytical grade and ultrapure water from a Milli-Q (Barnstead NANO pureInfinity) to prepare all solutions. A 1000 mg∙L−1 lead, nickel, cadmium and cobalt stock solutions were prepared by dissolving 1.000 g of the metal (Merck, Germany, 99.9% w/w), in a small volume of concentrated

(A)

(B)
Figure 1. Flow injection manifold for preconcentration and determination of trace metal ions. R: APDC reagent.
nitric acid (Fluka, Germany, 65.0% v/v, d = 1.42 g∙L−1) and diluting to 1 L with 1% v/v HNO3. Working solutions were prepared by dilution of the stock standard solution and were adjusted to optimum pH value with concentrated HNO3. The aqueous solution of APDC (Sigma Chemical, Germany 99.0% w/w), using solid purchased was prepared daily in water. MIBK (Riedel de Haën, Germany, 99% v/v) was also used as eluent organic solvent. All bottles used for storing samples and standard solutions, as well as the glassware were washed in 10% v/v nitric acid for 24 h and finally rinsed with ultrapure water. The natural water samples were collected from Mérida City (Venezuelan) namely: tap water, ozonated water, Mucuy River and Albarregas River. All samples were filtered through 0.45 μm membrane filters, acidified to 0.03 mol∙L−1 HNO3 and stored at 4˚C in acid-cleaned polyethylene bottles in order to determine the “dissolved metal” fraction.
2.3. Mini-Columns: Zeolite Synthesis, Construction and Packing
Zeolites synthetic (Na-LTA, Ca-LTA, Na-FAU, Ca-FAU) with 60 - 100 µm particle size (Millipore, Madrid, Spain) were employed as sorbent materials. The Na-FAU zeolite used in this work was synthesized in the Kinetic and Catalysis Laboratory of the Chemistry Department, Los Andes University. The raw material for the synthesis of Na-LTA zeolite (4A, [31]) used in this study was Venezuelan Kaolin from deposits located in Bolivar state (particle size less than 200 - 270 mesh) [32].
Kaolin was subject to metakaolinitation to produce a metakaolin. The metakaolin was then zeolitized, producing Na-LTA zeolite, following a procedure reported else where [31,32]. The Ca-LTA and Ca-FAU were obtained by ion exchange using 1.0 mol L−1 calcium chloride (Merck, Germany, 99.9% w/w) in a reflux system under temperature control. Amounts of 20 mg of the zeolites were used to pack the mini-columns. These were manufactured in the laboratory using PTFE tubing (4 mm id. and 0.3 cm length), sealed with a small piece of glass wool at the ends to avoid material losses and accommodated onto the FIA system. This configuration facilitated rapid replacement of the column, whenever required, thereby overcoming the deterioration of the analytical performance of the method due to the progressive deactivation of the sorbent material. The zeolites mini-column was proven to operate reliably for at least 200 sorption/elution cycles after washing with ultrapure water.
2.4. Characterization
The following tests were performed to characterize the synthesis and exchanges of Ca-FAU zeolite and Ca-LTA zeolite: FTIR, IR-ATR, SEM-EDX and XRD. FTIR and IR-ATR were performed using a FTIR Perkin Elmer (Germany) Spectrom RX1 and IR-ATR Perkin Elmer (Germany) model Spectrum 400, software-controlled Spectrum v.6.3.4.
The zeolites samples for testing were prepared using KBr pellet technique for FTIR and by the IR-ATR technique; the samples were placed directly into the diamond crystal with KRS-5 (mixture of bromide and thallium iodide) at ATR module. For the micrographs, it was used a scanning electron microscope (SEM) Hitachi S-2500 (Tokyo, Japan)coupled to an energy dispersive X-ray microanalyser Thermo Noran for the elemental analysis. XRD was performed using a Philips PW-1250 powder diffractometer equipped with an X-ray tube (Cu-Kα radiation, 40 kV, 25 mA). A small quantity of the sample was ground mechanically in an agate mortar, pestle and mounted on a flat holder covered with a thin layer of grease. Data collection was carried out in the 2θ range 5˚ - 60˚, in steps of 0.02˚ and counting time of 10 s. Phase identification was performed by searching the ICDD powder diffraction file database, with the help of JCPDS (Joint Committee on Powder Diffraction Standards) files for inorganic compounds [33]. The relative intensity yields were obtained from normalized XRD intensities of the major reflection for each material.
2.5. The On-Line Mini-Column Preconcentration/FIA-FAAS
The manifold was operated in a mode based on time control (Figure 1) and the operational sequence is completed in two steps: preconcentration (load) and elution. In the first step (Figure 1(A)), 6 ml of the sample or standard solution containing 5 - 100 µg∙L−1 M2+ (at optimum pH for each metal M) were introduced into the system through the sample channel S, while 0.3% w/w APDC solution was through the reagent channel, R. These flows were continuously propelled using a peristaltic pump PP into the system through valve V2 and mixed in the mixing reactor MR with the APDC, during optimum preconcentration time of each metal. Then the neutral chelate was adsorbed on the zeolite mini-column, located in the loop of valve V2, and the sample matrix sent to waste. During this period, a stream of water was continuously passed through the nebulizer, so that the matrix of the sample never reached the detector. Meanwhile, the coil, located in the injection valve V1 is charged with MIBK.
After the loading time, the injection valves were switched automatically by action of the timer to the injection step (Figure 1(B)) and the neutral chelate was eluted from the mini-column with MIBK directly into nebulizer and subsequently the flame. The aspiration flow rate of the nebulizer was 4.0 µL∙min−1.
The peaks heights were used as analytical signals. The injection valves were again switched to initial position in order to have the system ready for the next preconcentration step.
2.6. Isotherms Adsorption Models
The adsorption experiments were performed on line, using the configuration without mini-colum to constant temperature of 22˚C (Figure 2). The calibration curves in organic phase for each of the analytes under study were obtained following the next procedure: 1) Standards were prepared of 1 - 10 mg∙L−1 Pb2+, 0 - 3 mg∙L-1 Cd2+, 0 - 7 mg∙L−1 de Ni2+ and 0 - 9 mg∙L−1 Co2+ in MIBK containing 0.3% w/w APDC. The preparation in an organic solution, involves using small quantities in µL of aqueous solutions with high known concentrations of the analytes in study. 2) These organic solutions were loaded in the coil by the displacement system and then were turning the injection valve (Figure 2) to insert a stream of water that drove the analytes to the detector. Subsequently,
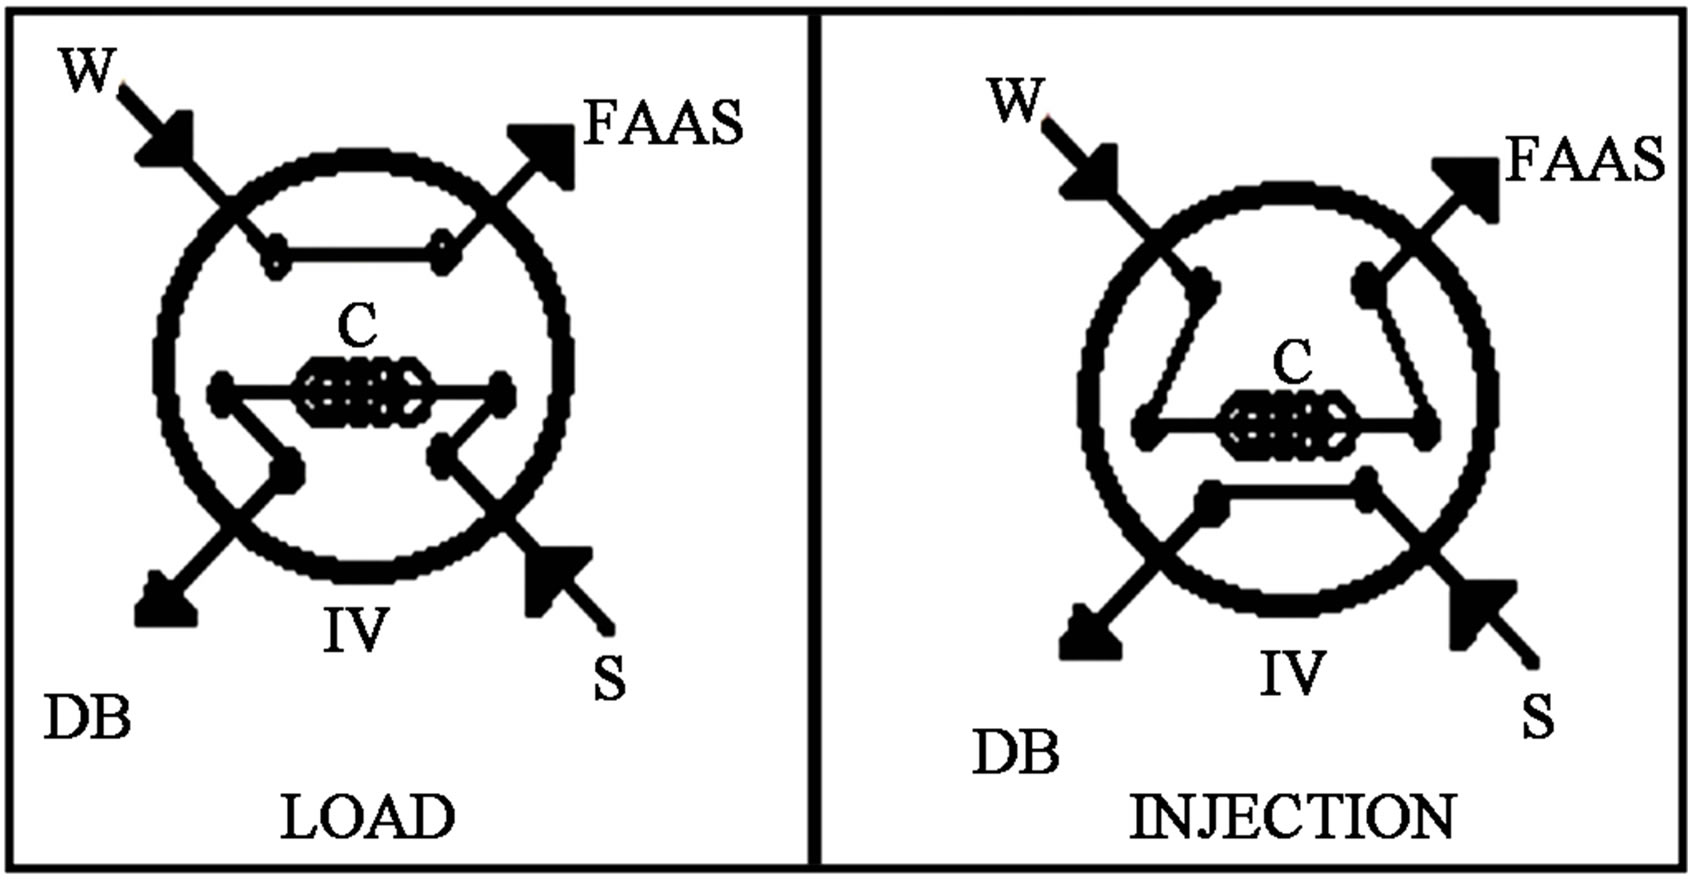
Figure 2. Injection valve setup (IV) controlled by timer. The flow propelled by peristaltic pump. S: metal ion solution in MIBK/APDC. C: organic solution coil. W: waste. DB: displacement bottle.
establishing a mathematical relationship where the absorbances obtained by FIA system with columns of Figure 1 (µg∙L−1 aqueous solutions, Ce) are substituted into the linear regression equation obtained with FIA system without column (organic solutions) of the Figure 2, for obtained the equivalent values in ng∙g−1 of zeolite material, called q.
3. Results and Discussions
3.1. Adsorbents Material Analysis
3.1.1. Spectra FTIR and ATR
Figure 3 shows the FTIR-spectra obtained for kaolin. The characteristic peaks at 3478 cm−1 and 3495 cm−1 are corresponding to the OH-stretching vibration. Bands at 1087 cm−1 and 1064 cm−1 were assigned to Si-O bonds in the SiO4 molecules and Al-OH vibrations. The bands at 787 cm−1 and 641 cm−1 were Si-O symmetric stretching. Absorption at 480 cm−1 was assigned as Si-O-Al stretching vibration where the Al is in octahedral coordination [34]. On the other hand, comparing the FTIR-spectra of the obtained kaolin with the FTIR-spectra of Na-LTA and Na-FAU (Figure 4) one can appreciate differences between the bands of stretching vibrations and deformation of the H-O-H in the region of 3000 - 3700 cm−1 for the adsorbed molecular water which is located in the

Figure 3. FTIR spectrum of kaolin.
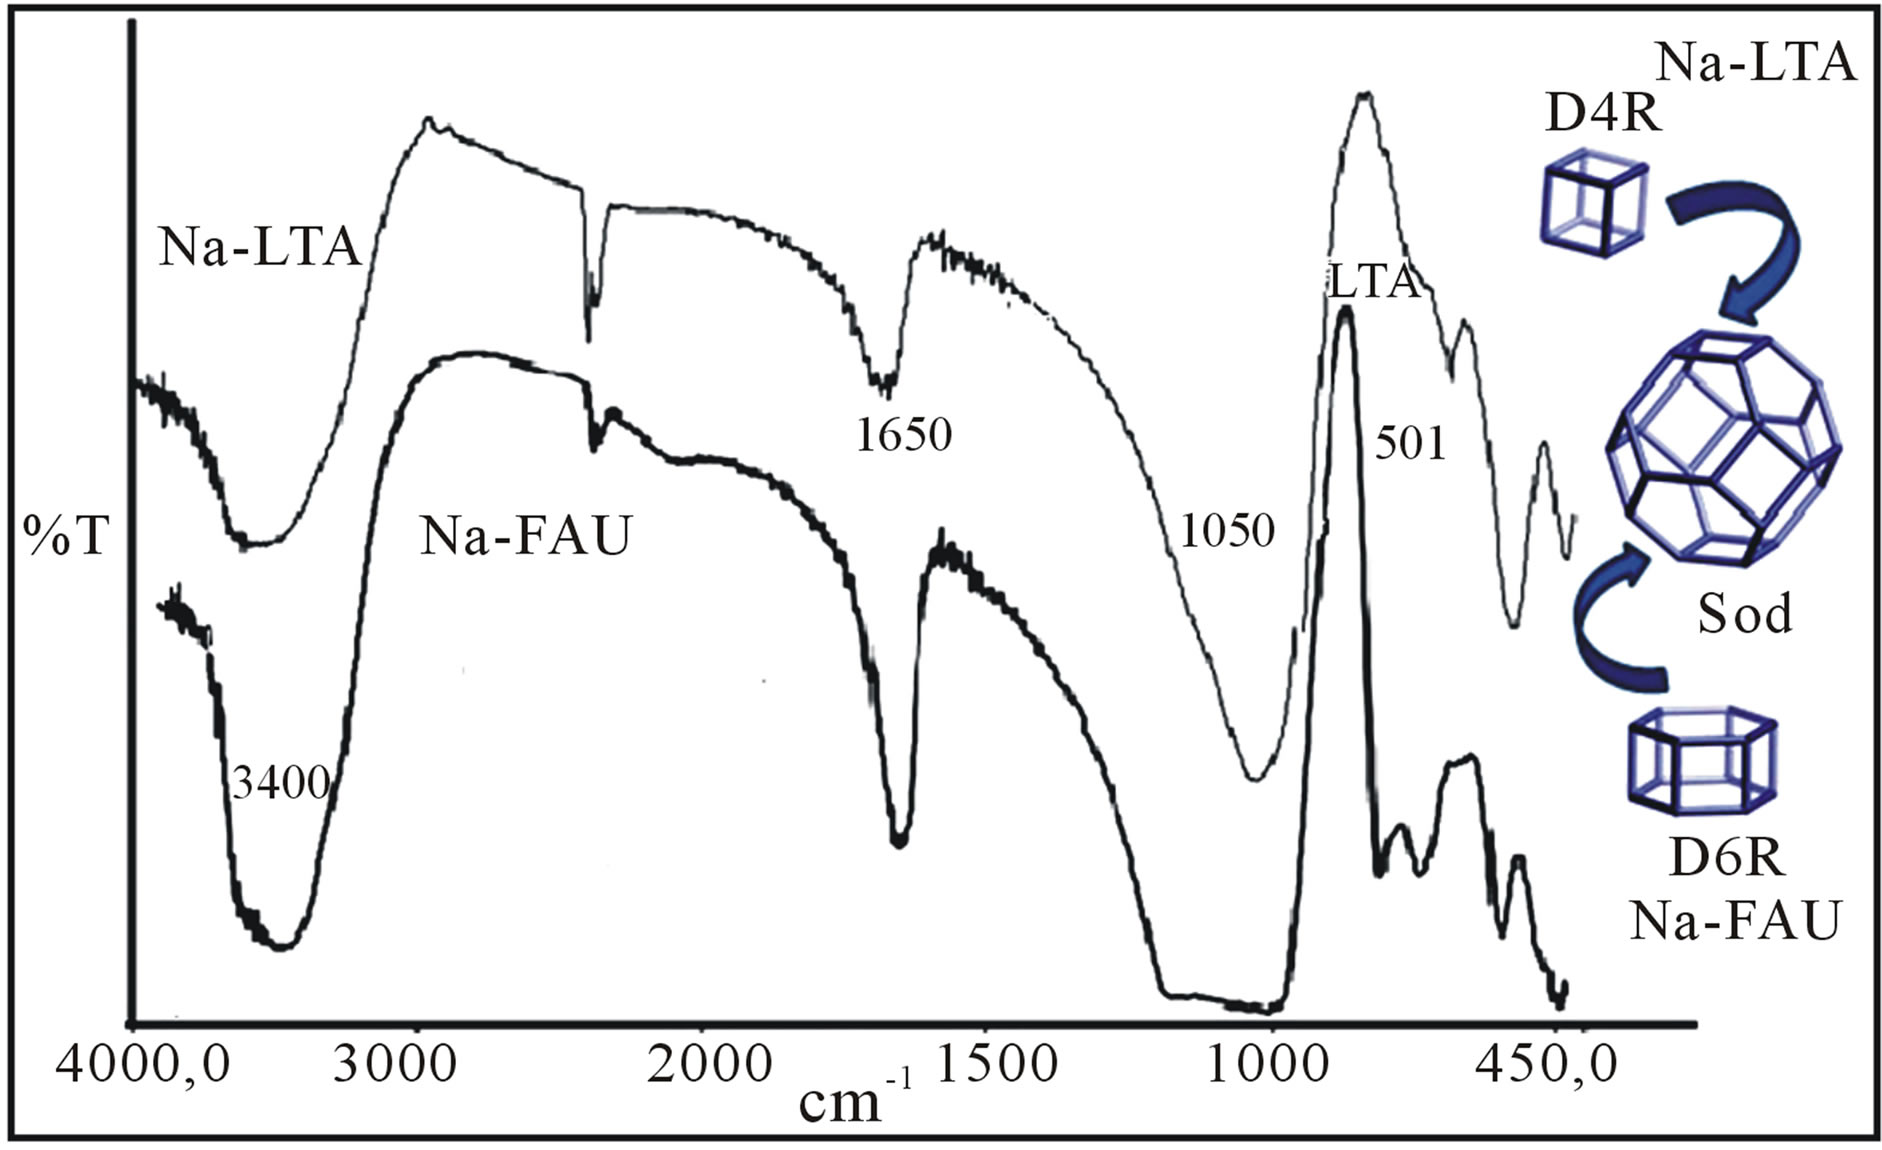
Figure 4. FTIR overlapping spectra of the synthesized zeolites: Na-LTA and Na-FAU.
cavities of the LTA and FAU zeolites; and the band in 1650 cm−1 characterizes the signal stretching and angular deformation of the hydroxyl molecules of water of hydration of the zeolites. The bands in 1100 - 1050 cm−1 indicates the presence of Si-O and the crystallization bands appear in the zone of absorption 555 - 501 cm−1 which is assigned to the presence of structural double rings of LTA (D4R) and FAU (D6R) zeolites. As seen in Figure 5 corresponding to the ATR-spectra obtained for zeolites Na-LTA and Ca-LTA, appear weak bands in the zone 400 - 500 cm−1, what are caused of vibration deformation of the tetrahedral layer being the area of 480 - 540 cm−1 particularly sensitive, where the frequency varies inversely with the ionic radius of octahedral cations.
3.1.2. SEM-EDX Analysis
In the SEM micrographs of Figure 6 it can be observed which of the samples of Na-LTA zeolites and Na-FAU zeolites presented greater amount of well formed cubic crystallites and hexagonal; typical morphology in these materials, and also shows that the crystals have dimensions of around 5 micrometers for Na-LTA zeolite and 3 micrometers for Na-FAU zeolite. The half elemental composition of the zeolite and Na-FAU were performed with three different random points.
The result obtained in EDX analysis with respect to Si/Al ranged around 1.3 for Na-LTA and 2.8 for Na-FAU which is an approximation of the corresponding value of the Si/Al obtained from the chemicals formulas Na96Al96Si96O384 × 27H2O [35] that has a Si/Al ratio equal to 1 for Na-LTA and (M59/n)[(A1O2)59(SiO2)133] × 235 H2O that has Si/Al ratio equal to 1.5 - 3.0 for Na-FAU [36].
3.1.3. XRD Aznalysis
XRD patterns of the Na-LTA and Na-FAU zeolites are reported in Figure 7" target="_self"> Figure 7. The powder XRD profiles are characteristic of highly crystalline material showing sharp reflections (2q positions).
The pattern of LTA (Figure 7(A)) shows all the characteristic peaks matching with the reported in the diffraction equipment library, with corresponding formula to Na2Al2Si1,85O7,7·5,1 H2O (Ref. Code 00-038-0241) [33]. Also, is identified a small amount of quartz SiO2 (Ref. Code 01-079-1906) [33]. The pattern of FAU (Figure 7(B)) shows all the characteristic peaks matching with the reported in the diffraction equipment library, with corresponding formula to Na2Al2Si4,5O13·H2O (Ref. Code 00-043-0168) [33].
3.2. Optimization of Experimental Parameters
The flow system parameters were optimized by varying chemical and flow conditions by univariate manner. The analytical steps of the optimized procedure (FIA-FAAS) for lead, cadmium, nickel and cobalt determination are summarized in Table 1" target="_self"> Table 1.
3.3. Analytical Features and Analysis of Drinking Water Samples
Under the optimum conditions described above, the analytical parameters of the proposed method are summarized in Table 2 for each analyte. The experimental preconcentration factor was calculated as the radio of the slopes of calibration curves (SCC), obtained with and without preconcentration for the aqueous solutions (SCC of FIA-FAAS × 103/SCC of FAAS). The precision of the

Figure 5. Overlapping spectra obtained by IR-ATR. Blue line: Na-LTA. Red line: Ca-LTA. Black line: the base of ATR.
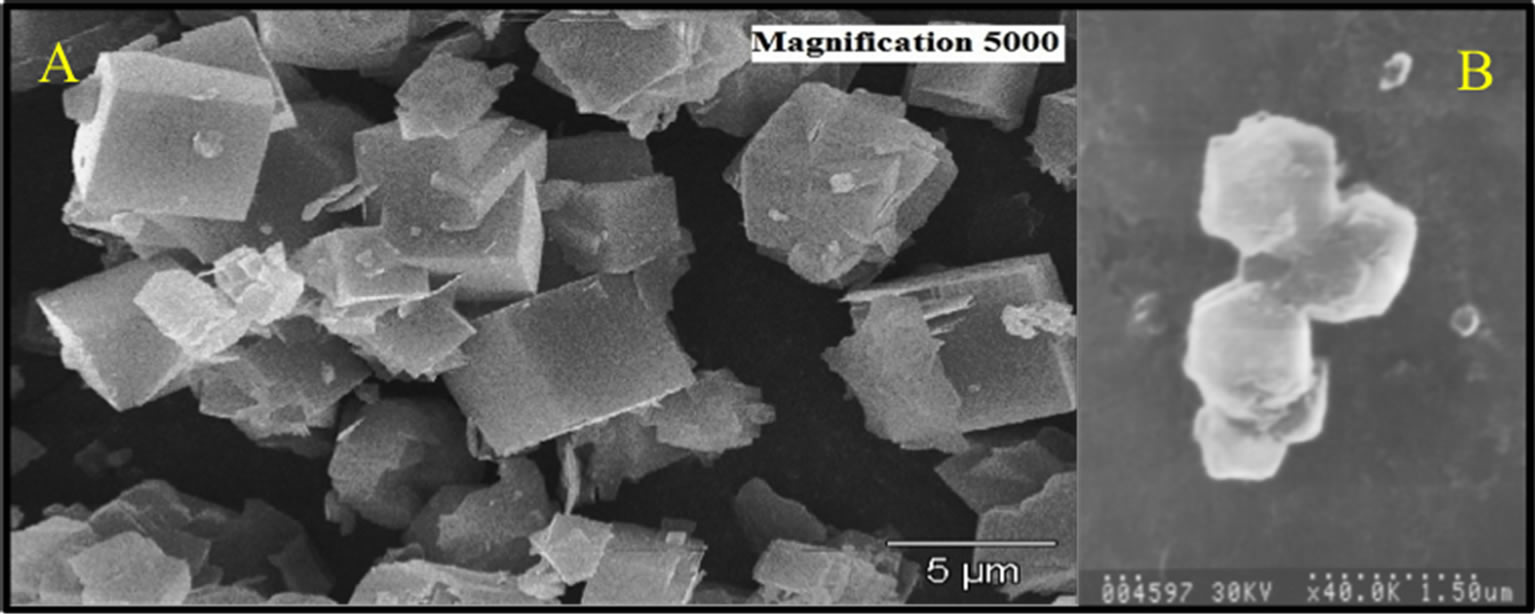
Figure 6. SEM of the zynthesized zeolites. A: Na-LTA. B: Na-FAU.
method was determined by seven repetitive analyses of different standard solution under the optimum conditions.
A good relative standard deviation in the range of 0.2% - 1.6% at 25 µg∙L−1 Pb+2, 40 µg∙L−1 Cd+2, 50 µg∙L−1 Ni+2 and 40 µg∙L−1 Co+2 (n = 5) was obtained. Recovery tests using the proposed method were performed using five different samples, and the test for each sample was carried out in triplicate. The preconcentration procedure was evaluated by spiking certain amounts of trace metals in natural water samples. The results for the recoveries of spiked samples are good since the values ranged from 98% - 102%.

(A)

(B)
Figure 7. X-ray powder diffraction pattern. A: Na-LTA, where C is quartz. B: Na-FAU.
3.4. Adsorption Isotherms
Several models can be used to describe the variation of adsorption data with metal ion concentration. The Langmuir isotherm [37] based on Equation (1) and Scatchard [38] graph based on Equation (2), where qm indicates theoretical maximum sorption capacity of sorbent for a target solute to form a complete monolayer (also known as theoretical saturation capacity) and b is a constant related to affinity between adsorbent and adsorbate, does not fit very well with the experimental data.
 (1)
(1)
 (2)
(2)
Therefore, the model employed was the Freundlich isotherm equation for dilute solutions given by Equation (3) [38], where k and m = (1/n) are the adsorption isotherm parameters, which are described as an indicator of sorption capacity and a constant related to sorption intensity respectively. The calculated parameters from the linearized form logq versus logCe plot of the Freundlich model are collectively listed in Table 3.
 (3)
(3)
The Freundlich model seems to be agreeable for the zeolites in study due to the good fit that presents with the experimental data and R2 values calculated from the plot [38]; hence, it can be deduced that the sorption of metals (II) on zeolites is a favorable process for each studied

Table 1. Instrumental and experimental conditions.
*Adjusted with HNO3. a[Pb+2] = 25 µg∙L−1; b[Cd+2] = 40 µg∙L−1; c[Ni+2] = 50 µg∙L−1; d[Co+2] = 40 µg∙L−1; +Value just for Ca-LTA.
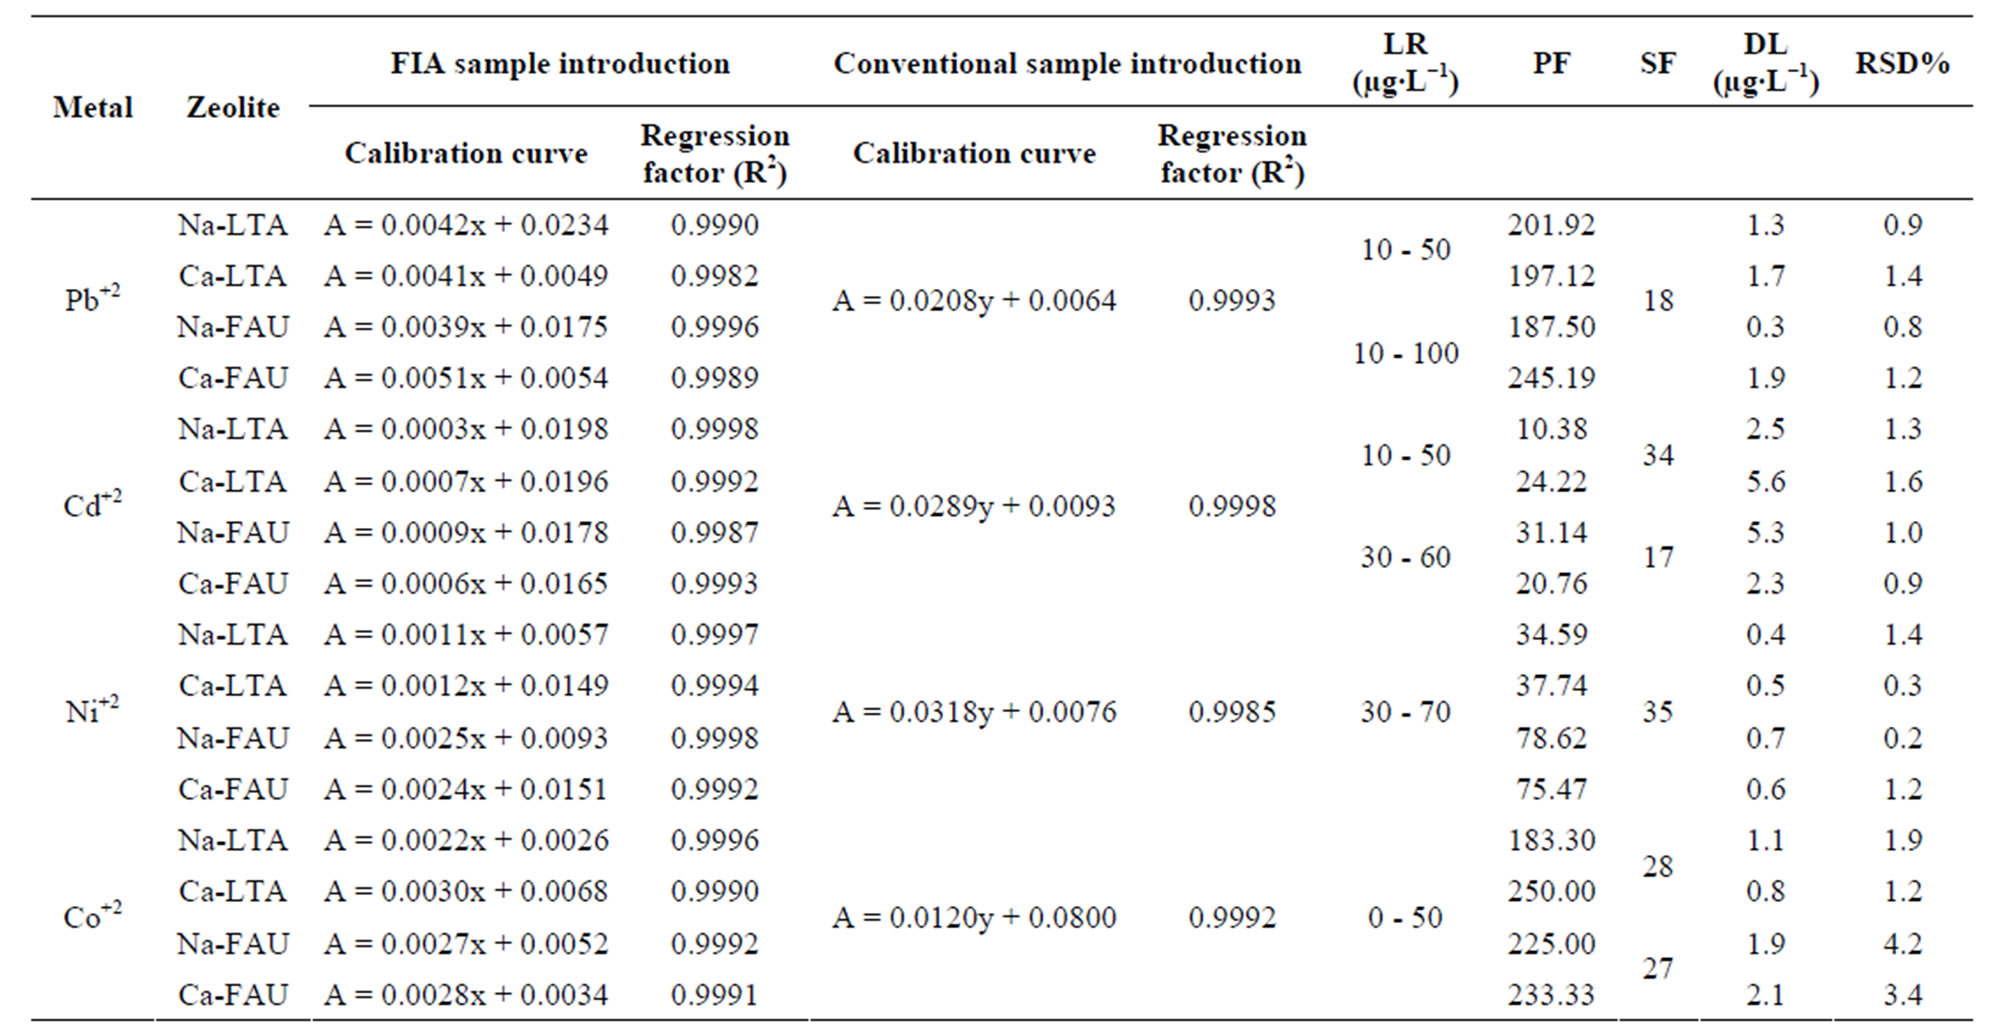
Table 2. Analytical parameters of the proposed method.
A: absorbance; x: metal µg∙L−1 concentration; y: metal mg∙L−1 concentration; PF: preconcentration factor compared to the conventional introduction of aqueous sample. DL: detection limit. RSD %: repeatability. LR: lineal range. SF: sample frequency.
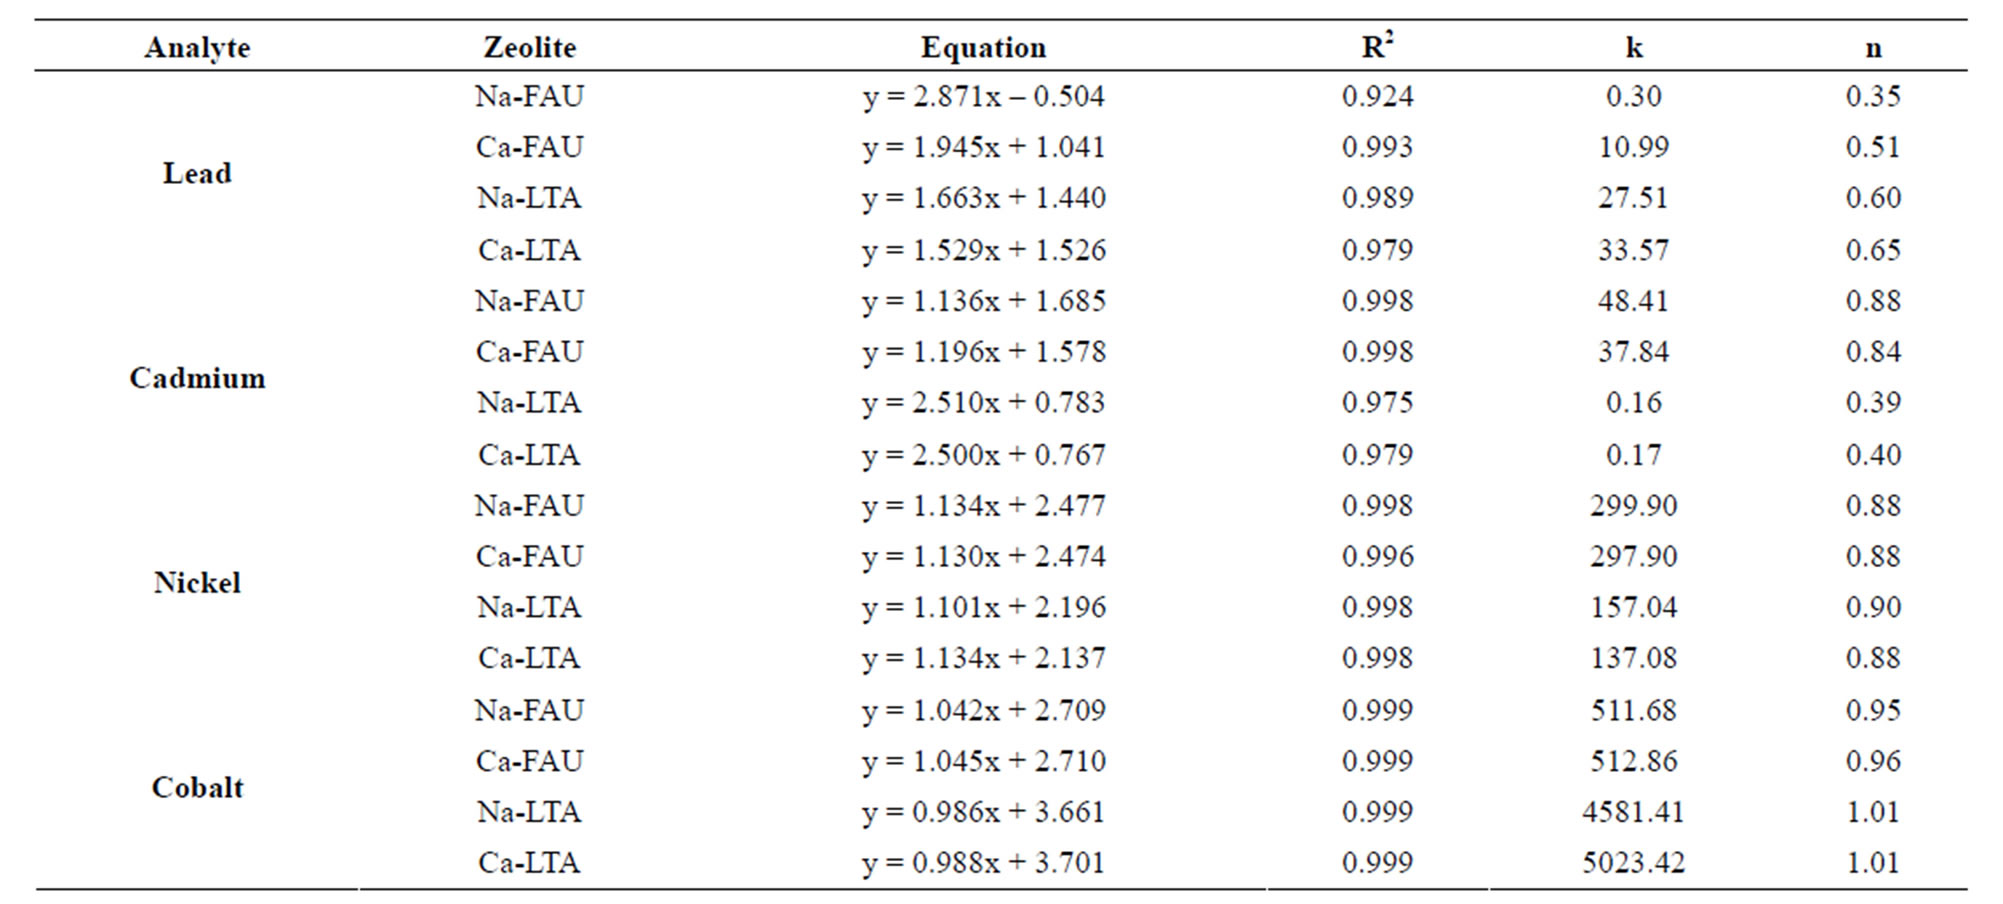
Table 3. Adsorption isotherm parameters of Freundlich.
experimental conditions, due to the good values of R2 as can seen in Table 3. The infinite surface coverage is predicted mathematically and indicates a multilayer sorption of the surface.
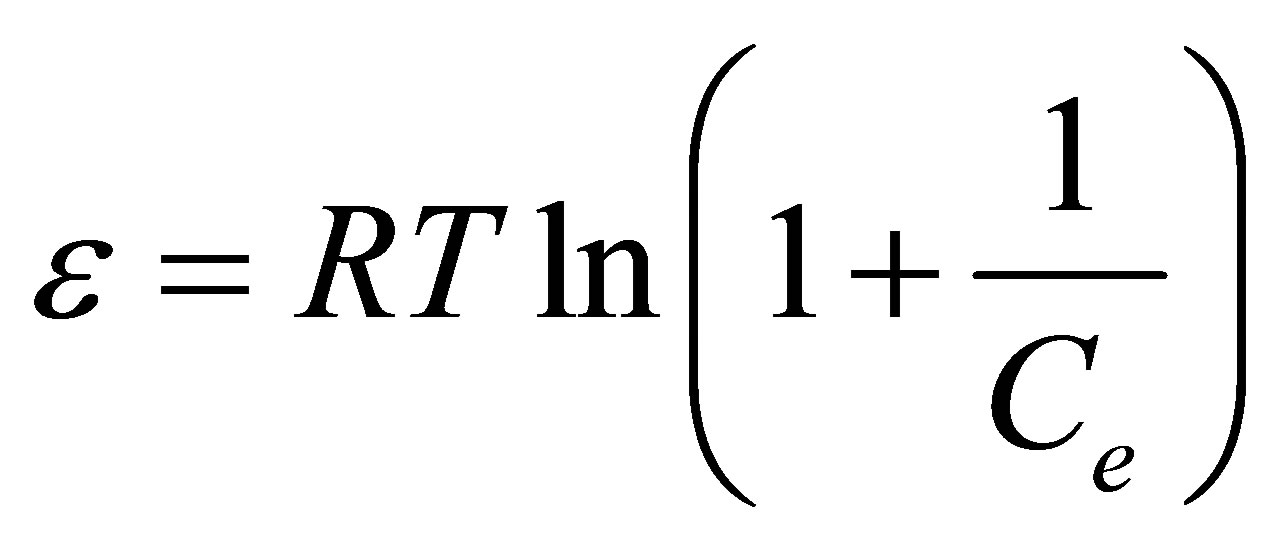
The sorption free energy has been evaluated to get some information of the nature of bonding (i.e. either physiosorption or chemisorption). In this regard the Dubinin-Radushkevich (D-R) isotherm [39] was tested as it seems in Equation (4).
 (4)
(4)
 (5)
(5)
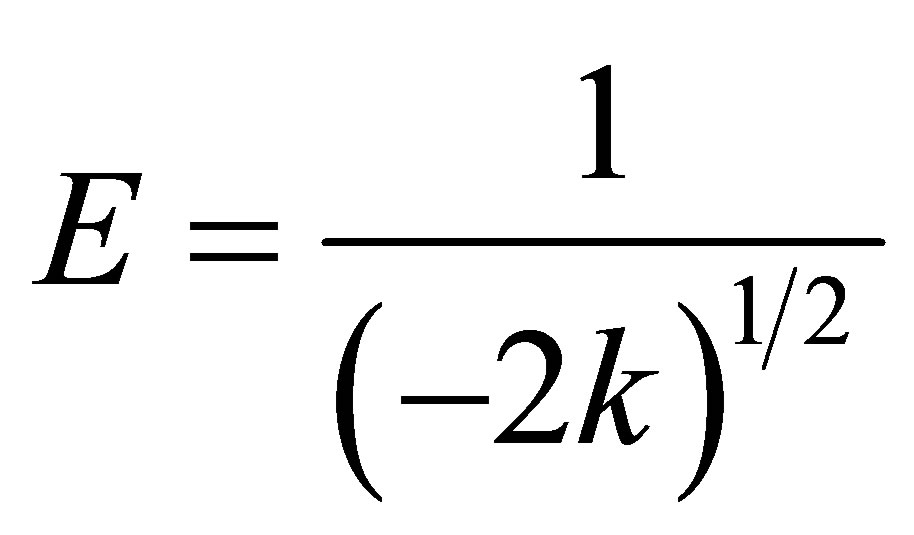
The parameters K and ε are the activity coefficient in mol2∙kJ−2 and the Polanyi potential, while R is the gas constant (8.3143 J∙mol−1∙K−1) and T is the temperature in Kelvin. The activity coefficient constant is related with the sorption free energy as it seems in Equation (6).
 (6)
(6)
The plot of  versus
  is linear as show in Figure 8 for adsorption of Co(PDC)2. The numerical values of different parameters are given in Table 4. The values of free energy of adsorption obtained for all zeolite samples lie in the range expected for physical adsorption (<8 kJ∙mol−1).
4. Conclusion
In the presented study a new solid phase extraction technique was developed based on the preconcentration on line of ions including Pb2+, Ni2+, Cd2+ and Co2+ ions in drinking water samples on synthetic zeolites type Na-LTA, Ca-LTA, Na-FAU and Ca-FAU and determination by FAAS. The conditions for quantitative and reproducible preconcentration, elution and FAAS determinations were studied. The system showed reproducibility and reliability in analytical data, with an R.S.D. value lower than 5% on fivefold experiment. 20 mg of zeolites can be used in more than 200 experiments without any loss in its sorption behavior. The system was successful in the preconcentration (20 < PF < 200) of analytes in volume sample of 6 mL. The sorption capacity under acidic conditions is a process based on interactions, between acid sites of zeolites and neutral chelates formed in the FIA separation and preconcentration system. The degrees of such interactions are highly independent
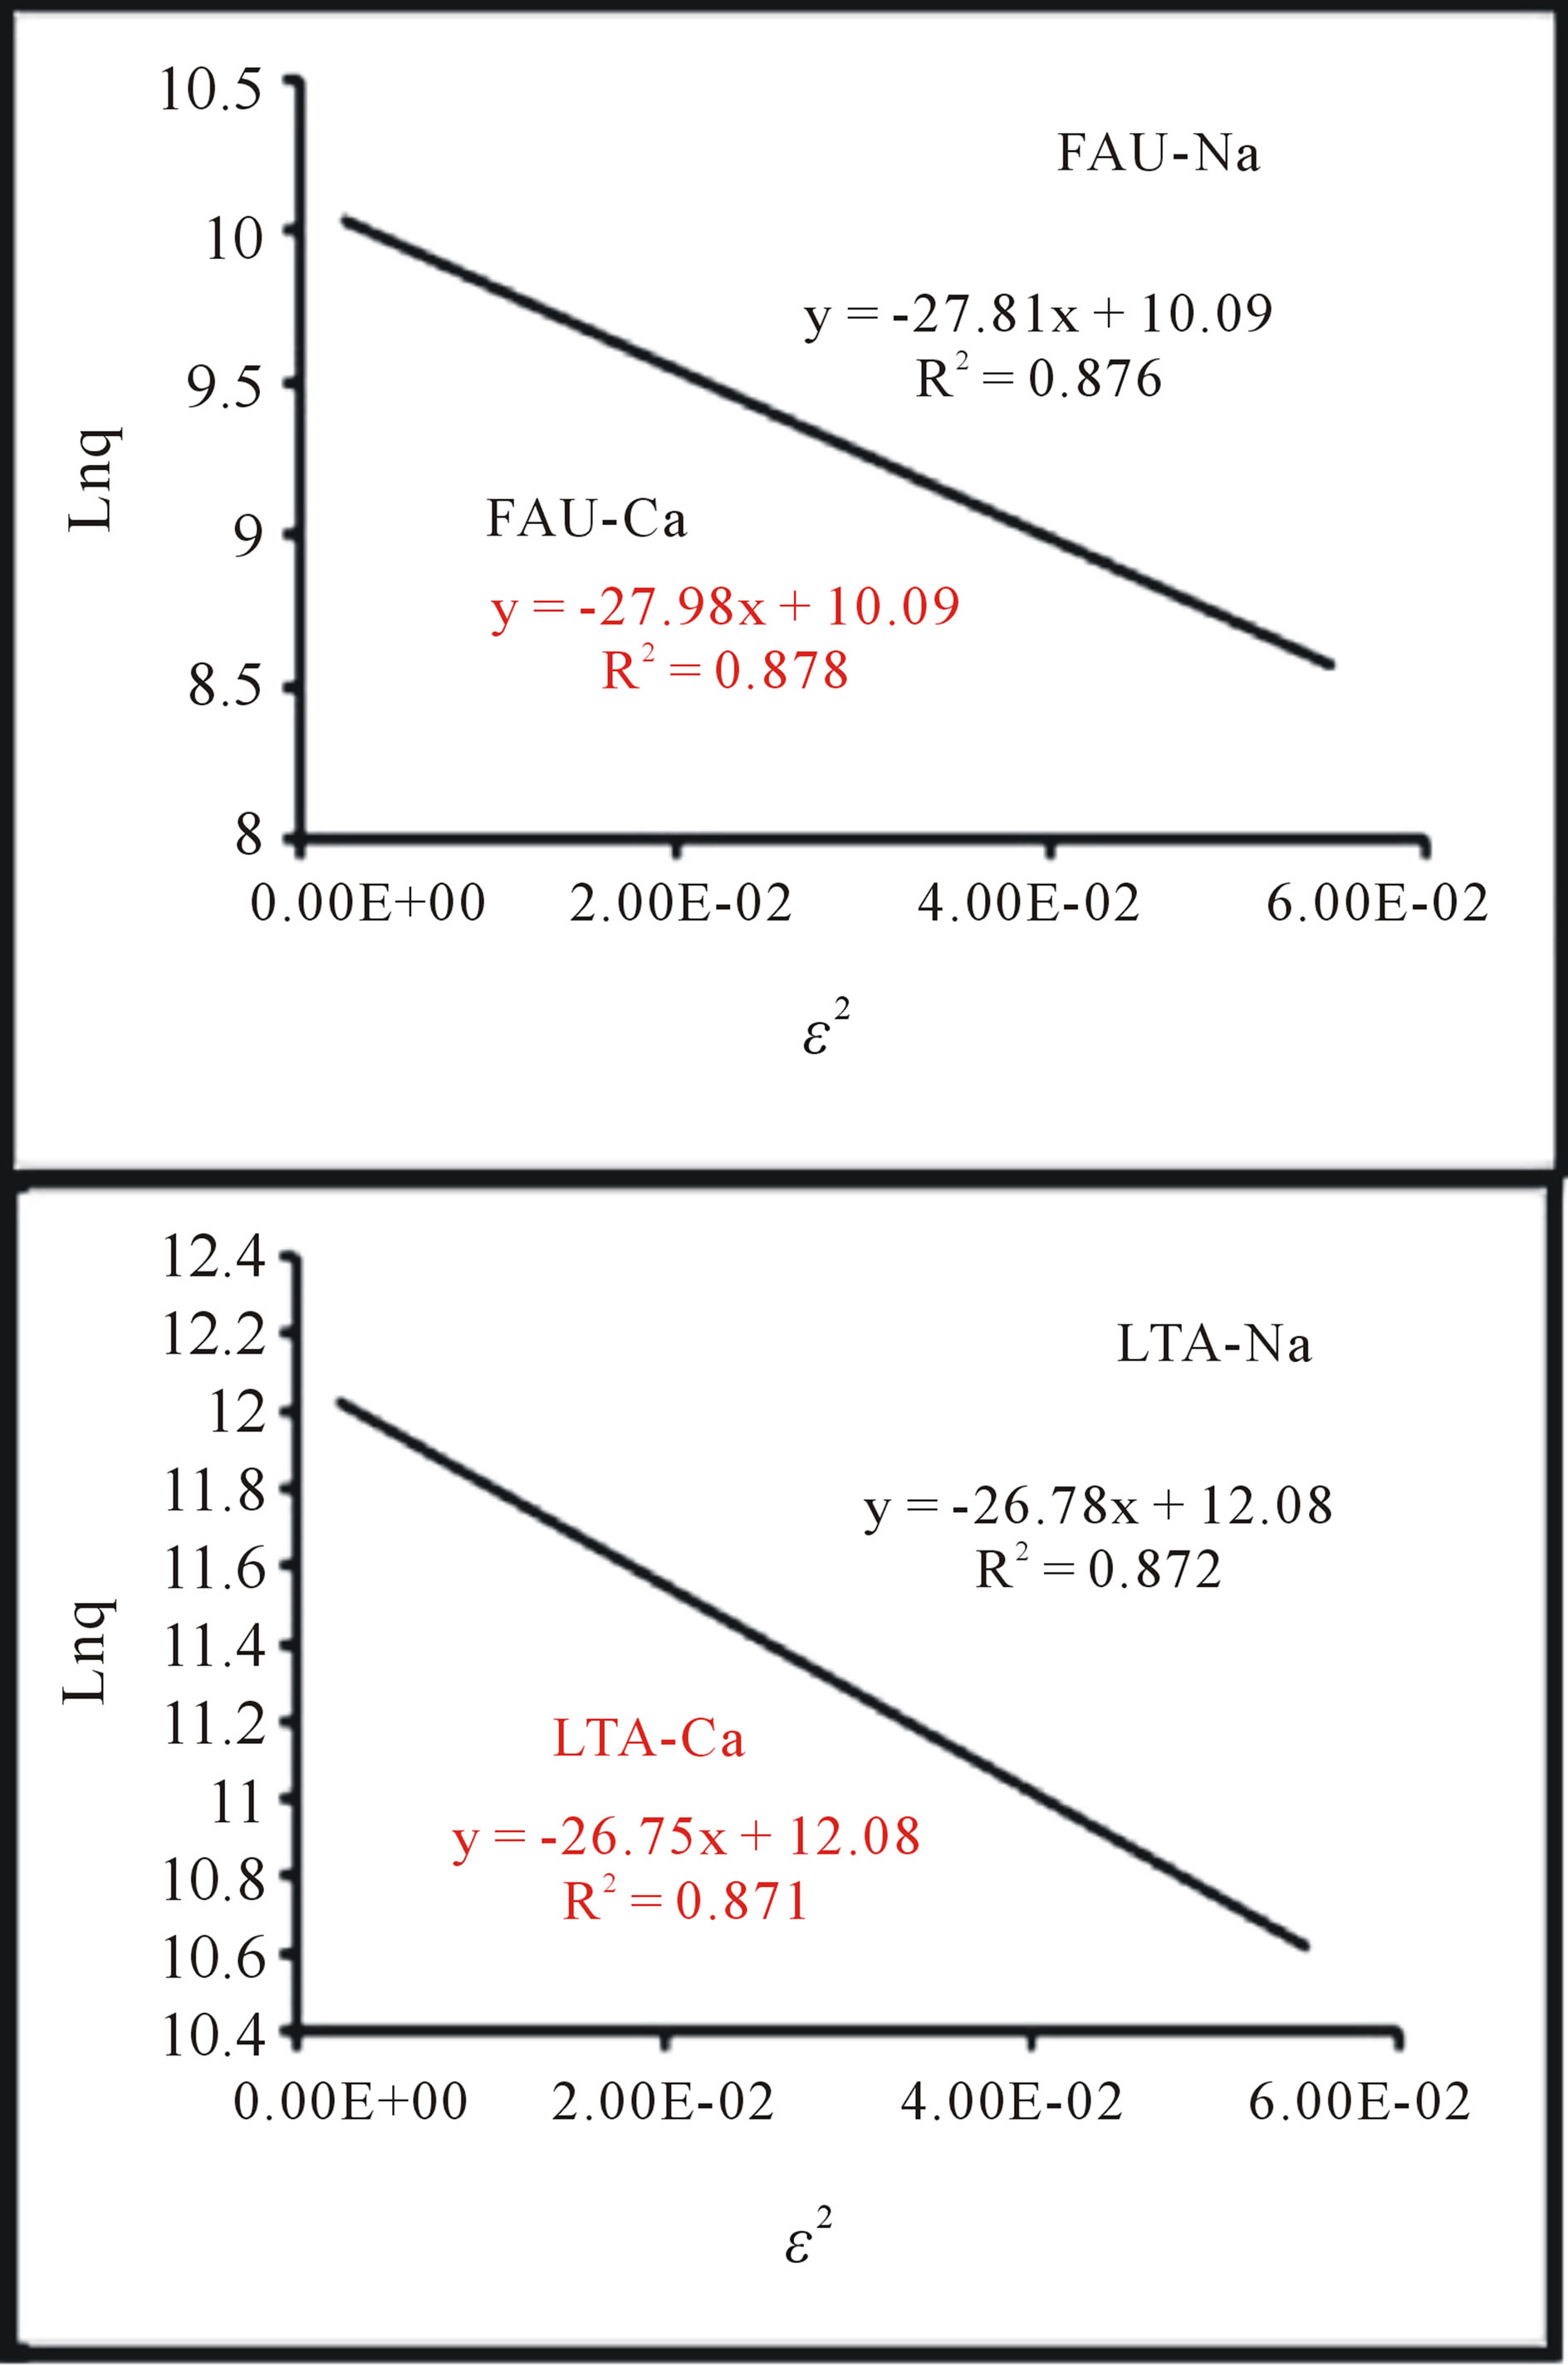
Figure 8. Isotherms D-R for the adsorption of Co(PDC)2 on the synthetic zeolites.
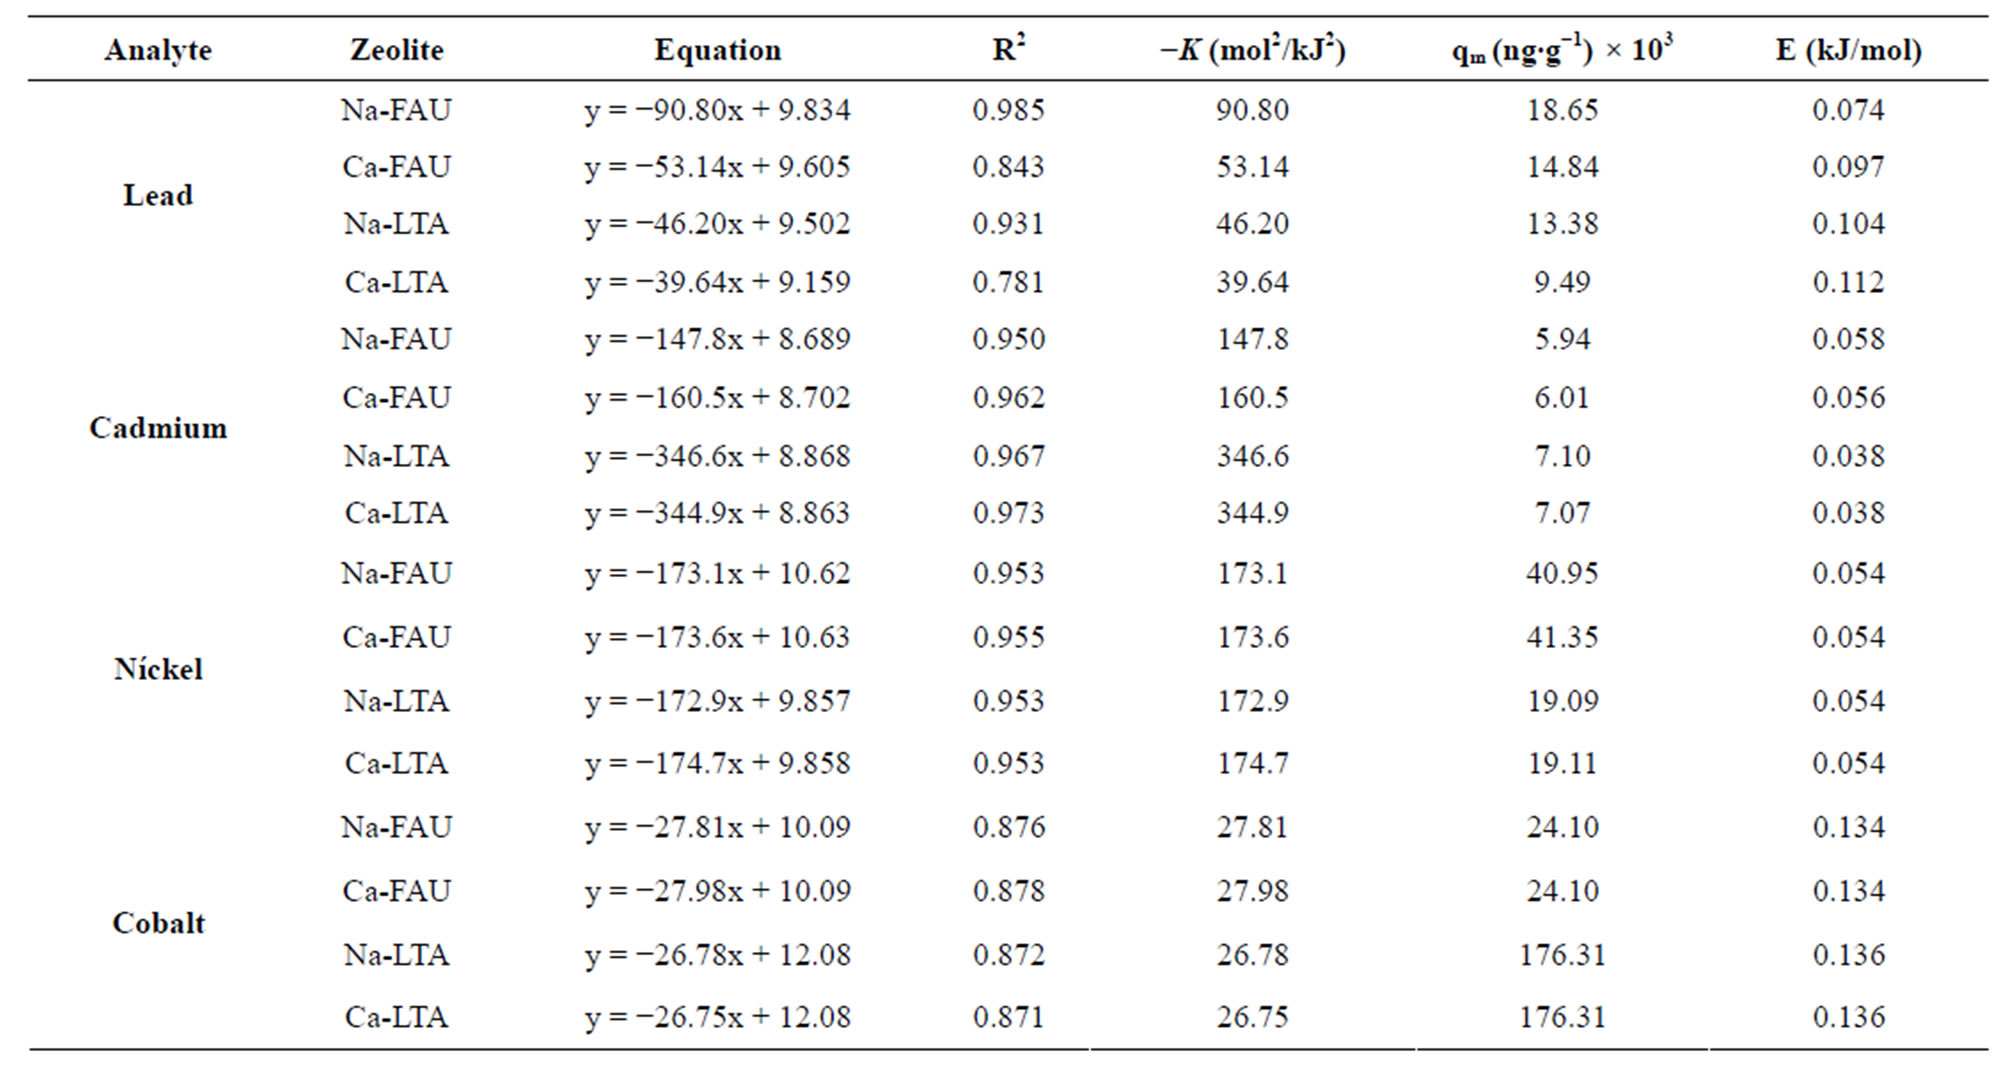
Table 4. Adsorption isotherm parameters of Dubinin-Radushkevich.
because the systems are different for each element. However, the adsorptivity was high (k < 5020 Freundlich) and adsorption mechanism was via physisorption (E < 8 kJ∙mol−1). The method is simple, accurate, economical and environmentally friendly and can be applied for the determination of these understudy metal ions in environmental samples.
5. Acknowledgements
The authors are grateful to the FondoNacional de Ciencia y Tecnología (FONACIT) and Consejo de DesarrolloCientífico, Humanístico, Tecnológico y de lasArtes (CDCHTA) for financial support, Proyects S1-97001192 and C-133105-08B respectively, Laboratorio de Análisis Químico Estructural de Materiales (LAQUEM) and Laboratorio de Cristalografía of the Universidad de Los Andes (ULA) Mérida-Venezuela.
REFERENCES
- M. R. Nabid, R. Sedghi, A. Bagheri, M. Behbahani, M. Taghizadeh, H. Abdi Oskooie and M. M. Heravi, “Preparation and Application of Poly(2-aminothiophenol)/ MWCNTs Nanocomposite for Adsorption and Separation of Cadmium and Lead Ions via Solid Phase Extraction,” Journal of Hazardous Materials, Vol. 203-204, 2012, pp. 93-100. doi:10.1016/j.jhazmat.2011.11.096
- G. Cheng, M. He, H. Peng and B. Hu, “Dithizone Modified Magnetic Nanoparticles for Fast and Selective Solid Phase Extraction of Trace Elements in Environmental and Biological Samples Prior to Their Determination by ICPOES,” Talanta, Vol. 88, 2012, pp. 507-515. doi:10.1016/j.talanta.2011.11.025
- I. Sánchez Trujillo, E. Vereda Alonso, A. García de Torres and J. M. Cano Pavón, “Development of a Solid Phase Extraction Method for the Multielement Determination of Trace Metals in Natural Waters Including Sea-Water by FI-ICP-MS,” Microchemical Journal, Vol. 101, 2012, pp. 87-94. doi:10.1016/j.microc.2011.11.003
- M. Jamshidi, M. Ghaedi, K. Mortazavi, M. N. Biareh and M. Soylak, “Determination of Some Metal Ions by Flame- AAS after Their Preconcentration Using Sodium Dodecyl Sulfate Coated Alumina Modified with 2-hydroxy-(3- ((1-H-indol 3-yle)phenyl) methyl) 1-H-indol (2-HIYPMI),” Food and Chemical Toxicology, Vol. 49, No. 6, 2011, pp. 1229-1234. doi:10.1016/j.fct.2011.02.025
- A. P. S. Gonzáles, M. A. Firmino, C. S. Nomura, F. R. P. Rocha, P. V. Oliveira and I. Gaubeur, “Peat as a Natural Solid-Phase for Copper Preconcentration and Determination in a Multicommuted Flow System Coupled to Flame Atomic Absorption Spectrometry,” Analytica Chimica Acta, Vol. 636, No. 2, 2009, pp. 198-204. doi:10.1016/j.aca.2009.01.047
- S. Samadi, H. Sereshti and Y. Assadi, “Ultra-Preconcentration and Determination of Thirteen Organophosphorus Pesticides in Water Samples Using Solid-Phase Extraction Followed by Dispersive Liquid-Liquid Microextraction and Gas Chromatography with Flame Photometric Detection,” Journal of Chromatography A, Vol. 1219, 2012, pp. 61-65. doi:10.1016/j.chroma.2011.11.019
- C. Duran, D. Ozdes, D. Sahin, V. N. Bulut, A. Gundogdu and M. Soylak, “Preconcentration of Cd(II) and Cu(II) Ions by Coprecipitation without Any Carrier Element in Some Food and Water Samples,” Microchemical Journal, Vol. 98, No. 2, 2011, pp. 317-322. doi:10.1016/j.microc.2011.02.018
- M. Chamsaz, A. Atarodi, M. Eftekhari, S. Asadpour and M. Adibi, “Vortex-Assisted Ionic Liquid Microextraction Coupled to Flame Atomic Absorption Spectrometry for Determination of Trace Levels of Cadmium in Real Samples,” Journal of Advanced Research, Vol. 4, 2013, pp. 35-41. doi:10.1016/j.jare.2011.12.002
- S. Z. Mohammadi, H. Hamidian, L. Karimzadeh and Z. Moeinadini, “Tween 80 Coated Alumina: An Alternative Support for Solid Phase Extraction of Copper, Nickel, Cobalt and Cadmium Prior to Flame Atomic Absorption Spectrometric Determination,” Arabian Journal of Chemistry, in Press, 2012. doi:10.1016/j.arabjc.2012.02.002
- R. Dobrowolski and M. Otto, “Determination of Nickel and Cobalt in Reference Plant Materials by Carbon Slurry Sampling GFAAS Technique after Their Simultaneous Preconcentration onto Modified Activated Carbon,” Journal of Food Composition and Analysis, Vol. 26, No. 1-2, 2012, pp. 58-65. doi:10.1016/j.jfca.2012.03.002
- S. Walas, A. Tobiasz, M. Gawin, B. Trzewik, M. Strojny and H. Mrowiec, “Application of a Metal Ion-Imprinted Polymer Based on Salen-Cu Complex to Flow Injection Preconcentration and FAAS Determination of Copper,” Talanta, Vol. 76, 2008, pp. 96-101. doi:10.1016/j.talanta.2008.02.008
- B. D. Koleva and E. Ivanova, “Flow Injection Analysis with Atomic Spectrometric Detection (Review Article),” Eurasian Journal of Analytical Chemistry, Vol. 3, No. 2, 2008, pp. 183-211.
- L. Elci, A. A. Kartal and M. Soylak, “Solid Phase Extraction Method for the Determination of iron, Lead and Chromium by Atomic Absorption Spectrometry Using Amberite XAD-2000 Column in Various Water Samples,” Journal of hazardous materials, Vol. 153, No. 1-2, 2008, pp. 454-461. doi:10.1016/j.jhazmat.2007.08.075
- F. Marahel, M. Ghaedi, M. Montazerozohori, M. Nejati Biyareh, S. Nasiri Kokhdan and M. Soylak, “Solid-Phase Extraction and Determination of Trace Amount of Some Metal Ions on Duolite XAD 761 Modified with a New Schiff Base as Chelating Agent in Some Food Samples,” Food and Chemical Toxicology, Vol. 49, 2011, pp. 208- 214. doi:10.1016/j.fct.2010.10.018
- H.-T. Fan, J. Li, Z.-C. Li and T. Sun, “An Ion-Imprinted Amino-Functionalized Silica Gel Sorbent Prepared by Hydrothermal Assisted Surface Imprinting Technique for Selective Removal of Cadmium (II) from Aqueous Solution,” Applied Surface Science, Vol. 258, No. 8, 2012, pp. 3815-3822. doi:10.1016/j.apsusc.2011.12.035
- A. Bartyzel and E. M. Cukrowska, “Solid Phase Extraction Method for the Separation and Determination of Chromium(III) in the Presence of Chromium(VI) Using Silica Gel Modified by N,N-bis-(α-methylsalicylidene)- 2,2-dimethyl-1,3-propanediimine,” Analytica Chimica Acta, Vol. 707, No. 1-2, 2011, pp. 204-209. doi:10.1016/j.aca.2011.09.023
- J. N. Bianchin, E. Martendal, R. Mior, V. N. Alves, C. S. T. Araújo, N. M. M. Coelho and E. Carasek, “Development of a Flow System for the Determination of Cadmium in Fuel Alcohol Using Vermicompost as Biosorbent and Flame Atomic Absorption Spectrometry,” Talanta, Vol. 78, No. 2, 2009, pp. 333-336. doi:10.1016/j.talanta.2008.11.012
- M. Ahmad, A. R. A. Usman, S. S. Lee, S.-C. Kim, J.-H. Joo, J. E. Yang and Y. S. Ok, “Eggshell and Coral Wastes as Low Cost Sorbents for the Removal of Pb2+, Cd2+ and Cu2+ from Aqueous Solutions,” Journal of Industrial and Engineering Chemistry, Vol. 18, 2012, pp. 198-204. doi:10.1016/j.jiec.2011.11.013
- A. Tobiasz, S. Walas, A. Soto Hernández and H. Mrowiec, “Application of Multiwall Carbon Nanotubes Impregnated with 5-Dodecylsalicylaldoxime for On-Line Copper Preconcentration and Determination in Water Samples by Flame Atomic Absorption Spectrometry,” Talanta, Vol. 96, 2012, pp. 89-95. doi:10.1016/j.talanta.2011.12.008
- R. S. Amais, J. S. Ribeiro, M. G. Segatelli, I. V. P. Yoshida, P. O. Luccas and C. R. T. Tarley, “Assessment of Nanocomposite Alumina Supported on Multi-Wall Carbon Nanotubes as Sorbent for On-Line Nickel Preconcentration in Water Samples,” Separation and Purification Technology, Vol. 58, 2007, pp. 122-128. doi:10.1016/j.seppur.2007.07.024
- Y. P. d. Peña, W. López, J. L. Burguera, M. Burguera, M. Gallignani, R. Brunetto, P. Carrero, C. Rondon and F. Imbert, “Synthetic Zeolites as Sorbent Material for On- Line Preconcentration of Copper Traces and Its Determination Using Flame Atomic Absorption Spectrometry,” Analytica Chimica Acta, Vol. 403, No. 1-2, 2000, pp. 249-258.
- D. Afzali, A. Mostafavi, M. A. Taher and A. Moradian, “Flame Atomic Absorption Spectrometry Determination of Trace Amounts of Copper after Separation and Preconcentration onto TDMBAC-Treated Analcime Pyrocatechol-Immobilized,” Talanta, Vol. 71, No. 2, 2007, pp. 971-975. doi:10.1016/j.talanta.2006.05.012
- V. M. Nurchi and I. Villaescusa, “Sorption of Toxic Metal Ions by Solid Sorbents: A Predictive Speciation Approach Based on Complex Formation Constants in Aqueous Solution,” Coordination Chemistry Reviews, Vol. 256, No. 1-2, 2012, pp. 212-221. doi:10.1016/j.ccr.2011.09.002
- A. O. Martins, E. L. da Silva, E. Carasek, N. S. Gonçalves, M. C. M. Laranjeira and V. T. de Fávere, “Chelating Resin from Functionalization of Chitosan with Complexing Agent 8-Hydroxyquinoline: Application for Metal Ions on Line Preconcentration System,” Analytica Chimica Acta, Vol. 521, No. 2, 2004, pp. 157-162. doi:10.1016/j.aca.2004.06.033
- D. Afzali, A. Mostafavi, F. Etemadi and A. Ghazizadeh, “Application of Modified Multiwalled Carbon Nanotubes as Solid Sorbent for Separation and Preconcentration of Trace Amounts of Manganese Ions,” Arabian Journal of Chemistry, Vol. 5, No. 2, 2012, pp. 187-191. doi:10.1016/j.arabjc.2010.08.012
- A. N. Anthemidis, G. Giakisikli, S. Xidia and M. Miró, “On-Line Sorptive Preconcentration Platform Incorporating a Readily Exchangeable Oasis HLB Extraction Micro-Cartridge for Trace Cadmium and Lead Determination by Flow Injection-Flame Atomic Absorption Spectrometry,” Microchemical Journal, Vol. 98, 2011, pp. 66- 71. doi:10.1016/j.microc.2010.11.007
- Y. Petit de Peña, B. Paredes, W. Rondón, M. Burguera, J. L. Burguera, C. Rondón, P. Carrero and T. Capote, “Continuous Flow System for Lead Determination by Faas in Spirituous Beverages with Solid Phase Extraction and On-Line Copper Removal,” Talanta, Vol. 64, No. 5, 2004, pp. 1351-1358. doi:10.1016/j.talanta.2004.05.053
- C. Baerlocher and L. B. McCusker, “Database of Zeolite Structures,” 2013. http://www.iza-structure.org/databases
- M. Al-Anber and Z. A. Al-Anber, “Utilization of Natural zeolite as Ion-Exchange and Sorbent Material in the Removal of Iron,” Desalination, Vol. 225, No. 1-3, 2008, pp. 70-81. doi:10.1016/j.desal.2007.07.006
- O. L. Corona, M. A. Hernández, F. Hernández, F. Rojas, R. Portillo, V. H. Lara and F. M. Carlos, “Propiedades de Adsorción en Zeolitas con Anillos de 8 Miembros: I. Microporosidad y Superficie Externa,” Matéria (Río J.), Vol. 14, No. 3, 2009, pp. 918-931.
- C. R. Melo, H. G. Riella, N. C. Kuhnen, E. Angioletto, A. R. Melo, A. M. Bernardin, M. R. da Rocha and L. da Silva, “Synthesis of 4A Zeolites from Kaolin for Obtaining 5A Zeolites through Ionic Exchange for Adsorption of Arsenic,” Materials Science and Engineering B, Vol. 177, No. 4, 2012, pp. 345-349. doi:10.1016/j.mseb.2012.01.015
- F. E. Imbert, C. Moreno, A. Montero, B. Fontal and J. Lujano, “Venezuelan Natural Alumosilicates as a Feedstock in the Synthesis of Zeolite A,” Zeolites, Vol. 14, No. 5, 1994, pp. 374-378. doi:10.1016/0144-2449(94)90112-0
- JCPDS, “PDF-2 Database ICDD,” Newton Square, 2001.
- Y. M. Liew, H. Kamarudin, A. M. Mustafa Al Bakri, M. Luqman, I. Khairul Nizar, C. M. Ruzaidi and C. Y. Heah, “Processing and Characterization of Calcined Kaolin Cement Powder,” Construction and Building Materials, Vol. 30, 2012, pp. 794-802. doi:10.1016/j.conbuildmat.2011.12.079
- R. T. Rigo, S. B. C. Pergher, D. I. Petkowicz and J. H. Z. d. Santos, “A New Procedure for a Zeolite Synthesis from Natural Clays,” Química Nova, Vol. 32, No. 2009, pp. 21-25.
- T. Frising and P. Leflaive, “Extraframework Cation Distributions in X and Y Faujasite Zeolites: A Review,” Microporous and Mesoporous Materials, Vol. 114, No. 1-3, 2008, pp. 27-63. doi:10.1016/j.micromeso.2007.12.024
- M. Tuzen, K. Parlar and M. Soylak, “Enrichment/Separation of Cadmium(II) and Lead(II) in Environmental Samples by Solid Phase Extraction,” Journal of Hazardous Materials, Vol. 121, No. 1-3, 2005, pp. 79-87. doi:10.1016/j.jhazmat.2005.01.015
- O. Gezici, H. Kara, A. Ayar and M. Topkafa, “Sorption Behavior of Cu(II) Ions on Insolubilized Humic Acid under Acidic Conditions: An Application of Scatchard Plot Analysis in Evaluating the pH Dependence of Specific and Nonspecific Bindings,” Separation and Purification Technology, Vol. 55, 2007, pp. 132-139. doi:10.1016/j.seppur.2006.11.012
- O. Gezici, H. Kara, M. Ersoz and Y. Abali, “The Sorption Behavior of a Nickel-Insolubilized Humic Acid System in a Column Arrangement,” Journal of Colloid and Interface Science, Vol. 292, No. 2, 2005, pp. 381-391. doi:10.1016/j.jcis.2005.06.009
NOTES
*Corresponding author.