Journal of Computer and Communications
Vol.1 No.4(2013), Article ID:38652,5 pages DOI:10.4236/jcc.2013.14005
Neuropathology Classifier Based on Higher Order Spectra
![]()
Center of Bioengineering Research, Faculty of Engineering, University of Carabobo, Bárbula, Venezuela.
Email: cseijas@uc.edu.ve, svillaza@uc.edu.ve, acaralli@uc.edu.ve
Copyright © 2013 Cesar Seijas et al. This is an open access article distributed under the Creative Commons Attribution License, which permits unrestricted use, distribution, and reproduction in any medium, provided the original work is properly cited.
Received October 1st, 2013; revised October 19th, 2013; accepted October 25th, 2013
Keywords: Higher Order Spectra; Classification; Support Vector Machines; EEG; Epilepsy
ABSTRACT
Epilepsy is the most common neuropathology. Statistical studies related to the disease reported that 20% - 25% of epileptic patients with occurrence of seizures were even under treatment with drugs. This article presents a strategy for improved detection of the neuropathology, based on electroencephalogram (EEG), using a classifier built with support vector machines (SVC). The SVC is designed based on feature extraction of higher order spectra of time series derived from the EEG applied to epileptic patients and control patients. As demonstrated in the study presented, the EEG time series are highly nonlinear and non-Gaussian, therefore, exhibit higher order spectra, which are extracted features that improve the accuracy in the performance of SVC. The results of this study suggest the development of highly accurate computational tools for the diagnosis of this dreaded neuropathology.
1. Introduction
Electroencephalography is the neurophysiologic measurement of brain electrical activity by recording obtained from electrodes placed on the skull. The set of traces obtained is known as electroencephalogram (EEG) and represents an electrical signal (postsynaptic biopotentials) of a large number of neurons, or brain activity; the spatial distribution in the location of the electrodes forms a map of points separated 10% or 20% of the total area under registration, the selective distribution in the location of the electrodes is known as an international system of electrode placement 10 - 20 [1,2]. The EEG is primarily used in monitoring and diagnosis of brain diseases such as epilepsy, syncope, sleep disorders, in some cases declaring dementia, coma and brain death (in some jurisdictions are used as legal evidence of brain death). The EEG has the great advantage of being a noninvasive diagnostic method and painless, hence the great importance of its implementation and analysis. From the viewpoint of signal processing, EEG analysis for the processing of time series, a topic extensively developed in the area of stochastic modeling in the identification of signals and systems and the pattern recognition. The aim of this paper is to develop a classifier built with support vector machines, based on the processing of features extracted from EEG signals (EEG) using higher order spectral statistics.
2. Theoretical fundaments
2.1. EEG Analysis
The issue of dynamic interpretation of the EEG has been the subject of much discussion among researchers; in recent times it has focused on two different models. The first approach considers the EEG time series as linear stochastic processes, i.e., the EEG signals are analyzed using linear techniques such as parametric spectral models, e.g., ARMA models or non-parametric Fourier transforms or wavelets [3]. In [4] is verified Gaussian behavior at short length records of parkinsonian patients. The other approach is based on nonlinear dynamics, considering the EEG as a deterministic but chaotic signal as some records show a tendency towards a characteristic 1/f (f means frequency) that cannot be described by a linear analysis. The EEG processing and analysis must resolve a fundamental question: should the signal be analyzed from a deterministic or stochastic point of view? and the first case, as outlined in [5], to establish whether the signal is deterministic chaotic nature or chaotic.
2.2. Nonlinear Analysis using Higher Order Statistics
Analysis of nonlinear signals is insufficient using characteristic parameters of linear time series with normal distribution function (Gaussian), such as power spectrum and autocorrelation function, due to, among other reasons, loss of information of phase. This severe limitation can be avoided by using Higher Order Statistics (HOS) [6,7]. HOS are defined as the moments and cumulants of order higher than the second (the moments of order 1 and 2 are the mean and variance, respectively).
2.3. Definition and Properties of HOS
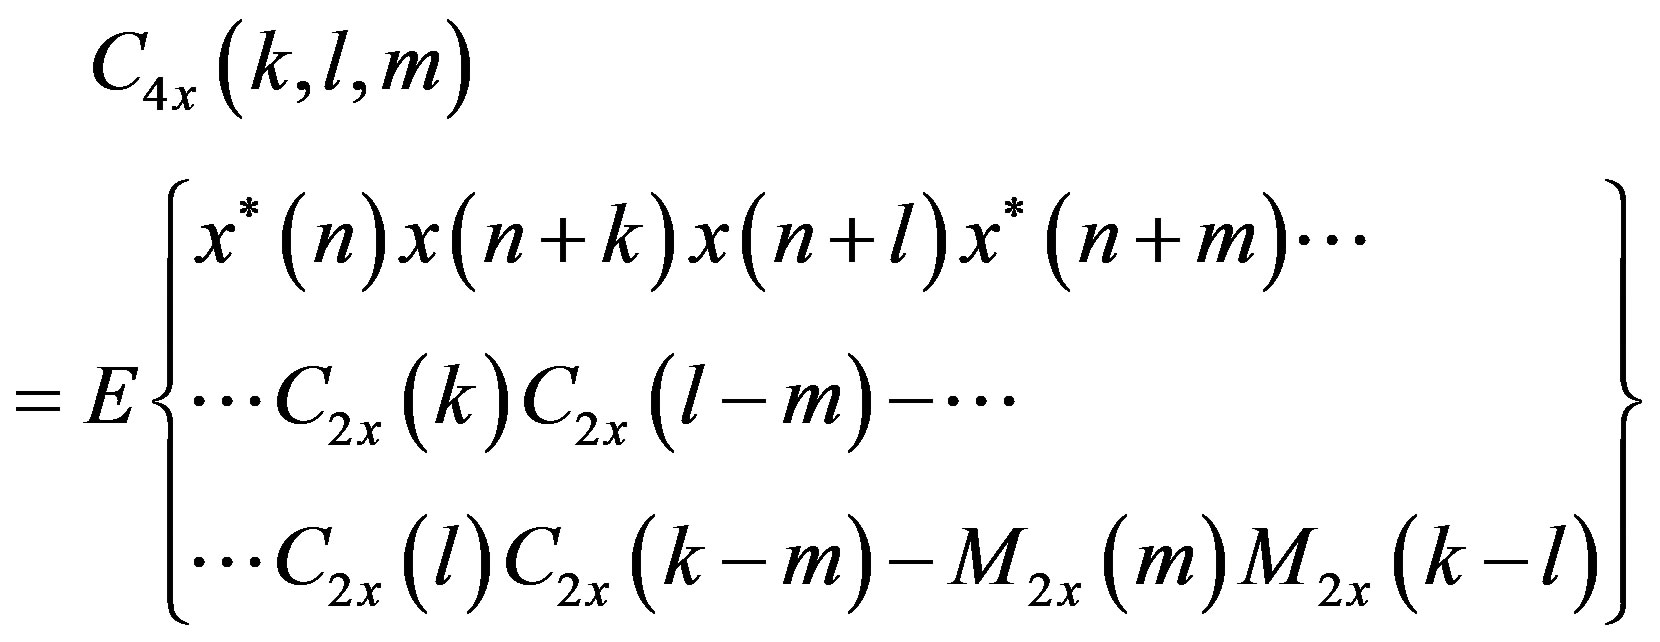
The HOS are defined in terms of its moments and cumulants, and their spectra; the most interesting are the third and fourth order and their Fourier transforms, termed bispectrum and triespectrum, respectively. As discussed below, higher order moments are natural generalizations of the autocorrelation sequence, while the so-called cumulants Cix (∙) are nonlinear combinations of themselves as show in the Equations (1)-(4).
 (1)
(1)
 (2)
(2)
 (3)
(3)
 (4)
(4)
where the superscript “asterisk” denotes the signal complex conjugate. In the case of zero delay, the cumulants are named as follow: C2x(0) is the variance ( ); C3X(0, 0) and C4x(0, 0, 0) are usually identified as g3x and g4x and their normalized values, γ3x/(
 ) and γ4x/(
 ) are skewness and kurtosis respectively. The latter normalized quantities exhibit the property of shift and scale invariance; the shift invariance indicates that it should be defined with mean value zero.
The bispectrum S3x(f1, f2) and triespectrum S4x(f1, f2, f3) and their cumulants are related to the Fourier transform of the respective signal by (Equations (5) and (6)):
 (5)
(5)
 (6)
(6)
and equivalently in the case of bispectrum S3x(f1, f2) from the spectral response of the signal X(f):
 (7)
(7)
evaluated in the “non-redundant zone” bounded by the Nyquist frequency fN, i.e., for frequencies f1 + f2 ≤ fN.
Another useful statistic for the analysis of linearity and Gaussian time series is the bicoherence. In case of three signals x, y, z, bicoherence is called cross bicoherence, bicxyz(f1, f2) and in the case of a single signal, which is the most interest in this application is represented as bicxxx(∙):
 (8)
(8)
 (9)
(9)
3. Linearity and Gaussian Test
A statistical test for linearity and/or Gaussian signals check is Hinich algorithm [6]; this algorithm is based on detecting the condition of obliquity (skewness different from zero). Basically, it is based on the fact that for a Gaussian process, the cumulants of order greater than two are zero, and consequently so are the bispectrum and therefore the bicoherence. Then, there is the null hypothesis of non-Gaussian if it is determined that the bispectrum is nonzero; on other hand, if besides the bicoherence, is not constant we must conclude that the process is nonlinear. A toolbox of free use (HOSA [6]), developed under the Matlab mathematical software implements the Hinich algorithm (routine “glstat”) making consistent and unbiased estimates of the bicoherence from Equation (9).
3.1. Methodology and Analysis of Results
This section describes the methodology that was developed for EEG signal processing, beginning with removal techniques and/or reduction of artifacts, measurement and determination of the nonlinearity and nongaussian, or at least, the choice of segments that exhibit this feature, in order to be processed with nonlinear analysis techniques (Fourier spectral response of higher-order spectra), finally extraction of features to train a classifier that allows discrimination between healthy patients or patients suffering from a neuropathology (specifically, epilepsy, in the case of this paper). EEG signals to be processed correspond to encephalographic records from a database used by Guillén et al. [3] of 20 EEG, 10 healthy patients and 10 epileptic patients, in a preliminary work which used the technique of signal analysis using symbolic dynamics techniques for classification. Each EEG signal is organized as a matrix of 21 columns with 15,000 samples, which were captured at a sampling frequency of 256 Hz, corresponding to segments of time series of approximately 60 seconds long, on average. Given the EEG signals from a control and an epileptic patient, we proceed to develop the following methodology:
1) Using EEGLAB [8,9] were loaded onto the workspace of mathematical software used, the above signals were bandpass filtered between 0.1 and 80 Hz, with an additional filtering of 60 Hz noise line rejection. Figure 1 shows the set of signals identified with the notation by electrode in a time segment of 5 seconds between instants 22 and 27, the vertical scale was calibrated at 37 mV/division.
Figure 2 shows the spectral response corresponding to the EEG channel record with higher energy under analysis (channel O1), note the 10 Hz spectral component, that exhibits a maximum peak power (≈+7.12 dB), which is an indicative of brain activity a corticothalamic of the patient; as well as the strong rejection of common mode line noise of approximately −44 dB, below the highest energy components.
Figure 3 is the quantile-quantile statistical graph (QQ Plot) [10] for Gaussian test of the previously selected channel signal. This graph shows how the line is separated from the linear reference index of normal (Gaussian). Statistical evaluation, using Kolmogorov-Smirnov test [10] confirms the nongaussian EEG signal of a patient neurologically healthy.
In the EEG of epileptic patients, it was observed higher energy concentrated in all patterns of each channel (low frequency components are above +25 dB, against little more than 10 dB in patterns of healthy patients).
2) For each of the studied records it was identified the channel that exhibited highest power [9] and from this time series, was extracted, randomly, 10 nonoverlapping segments of 2000 samples in length, thus conforming a database composed of 200 segments of 2000 samples each one.
3) The nonlinearity and non-Gaussian test were applied to each segment using previously described methods and algorithms, verifying such a condition. In each experiment was measured the maximum bicoherenceand the frequency pair where it occurred. For each segment, it was associated a vector of features of two components: bicoherence and maximum channel power, calculated as the variance of the signal. In this way, we built a matrix of 200 rows and 2 columns (200 vectors of 2 components each one); 80% of those vectors were separated randomly to build the training set and the remaining 20% as validation set. On average, the vectors of epileptic patients showed features of high power, with the lowest bicoherence; the latter, it was associated a lower quadratic phase coupling [6] in the EEG of these patients, compared to control (short term frequency in the denominator of Equation (9)).
4) Support vector machines based classifier was implemented (SVC [11-13]) and was trained and validated, with the matrices listed above. In the developed application in this paper, the best performance, as a function kernel, was exhibited by radial basis function after testing different kernel functions tuning their parameters. The best tuned parameters were s = 0.001, C = 100 and e = 0.1 for the designed SVC, achieving a success in the validation process more than 92%. Figure 4 shows the graphical output of SVC [14].
4. Conclusion
It was verified that the highly nonlinear behavior and nongaussian of the time series are derived from EEG records and, therefore the asserted choice of use, as features, of the higher-order statistical parameters of these nongaussian and nonlinear processes, in order to detect neurophysiological patterns. The implemented SVC showed satisfactory performance as classifier, which indicates a promising future application of the SVC in the area of modeling of biochemical and electrophysiological processes. Results presented in this article attest to the

Figure 1. EEG waveforms of a control patient.

Figure 2. Spectral response of a control patient

Figure 3. QQ plot of O1 channel from a control patient.
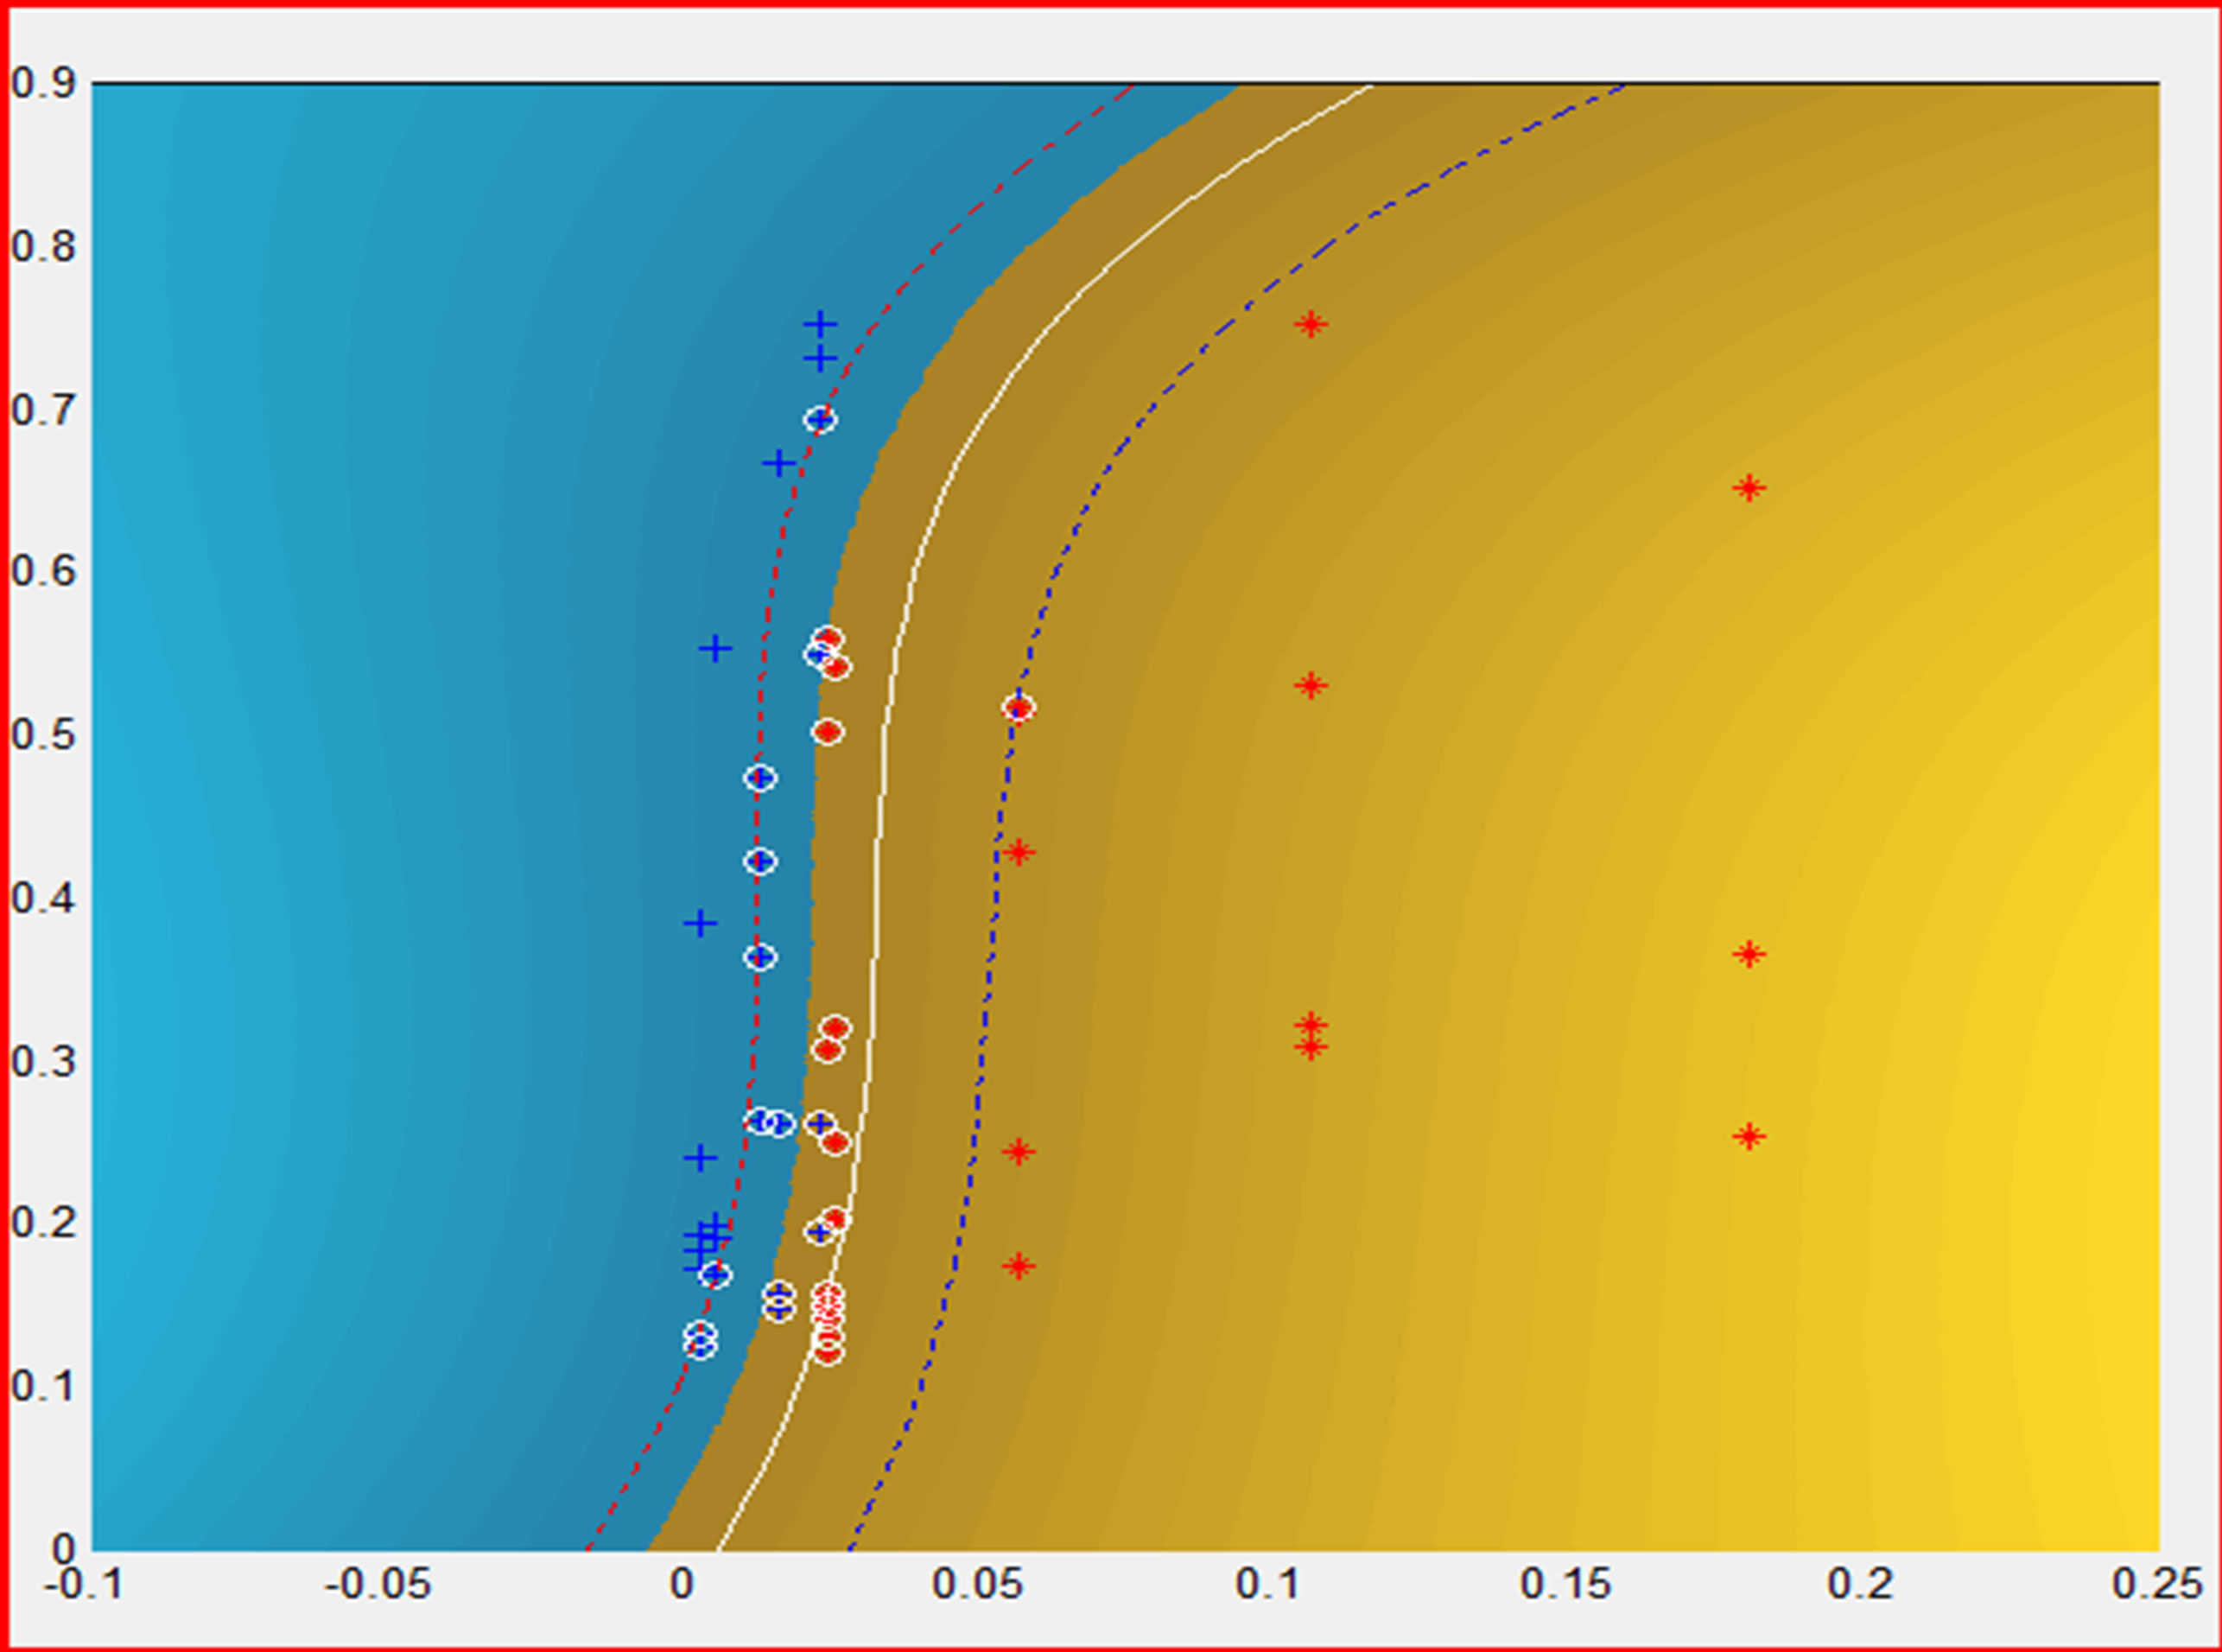
Figure 4. SVC output. Class+: Epileptic Patient; Class*: Control Patient
development of new computational tools for high accuracy in the diagnosis of terrible neuropathology epilepsy.
REFERENCES
- L. Sörnmo and P. Laguna, “Bioelectrical Signals Processing in Cardiac and Neurological Applications,” Elsevier Academic Press, Amsterdam, 2005.
- M. Teplan, “Fundamentals of EEG Measurement,” Measurement Science Review, Vol. 2, Section 2, Bratislava, Slovakia, 2002.
- P. Guillén, “Procesamiento Digital de EEG,” Universidad de los Andes, Mérida, Venezuela, Noviembre 2005.
- J. Morales, J. Teijeiro, E. Guerra, G. López and R. Masías. “Detección de No-Gaussianidad en Señales Eléctricas de Estructuras Cerebrales Profundas,” Bioingeniería y Física Medica Cubana, Vol. 3, No. 2, 2002, pp. 18-24.
- D. Luengo, “Estimación Óptima de Secuencias Caóticas con Aplicación en Comunicaciones,” Tesis Doctoral, Universidad de Cantabria, Cantabria, 2006.
- A. Swami, J. Mendel and C. Nikias, “Higher-Order Spectral Analysis Toolbox: User’s Guide,” Version 6.0, The MathWorks Inc., Natick, 2007.
- P. Venkatakrishnana, S. Sangeethab and R. Sukaneshc, “Detection of Quadratic Phase Coupling from Human EEG Signals using Higher Order Statistics and Spectra,” Department of Information Technology, Thiagarajar College of Engineering, Madurai, Tamil Nadu, India, 2009. http://www.cscjournals.org/csc/manuscript/Journals/SPIJ/volume3/Issue4/SPIJ-29.pdf
- A. Delourne and S. Makeig, “EEGLab,” Version 7, Swartz Center for Computational Neuroscience, Institute for Neural Computation, University of California San Diego, San Diego, April 2008.
- A. Delorme and S. Makeig, “EEGLAB: An Open Source Toolbox for Analysis of Single-Trial EEG Dynamics Including Independent Component Analysis,” Journal of Neuroscience Methods, Vol. 134, 2004, pp. 9-21. www.elsevier.com.locate.jneumeth
- The MathWorks Team, “Statistics Toolbox 6 User’s Guide,” Version 6.0, The MathWorks Inc., Natick, 2007.
- B. Florentino, “Modelling an Epileptic Brain Pattern Classification,” MsC Thesis, University of Reading, United Kingdom, 2008.
- C. Seijas, A. Caralli and S. Villazana, “Estimation of Action Potential of the Cellular Membrane using Support Vectors Machines,” Proceedings of the 28th IEEE EMBS Annual International Conference, New York City, Aug 30-Sept 3 2006, pp. 4200-4204,
- C. Seijas, A. Caralli and S. Villazana, “Estimation of Brain Activity using Support Vector Machines,” Proceedings of the 3rd IEEE EMBS International Conference on Neural Engineering, Hawaii, 2-5 May 2007, pp. 604- 607.
- S. Villazana and G. Montilla, “Un Toolbox para Procesamiento de Señales usando Máquinas de Vectores de Soporte,” Centro de Procesamiento de Imágenes, Facultad de Ingeniería, Universidad de Carabobo, Valencia, Venezuela, 2008.