 Vol.3, No.5, 351-358 (2011) Natural Science http://dx.doi.org/10.4236/ns.2011.35047 Copyright © 2011 SciRes. OPEN ACCESS Non-stationary drivers of polar sea ice area Reginald R. Muskett Geophysical Institute, University of Alaska Fairbanks, Fairbanks, USA; rmuskett@gi.alaska.edu Received 12 February 2011; revised 20 March 2011; accepted 18 April 2011. ABSTRACT From 2002 through 2008 the secular rate of de- creasing sea ice area in the northern hemi- sphere accelerated by a factor of 18, whereas the secular rate of increasing sea ice area in the southern hemisphere accelerated by a factor of 16, relative to the rates from 1978 through 2007. These were derived from the daily sea ice area retrieved from the Scanning Multi-channel Mi- crowave Radiometer – Special Sensor Micro- wave/Imager and the Advanced Microwave Scan- ning Radiometer for the Earth Observation Sys- tem. The “annual” cycle of northern and south- ern sea ice areas, the number of days between maxima and minima is 372.4, on average, a fre- quency modulation, with a recurrence interval of 61.7 years. Significant spectral power occurs at the quasi-4-day through 120-day frequencies. The frequency content and modulation of the daily time series’ are consistent inter-monthly to inter-seasonal frequencies of solar irradiance, atmospheric-oceanic Rossby waves, length-of- day, and polar motion. This suggests conserva- tion of angular momentum of the atmosphere – sea-ice – ocean system. The near 60-year modu- lation and analysis of the detrended daily time series of the Arctic and Antarctic sea ice areas suggest the accelerations shown by the secular trends are relatively short-lived and reversible within an interval of one-quarter (15-years) to one-half (30-years) of the modulation period. Keywords: Hemispheric Sea-Ice Area Changes; Trends; Frequency Modulations; Physical Drivers 1. INTRODUCTION The sea ice areas at the polar oceans serve a vital function through surface albedo in the energy balance and climate system of Earth [1-5]. Forcing on sea ice area (growth and decay) comes from solar radiation, infrared radiation under cloudy-sky conditions, ocean kinematics and heat transfer, and surface winds acting on daily, seasonal, annual, inter-annual, decadal and longer time scales. Satellite datasets of the daily sea ice area of the northern and southern hemispheres can be assessed for secular trends and variations [6-10]. Figure 1 shows the northern (Arctic, left) and southern hemisphere (An- tarctic, right) sea ice area, on 17 August 2008, seen in colorized concentration per pixel from satellite observa- tions. The annual growth, decay and net changes in polar sea ice areas and the hemispheric asymmetry derived by satellite-borne passive microwave sensors were first de- scribed by Cavalieri et al. [6]. These data are available from the National Snow and Ice Data Canter, Univ. Col- orado, as the NASA TEAM from late 1978 through end of 2007 and the BOOTSTRAP from late 1978 through end of 2006. The algorithms used in the retrieval of sea ice area and area-extent use surface brightness tempera- tures to derive grid cells with sea ice concentrations above 15%. In this fashion, sea ice area-extent is defined as the cumulative area of grid cells with concentration of sea ice greater than 15% per gridcell, relative to water, and sea ice area is defined as the cumulative area of sea ice with 100% sea ice concentration per grid cell (a more conservative estimator). The algorithmic measurement and calibrations, for the scanning multi-channel micro- wave radiometer (SMMR) which was flown on Nimbus Figure 1. Northern (left) and southern hemisphere (right) sea ice areas on 17 August 2008. Sea ice concentration images were provided by the Polar Research Group, Department of Atmospheric Sci- ences, University of Illinois, Urbana-Champaign.  R. R. Muskett / Natural Science 3 (2011) 351-358 Copyright © 2011 SciRes. OPEN ACCESS 352 7 from late 1978 through late 1987, and the Defense Meteorological Satellite Program special sensor micro- wave/imager (SSM/I) which was flown on satellites F8, F11, F13 and F15 (F13 is till operational and F15 re- cently experienced anomalous behavior) began from mid-1987 and current is described in Cavalieri et al. [7]. In this investigation we will use the daily sea ice area (not extent) from the NASA TEAM algorithm, from the northern (Arctic) and southern hemisphere (Antarctic) since it covers the longer time interval from October 1978 through the end of December 2007. The daily summation of the hemispheres gives the daily global sea ice area. The SMMR portion of the dataset with missing values and the early portion of the SSM/I record from 3 December through 12 January with missing values, were filled by linear interpolation. In addition to the SMMR-SSM/I time series of sea ice area we use daily sea ice area data from the Advanced Microwave Scanning Radiometer for the Earth Observa- tion System (AMSR-E), derived through an algorithm developed by scientists Institute of Oceanography, Uni- versity of Hamburg, Germany [11]. This sensor, flown on the NASA-Aqua satellite, provides a dataset that covers the period from mid-2002 through 2008, for comparison with the SMMR-SSM/I data. The AMSR-E sensor differs from the SSM/I passive-microwave sensor in having more brightness temperature channels and a greater spatial resolution, 6-by-4 km at the primary 89 GHz channel. Comparisons of retrieved sea ice area by these algorithms and ship-borne estimates showed good agree- ment [11]. A few missing day-values of the AMSR-E time series were filled by linear interpolation. Figure 2 illustrates the daily sea ice area time series, the polar sea ice area (sum of the same-day Arctic and Antarctic sea ice areas), from SMMR-SSM/I from late- 1978 through 2007 (top) and from AMSR-E from late- 2002 through 2008 (bottom). The curious shape of the sinusoidal is due to the day of the Arctic and Antarctic minima and maxima which do not coincide. The calen- dar-day occurrence of minimum and maximum varies over the length of the time series. The green lines signify the global area maxima and minima of the daily time series for comparison. The global sea ice area attained an upper-bound maximum in 1987 (top, solid green line). Minima after 1997 (top, dashed green line) have been variable, though decreasing since 2005 (bottom, dashed green line). Previous studies of trends and variations of Arctic and Antarctic sea ice extents and areas utilized the same SMMR-SSM/I daily satellite datasets although over dif- ferent total-year lengths with monthly and annual aver- aging and time-domain and frequency-domain smooth- ing [6-8]. Uncorrelated inter-annual periodicities that Figure 2. Daily time series of polar sea ice area from SMMR- SSM/I NASA Team algorithm. Gaps in the records were filled by linear interpolation. remained were dominant at 5-year period in the Arctic, and 3-year period in the Antarctic of sea ice extent. Net decadal decrease in the Arctic sea ice extent – area and the increase in Antarctic sea ice extent – area were at- tributed to increasing atmospheric CO2 concentrations, consistent with results of a global circulation model with gradual CO2 forcing [6-12]. This has again been brought to attention given the anomalous reduction of Arctic Sea ice extent in the summer of 2007, while the Antarctic sea ice extent continues to increase without any noted un- usual seasonal changes [11,13,14]. We note the existence of calendar (day-month-year) and averaging (aggregation) effects, which can lead to spurious anomalies and trends; such as the leap-year effect noted in daily/monthly temperature data and many other calendar effects known to financial statistics [15, 16]. Smoothing of data whether in the time-domain or the frequency-domain can be filled with problems asso- ciated with introducing bias into the analysis [17]. The SMMR-SSM/I daily sea ice extent and area time series are both seasonal and non-stationary (i.e. the mean and variance change over time, hence time dependent). This has likely lent to reports of citing seemingly conflicting derived trends, magnitudes and polarities [8,12,18]. Tem- poral aggregating of discrete non-stationary time series can lead to aliases, spurious correlations and false- eaks in autoregressive moving average models [19,20]. For these reasons, we will investigate the datasets without  R. R. Muskett / Natural Science 3 (2011) 351-358 Copyright © 2011 SciRes. OPEN ACCESS 353 calendar-based monthly and annual averaging, and with- out time-domain and frequency domain smoothing or autoregressive moving average techniques [21]. Our ap- proach is to utilize linear regression to identify trends, secular and higher-order, and the Discrete Fast Fourier Transform with zero-padding [22,23]. We then use the secular trends to detrend the daily Arctic, Antarctic and Global time series to investigate their frequency content. 2. RESULTS 2.1. Sea Ice Areas: Means, Standard Deviations and Seasonal Ranges Table 1 summarizes sea ice areas, Arctic, Antarctic and Polar, by their means (with uncertainty), standard deviations and seasonal ranges from the daily sea ice area estimates from SMMR-SSM/I from 29 Dec. 1978 through 29 Dec. 2007 and from AMSR-E from 31 Dec. 2002 through 31 Dec. 2008. Comparison shows that the mean Arctic sea ice area decreasing by about 3%, the mean Antarctic sea ice area increasing by about 16%, and the mean Polar sea ice area is increasing by about 7%. The seasonal range of Arctic sea ice area lowered its minimum by about one million square kilometers and its maximum remained unchanged, on average. The sea- sonal range of the Antarctic sea ice area, in contrast, raised its maximum by about two million square kilo- meters and its minimum remained unchanged, on aver- age. The seasonal range of the polar sea ice area raised- both its minimum and maximum by about one million square kilometers, on average. The standard deviations of the areas show changes of 1% (Arctic), 14% (Antarc- tic) and 30% (Global), on average, in the comparative time periods. 2.2. Sea Ice Area Secular Trends and Variations The daily sea ice area time series were processed by ordinary least-squares regression to derive secular and quadratic trends. The daily time series were then de- trended and processed by the Discrete Fast Fourier Transform (DFFT) to derive the power spectral density. The DFFT was applied on samples of 4096 in three sub-ranges spanning the full-ranges of each SMMR- SM/I time series, as well as the full-range (10593 sam- ples) with zero-padding to 16384 samples (214). Fre- quency components were the same in all the 4096 sub- ranges, and over the full-range with zero-padding to a 2n multiple. The AMSR-E time series (2192 samples) were zero-padded to 4096 samples. Figures 3, 4 and 5 illus- trate the trends (secular and quadratic) of the daily sea ice area time series and the power spectral density (from detrended time series) for the Arctic, Antarctic and Polar, respectively. Table 2 summarizes the secular trends with uncertainties. Daily Arctic sea ice area has secular decreases of 17 998 ± 3 587 km2/yr (SMMR-SSM/I) from late-1978 through 2007 and 317 277 ± 37 212 km2/yr (AMSR-E) from late-2002 through 2008 (Figure 3). Daily Antarctic sea ice area has secular increases of 24 311 ± 5359 km2/yr (SMMR-SSM/I) from late-1978 through 2007 and 371 680 ± 65 789 km2/yr (AMSR-E) from late-2002 through 2008 (Figure 4). Daily Polar sea ice area has secular increases of 6 133 ± 2 332 km2/yr (SMMR-SSM/I) from late-1978 through 2007 and 54 404 ± 33 391 km2/yr (AMSR-E) from late-2002 through 2008 (Figure 5). The rate of secular-decrease of the daily Arctic sea ice area has increased by a factor of about 18, from late-2002 through 2008 relative to late-1978 through 2007 (Table 2). Table 1. Arctic, antarctic and global sea ice area statistics, 1978 through 2008. SMMR-SSM/I (29 Dec. 1978 through 29 Dec. 2007) Area (km2) Arctic Antarctic Polar Mean 9 431 838 ± 30 069 8 759 378 ± 44 911 18 191 215 ± 19 475 S.D. 3 094 748 4 622 378 2 004 386 Range ~4 to 14 (106) ~2 to 16 (106) ~13 to 23 (106) AMSR-E (31 Dec. 2002 through 31 Dec. 2008) Area (km2) Arctic Antarctic Polar Mean 9 189 721 ± 65 515 10 458 208 ± 114 793 19 647 928 ± 57 870 S.D. 3 067 316 5 374 473 2 709 399 Range ~3 to 14 (106) ~2 to 18 (106) ~14 to 24 (106) 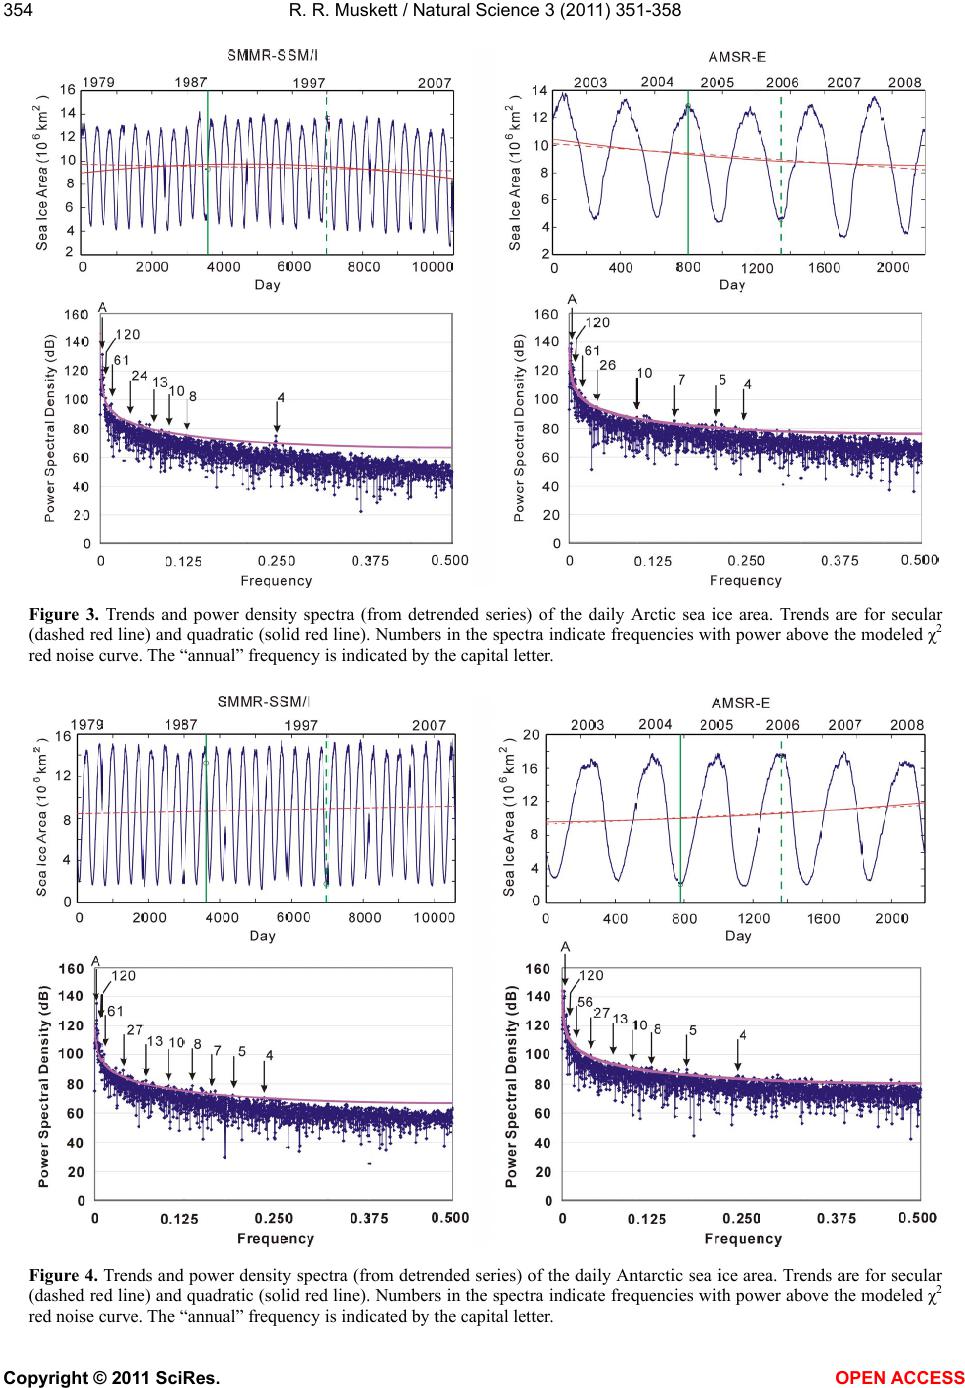 R. R. Muskett / Natural Science 3 (2011) 351-358 Copyright © 2011 SciRes. OPEN ACCESS 354 Figure 3. Trends and power density spectra (from detrended series) of the daily Arctic sea ice area. Trends are for secular (dashed red line) and quadratic (solid red line). Numbers in the spectra indicate frequencies with power above the modeled χ2 red noise curve. The “annual” frequency is indicated by the capital letter. Figure 4. Trends and power density spectra (from detrended series) of the daily Antarctic sea ice area. Trends are for secular (dashed red line) and quadratic (solid red line). Numbers in the spectra indicate frequencies with power above the modeled χ2 red noise curve. The “annual” frequency is indicated by the capital letter.  R. R. Muskett / Natural Science 3 (2011) 351-358 Copyright © 2011 SciRes. OPEN ACCESS 355 Figure 5. Trends and power density spectra (from detrended series) of the daily Polar (sum of the northern and southern he- mispheres) sea ice area. Trends are for secular (dashed red line) and quadratic (solid red line). Numbers in the spectra indicate frequencies with power above the modeled χ2 red noise curve. The “annual” frequency is indicated by the capital letter. Table 2. Secular trends of Arctic, Antarctic and Polar sea ice area. SMMR-SSM/I (29 Dec. 1978 through 29 Dec. 2007) Rates (km2/yr) Arctic Antarctic Polar −17 998 ± 3 587 +24 311 ± 5 359 +6 133 ± 2 332 AMSR-E (31 Dec. 2002 through 31 Dec. 2008) Arctic Antarctic Polar −317 277 ± 37 212 +371 680 ± 65 789 +54 404 ± 33 391 By comparison (Table 2), the rate of secular-increase in the daily Antarctic sea ice area has increased by a factor of about 16, comparing the same periods. However in the same comparative periods, the rate of secular-in- crease in the daily Polar sea ice area has increased by a factor of about 9 (Table 2). Power spectral density of the detrended series indi- cated significant, above the modeled χ2 99% confidence level, frequency components. The detrended SMMR- SM/I daily Arctic sea ice area series has significant power located at 4, 11, 16, 24, 61, and 120-day frequen- cies. The detrended SMMR-SMM/I daily Antarctic sea ice area series has significant power located at 4, 5, 10, 16, 27, 51, 61, and 120-day frequencies. The detrended AMSR-E daily Arctic sea ice area series has significant power located at 4, 5, 10, 26, 46, 61, and 120-day fre- quencies. The detrended AMSR-E Antarctic sea ice area series has significant power located at 4, 5, 10, 13, 16, 56, 72, and 120-day frequencies. The detrended SMMR- SSM/I and AMSR-E daily Polar sea ice area series con- tained significant power at the same frequencies as the Arctic and Antarctic sea ice area series. In all the de- trended daily time series, SMMR-SSM/I and AMSR-E, the annual cycle for the Arctic, Antarctic and Polar areas was 372.4 days, on average (Figures 3, 4 and 5). 3. DISCUSSIONS Power spectra (Figures 3, 4 and 5) of the detrended daily sea ice area time series show significant power at 4, 5, 10, 13, 16, 27, 51, 61 and 120-day frequencies in the Arctic, Antarctic and Polar sea ice areas. These short- term variations in sea ice area are consistent with the same variations of solar irradiance (total and ultraviolet), Rossby waves in the atmosphere and ocean, length-of- day and polar motion [24-36]. The annual cycle of the SMMR-SSM/I and AMSR-E daily sea ice area time series has a period of 372.4-days, on average. Close inspection of time series by day-count of sea ice area maximum-to-maximum and minimum-to- minimum show that the annual cycle varied from 305-  R. R. Muskett / Natural Science 3 (2011) 351-358 Copyright © 2011 SciRes. OPEN ACCESS 356 days (minima) in 1995-96 to 394-days (maxima) in 1989-90, SMMR-SSM/I Arctic sea ice area time series and 333-days (minima) in 2005-06 to 389-days (minima) in 2006-07, AMSR-E Arctic sea ice time series. The An- tarctic and Polar sea ice time series show similar varia- tions in the annual cycle day-count ranges spanning mi- nima-to-minima and maxima-to-maxima. This indicates a frequency modulation on the timing of minima and maxima from year to year of the sea ice area, with a re- currence period of 61.7 years; i.e. a sinusoidal forcing with a period on the order of 60 years. The 60-year modulation of the annual cycle of both hemispheres sea ice areas is consistent with the 60-year modulation of global air temperature and circulation by the coupled solar irradiance – length-of-day variations [37,38]. The physical basis for coupling this modulation to Polar sea ice area variations would be through conservation of atmospheric-ocean angular momentum [39,40]. This is a natural consequence given that sea ice acts as a bound- ary layer between the atmospheric and ocean momentum fields [4,41,42]. The long-term quadratic trend in the daily SMMR- SSM/I Arctic and Polar sea ice area time series and the short-term quadratic trends in the daily AMSR-E Arctic, Antarctic and Polar sea ice area time series suggest pe- riodic forcing acting on the growth and decay of sea ice area. The long-term quadratic trend suggests a forcing on the Arctic sea ice area with a period of 60-years, con- sistent with solar irradiation – length-of-day modulation of surface temperatures and atmospheric-ocean circula- tion. The short-term quadratic trends may themselves be linked to Rossby waves to conserve angular momen- tum in the coupled atmosphere-sea ice-ocean system of the northern and southern hemispheres. Secular trends show apparent increases in the rates of Arctic sea ice area decrease, Antarctic sea ice area in- crease, and Polar sea ice area increase from 2002 through 2008 relative to those from 1978 through 2007 (Table 2). The detrended daily AMSR-E Arctic and Antarctic sea ice area showed steady changes in the magnitudes of the seasonal minima and maxima from late-2002 through 2008 (Figure 6). The Arctic seasonal maxima showed steady increase while the seasonal minima showed de- creases. Interestingly the Antarctic seasonal maxima showed decreases and its seasonal minima showed some decreases (Figure 6, bottom). These findings suggest processes operating to moderate the long- term secular trends (Table 2). If these processes continue as linked to the 60-year solar – atmosphere – length-of- day modula- tion, then the secular trends of decreasing Arctic seas ice area and increasing Antarctic sea ice area could be re- versed within as little as 15 to 30-years, a quarter to one-half period. Figure 6. Detrended daily time series of Arctic (top) and Ant- arctic (bottom) sea ice area. Arrows indicate changes in the seasonal minima and maxima. Green lines are for visual refer- ence of contrasting minima to maxima. 4. CONCLUSIONS The satellite instrument retrievals of daily northern and southern hemisphere sea ice areas were investigated for secular trends and periodic variations. The daily re- trievals derived from the SMMR-SSM/I NASA Team algorithm from 1979 through 2007 and the AMSR-E Institute of Oceanography – University of Hamburg al- gorithm from 2003 through 2008. Secular trends show a decrease in Arctic sea ice area and an increase Antarctic sea ice area over their respective time periods. Since 2003 the AMSR-E secular trends indicated accelerations of decreasing Arctic sea ice area, by a factor 18, and increasing Antarctic sea ice area, by a factor of 16 rela- tive the SMMR-SSM/I secular trends, respectively. The Polar sea ice area, the daily sum of the northern and southern sea ice regions, showed an acceleration of in- creasing sea ice area, due to the increase in Antarctic sea ice area, since 2003 (AMSR-E) as well. Spectral analysis of the daily sea ice areas showed the annual cycle to be 372.14 days, on average, for the SMMR-SSM/I and AMSR-E time series. The annual cycle varied from 305 days to 394 days. The recurrence interval of the annual cycle is about 61.7 years, on aver- age. Significant spectral power occurred at from 4-day through 120-day frequencies, which were consistent with  R. R. Muskett / Natural Science 3 (2011) 351-358 Copyright © 2011 SciRes. OPEN ACCESS 357 those of solar irradiation, Rossby waves, length-of- day and polar motion. These results suggest a linkage of the daily sea ice area variations in the northern and southern hemispheres with the 60-year solar – atmosphere – length-of-day modulation. We hypothesize the spectral content of the daily Polar sea ice variations is a conse- quence of conservation of angular momentum, solar ir- radiation and ocean heat content variations. The detrended daily AMSR-E Arctic sea ice area shows the Arctic seasonal maxima to be increasing, while the seasonal minima decreasing. The detrended daily AMSR-E Antarctic seasonal maxima show the seasonal minima decreasing, and the seasonal maxima decreasing. These findings suggest processes operating to moderate the long-term secular trends. If these pro- cesses continue as linked to the 60-year solar – atmos- phere – length-of-day modulation, then the long- and short-term secular trends, decreasing Arctic seas ice area and increasing Antarctic sea ice area, are reversible within a range of 15 to 30-years. 5. ACKNOWLEDGEMENTS We thank the Arctic Region Supercomputing Center, University of Alaska Fairbanks for computing facilities support and the Japan Aero- space Exploration Agency for computing facilities support at the In- ternational Arctic Research Center. The National Snow and Ice Data Center, University of Colorado, The Polar Research Group, University of Illinois, Urbana-Champlain, USA, and the Institute of Oceanogra- phy, University of Hamburg, Germany are thanked. Prof. Syun-Ichi Akasofu is thanked for encouraging this work. This work was per- formed by R.R. Muskett at the International Arctic Research Center, University of Alaska Fairbanks, Alaska, USA. REFERENCES [1] Aagaard, K. and Carmack, E.C. (1989) The role of sea ice and other fresh water in the Arctic circulation. Jour- nal of Geophysical Research, 94, 14485-14498. doi:10.1029/JC094iC10p14485 [2] Washington, W.M. (1992) Climate-model responses to increased CO2 and other greenhouse gases. In: Trenberth, K.E. Ed., Climate System Modeling, Cambridge Univer- sity Press, Cambridge, 643-666. [3] Curry, J.A. and Schramm, J.L. (1995) Sea ice-climate feedback mechanism. Journal of Climate, 8, 240-247. doi:10.1175/1520-0442(1995)008<0240:SIACFM>2.0.C O;2 [4] Lemke, P., Harder, M. and Helmer, M. (2000) The re- sponse of Arctic sea ice to global change. Climatic Change, 46, 277-287. doi:10.1023/A:1005695109752 [5] Gorodetskaya, I.V., Cane, M.A., Tremblay, L.-B. and Kaplan, A. (2006) The effects of sea-ice and land-snow concentrations on planetary albedo from the earth radia- tion budget experiment. Atmosphere-Ocean, 44, 195-205. doi:10.3137/ao.440206 [6] Cavalieri, D.C., Gloersen, P., Parkinson, C.L., Comiso, J.C. and Zwally, H.J. (1997) Observed hemispheric asym- metry in global sea ice changes. Sci enc e, 278, 1104-1106. doi:10.1126/science.278.5340.1104 [7] Cavalieri, D.J., Parkinson, C.L., Gloersen, P., Comiso, J.C. and Zwally, H.J. (1999) Deriving long-term time se- ries of sea ice cover from satellite passive-microwave multisensor data sets. Journal of Geophysical Research, 104, 15803-15814. doi:10.1029/1999JC900081 [8] Zwally, H.J., Comiso, J.C., Parkinson, C.L., Cavalieri, D.J. and Gloersen, P. (2002) Variability of Antarctic sea ice 1979-1998. Journal of Geophysical Research, 107, 1-9. doi:10.1029/2000JC000733 [9] Cavalieri, D.J., Parkinson, C.L. and Vinnikov, K.Y. (2003) 30-year satellite record reveals contrasting Arctic and Antarctic decadal sea ice variability. Geophysical Re- search Letters, 30, 1-4. doi:10.1029/2003GL018031 [10] Cavalieri, D.J. and Parkinson, C.L. (2008) Antarctic sea ice variability and trends, 1979-2006. Journal of Geo- physical Research, 113, Article ID C07004, 1-19. [11] Spreen, G., Kaleschke, L. and Heygster, G. (2008) Sea ice remote sensing using AMSR-E 89-GHz channels. Jour- nal of Geophysical Research, 113 , Article ID C02S03, 1-14. [12] Zwally, H.J., Comiso, J.C., Parkinson, C.L., Campbell, W.J., Carsey, F.D. and Gloersen, P. (1983) Variability of Antarctic sea ice and changes in carbon dioxide. Science, 220, 1005-1012. doi:10.1126/science.220.4601.1005 [13] Comiso, J.C., Parkinson, C.L., Gersten, R. and Stock, L. (2008) Accelerated decline in the Arctic sea ice cover. Geophysical Research Letters, 35, Article ID L01703, 1-6. [14] Overland, J., Turner, J., Francis, J., Gillett, N., Marshall, G. and Tjernstrom M. (2008) The Arctic and Antarctic: Two faces of climate change. Eos Transactions American Geophysical Union, 89, 177-179. doi:10.1029/2008EO190001 [15] Sullivan, R., Timmermann, A. and White, H. (2001) Dangers of data mining: The case of calendar effects in stock returns. Journal of Econometrics, 105, 249-286. doi:10.1016/S0304-4076(01)00077-X [16] Cerveny, R.S., Svoma, B.M., Balling, R.C. Jr. and Vose, R.S. (2008) Gregorian calendar bias in monthly tem- perature databases. Geophysical Research Letters, 35, Article ID L19706, 1-4. [17] Press, W.H., Teukolsky, S.A., Vetterling, W.T. and Flan- nery, B.P. (2007) Numerical recipes: The art of scientific computing. 3rd Edition, Cambridge University Press, Cambridge. [18] Kukla, G. and Gavin, J. (1981) Summer sea ice and car- bon dioxide. Science, 214, 497-503. doi:10.1126/science.214.4520.497 [19] Amemiya, T. and Wu, R.Y. (1972) The effect of aggrega- tion on prediction in the autoregressive model. Journal of the American Statistical Association, 67, 628-632. doi:10.2307/2284454 [20] Wei, W.W.S. (1979) Some consequences of temporal aggregation in seasonal time series models. In: Zellner, A. Ed., Seasonal Analysis of Economic Time Series, Na- tional Bureau of Economic Research, Cambridge, 433-448. [21] Box, G.E.P. and Jenkins, G.M. (1975) Time series analy- sis: Forecasting and control. Revised Edition, Holden-  R. R. Muskett / Natural Science 3 (2011) 351-358 Copyright © 2011 SciRes. OPEN ACCESS 358 Day, San Francisco. [22] Jenkins, G.M. and Watts, D.G. (1969) Spectral analysis and its applications. Emerson-Adams Press, Inc., Boca Raton. [23] Bevington, B.R. and Robinson, D.K. (1992) Data reduc- tion and error analysis for the physical sciences. 2nd Edi- tion, McGraw-Hill, Inc., New York. [24] Ahlquist, J.E. (1982) Normal-mode global Rossby waves: Theory and observations. Journal of the Atmospheric Sciences, 39, 193-202. doi:10.1175/1520-0469(1982)039<0193:NMGRWT>2.0. CO;2 [25] Ahlquist, J.E. (1985) Climatology of normal-mode Rossby waves. Journal of the Atmospheric Sciences, 42, 2059-2068. doi:10.1175/1520-0469(1985)042<2059:CONMRW>2.0. CO;2 [26] Duvall, T.L. Jr., Jones, H.P. and Harvey, J.W. (1983) Solar oscillations with 13-day period. Nature, 304, 517- 518. doi:10.1038/304517a0 [27] Pap, J., Tobiska, W.K. and Bouwer, S.D. (1990) Peri- odicities of solar irradiance and solar activities, I. Solar Physics, 129, 165-189. doi:10.1007/BF00154372 [28] Djurovic, D. and Pâquet, P. (1991) Variations common to the interplanetary magnetic field, the zonal atmospheric circulation and the earth’s rotation. Quarterly Journal of the Royal Meteorological Society, 117, 571-586. doi:10.1002/qj.49711749908 [29] Bouwer, S.D. (1992) Periodicities of solar irradiance and solar activity indices, II. Solar Physics, 142, 365-389. doi:10.1007/BF00151460 [30] Zhou, S., Rottman, J. and Miller, A.J. (1997) Strato- spheric ozone response to short-and intermediate-term variations of solar UV flux. Journal of Geophysical Re- search, 102, 9003-9011. doi:10.1029/96JD03383 [31] Nikonova, M.V., Klochek, N.V. and Palamarchuk, L.E. (1998) Quasi-10-day and 4-day periodicities in solar ir- radiance. In: F.L. Deubner, et al. Eds., New Eyes to See Inside the Sun and Stars, International Astronomical Un- ion, Kyoto, 119-120. [32] Renwick, J.A. and Revell, M.J. (1999) Blocking over the South Pacific and Rossby wave propagation. Monthly Weather Review, 127, 2233-2247. doi:10.1175/1520-0493(1999)127<2233:BOTSPA>2.0.C O;2 [33] Baldwin, M.P. and Dunkerton, T.J. (2001) Stratospheric harbingers of anomalous weather regimes. Science, 294, 581-584. doi:10.1126/science.1063315 [34] Cravatte, S., Boulanger, J.-P. and Picaut J. (2004) Reflec- tion of intraseasonal equatorial Rossby waves at the western boundary of the Pacific Ocean. Geophysical Re- search Letters, 31, Article ID L10301, 1-4. [35] Haldoupis, C., Pancheva, D. and Mitchell, N.J. (2004) A study of tidal and planetary wave periodicities present in midlatitude sporadic E layers. Journal of Geophysical Research, 109, Article ID A02302, 1-12. [36] Geller, M.A. (2006) Discussion of the solar uv/planetary wave mechanism. Space Science Reviews, 125, 237-246. doi:10.1007/s11214-006-9060-7 [37] Soon, W.W.-H. (2005) Variable solar irradiance as a plausible agent for multidecadal variations in the Arc- tic-wide surface air temperature record of the past 130 years. Geophysical Research Letters, 32, Article ID L16712, 1-5. [38] Mazzarella, A. (2007) The 60-year solar modulation of global air temperature: The Earth’s rotation and atmos- pheric circulation connection. Theoretical and Applied Climatology, 88, 193-199. doi:10.1007/s00704-005-0219-z [39] Barnes, R.T.H., Hide, R., White, A.A. and Wilson, C.A. (1983) Atmospheric angular momentum fluctuations, length-of-day changes and polar motion. Proceedings of the Royal Society A, 387, 31-73. doi:10.1098/rspa.1983.0050 [40] Ponte, R.M. (2002) Rapid ocean signals in polar motion and length of day. Geophysical Research Letters, 29, Ar- ticle ID 151711, 1-4. [41] Hibler, W.D. and Flato, G.M. (1992) Sea ice models. In: Trenberth K.E. Ed., Climate System Modeling, Cam- bridge University Press, Cambridge, 413-435. [42] Cavalieri, D.J. and Häkkinen, S. (2001) Arctic climate and atmospheric planetary waves. Geophysical Research Letters, 28, 791-794. doi:10.1029/2000GL011855
|