 Journal of Power and Energy Engineering, 2014, 2, 352-359 Published Online April 2014 in SciRes. http://www.scirp.org/journal/jpee http://dx.doi.org/10.4236/jpee.2014.24047 How to cite this paper: Cultura, A.B. and Albina, D.O. (2014) Smart Electric Grid Demonstration and Training Facilities in Mindanao, Philippines. Journal of Power and Energy Engineering, 2, 352-359. http://dx.doi.org/10.4236/jpee. 2014.24047 Smart Electric Grid Demonstration and Training Facilities in Mindanao, Philippines Ambrosio B. Cultura, Dionel O. Albina Department of Electrical Engineering Mindanao University of Science and Technology, Cagayan de Oro City, Philippines Email: acultura2003@yahoo.com, doalbina@yahoo.com Received February 2014 Abstract The paper presents the establishment of a Smart Electric Grid Demonstration and Training Facili- ties in Mindanao in order to help electric utilities and industries keep up with the emerging tech- nologies in our current trends in power system. This will serve as a training center in smart grid technology for power industries, academe and other stakeholders in the power sector. This will provide opportunities to conduct research on how intelligently managing our electricity as one of the challenges in the power industry. In addition, this facility is not only a showcase of the aca- deme-industry collaboration but is also necessary to move research towards demonstrating the application of smart technologies in the electric power industry and illustrating on how to manage the use of electric energy efficiently. Keywords Smart Electric Grid; Emerging Technology; Academe-Industry Collaboration 1. Introduction Most of the electric utility infrastructure deployed in Mindanao, Philippines was built between 1960 and 1990, and was designed to provide customers with as much energy as they could consume, generated from a centra- lized Hydro power and fossil fuel plant. However, much of the infrastructure is antiquated, and with the contin- uing increase in demand for power in the Philippines, the grid cannot safely and reliably manage the loads of today and tomorrow without significant upgrades. Furthermore, climate change standards and renewable energy mandates are among the key drivers that are forcing utilities to upgrade their infrastructure to incorporate new generation sources that do not negatively impact the environment [1]. In order to accommodate these renewable sources of energy, which usually produce power on an intermittent basis, utilities are needed to install more ac- curate measurement, monitoring, control and analysis equipment to ensure these energy sources can be properly and reliably integrated into the grid [2]. These intelligent technological, management and communication en- hancements are usually described as the smart grid. With these challenges and new trend in electric power sys- tem, there is a need to update our electric industries in this new technology. In response to this challenge, the Mindanao University of Science and Technology, through its Electrical En- gineering department has initiated the establishment of a smart grid technology trainer which will serve not only  A. B. Cultura, D. O. Albina as training center for electric utilities personnel but also provide opportunities to conduct research and experi- ment on smart grid technology; its application, design, modeling, simulation, assessment and operation. In addi- tion, this trainer is not only a showcase of the academe and industry but is also necessary to move research to- wards demonstrating the viability and application of these technologies. The facility can provide not only in-depth investigation of particular aspects of energy technologies, but also assessment of entire energy systems and evaluation of power system performance. Moreover, the facility may provide opportunity for interaction and collaboration between industry and academe in providing knowledge in smart grid and in updating current trends in electric power industry. 2. The Smart Grid Technology The Electric industry is struggling to keep up with a changing and modernization of electrical power system. This industry is poised to make the transformation from a centralized, producer-controlled network to one that is less centralized and more consumer-interactive. With the introduction of new and renewable energy, the electric power industry needs to prepare themselves especially in the integration of these new sources to existing power system. In fact, smart meters and switches are developed in support to upgrade the electric power system. The control and information technology needed to support these new possibilities are already in a stage of evolution, so there is a need to provide more efficient and cost-effective electrical services now and in the future. In gener- al the concept of the Smart electric grid, the subject of this paper, consists of introducing the new technologies in the infrastructure of the electric grid especially to electric cooperative and utilities. The move to a smarter grid promises to change the industry’s entire business model and its relationship with all stakeholders, involving and affecting utilities, regulators, energy service providers, technology and automation vendors and all consumers of electric power [1,2,3]. Smart Grids are electricity grids which integrate automation and make optimal use of new technologies. They coordinate and facilitate the integration of renewable energy and the corresponding two-way electricity (from producers to consumers and vice versa). Moreover, many data are exchanged in a Smart Grid and remote man- agement is possible. In that way this can save energy, reduce costs and increase reliability and transparency. Smart grids are an extension or modification of the existing electric network and consist of various information and metering systems with smart meters. Smart grids promote the way to reduce energy dependency, to tackle the global warming, and to improve the performance of the electricity grid. Smart grid, as illustrated in Figure 1 [4], is described as an upgrade for the old power grid. The smart grid is a flexible switchable system of bridges linking people with technology and natural systems. The function of an electrical grid is not a single task performed by one utility, but it consists of many different tasks and it is per- formed using multiple networks and by multiple power generation companies with multiple operators employing at varying levels of communication and coordination, most of which are manually controlled. But smart grids will increase the connectivity, automation and coordination between these suppliers, consumers and networks that perform either long distance transmission or local distribution tasks [5-7]. 3. Design of Smart Grid Trainer The block diagram shown in Figure 2 is the design of modular system for the study of the smart grid system use as a trainer. “Flexible and modular trainer for the study and the understanding of the concepts related to a better management of electricity. This concept, called “Smart Grid”, relates to an information network that can support the electricity distribution network in order to manage it in an “intelligent” way, and so avoiding energy waste, overloads and voltage drops. In a Smart Grid system, energy surplus that are produced in some areas dynami- cally redistributed. This trainer simulates energy generation from both traditional and renewable energy sources” [5,6]. 4. System Components of a Smart Grid Trainer The smart grid is a system for an “intelligent distribution” of electricity, able to know the consumption of the various end users and to manage the generation and distribution of electricity according to demand. The smart grid knows the requirement of power consumption. When the demand of electricity is at its maximum, smart grid automatically adapts to the demand by picking up excess energy from many sources to avoid overload 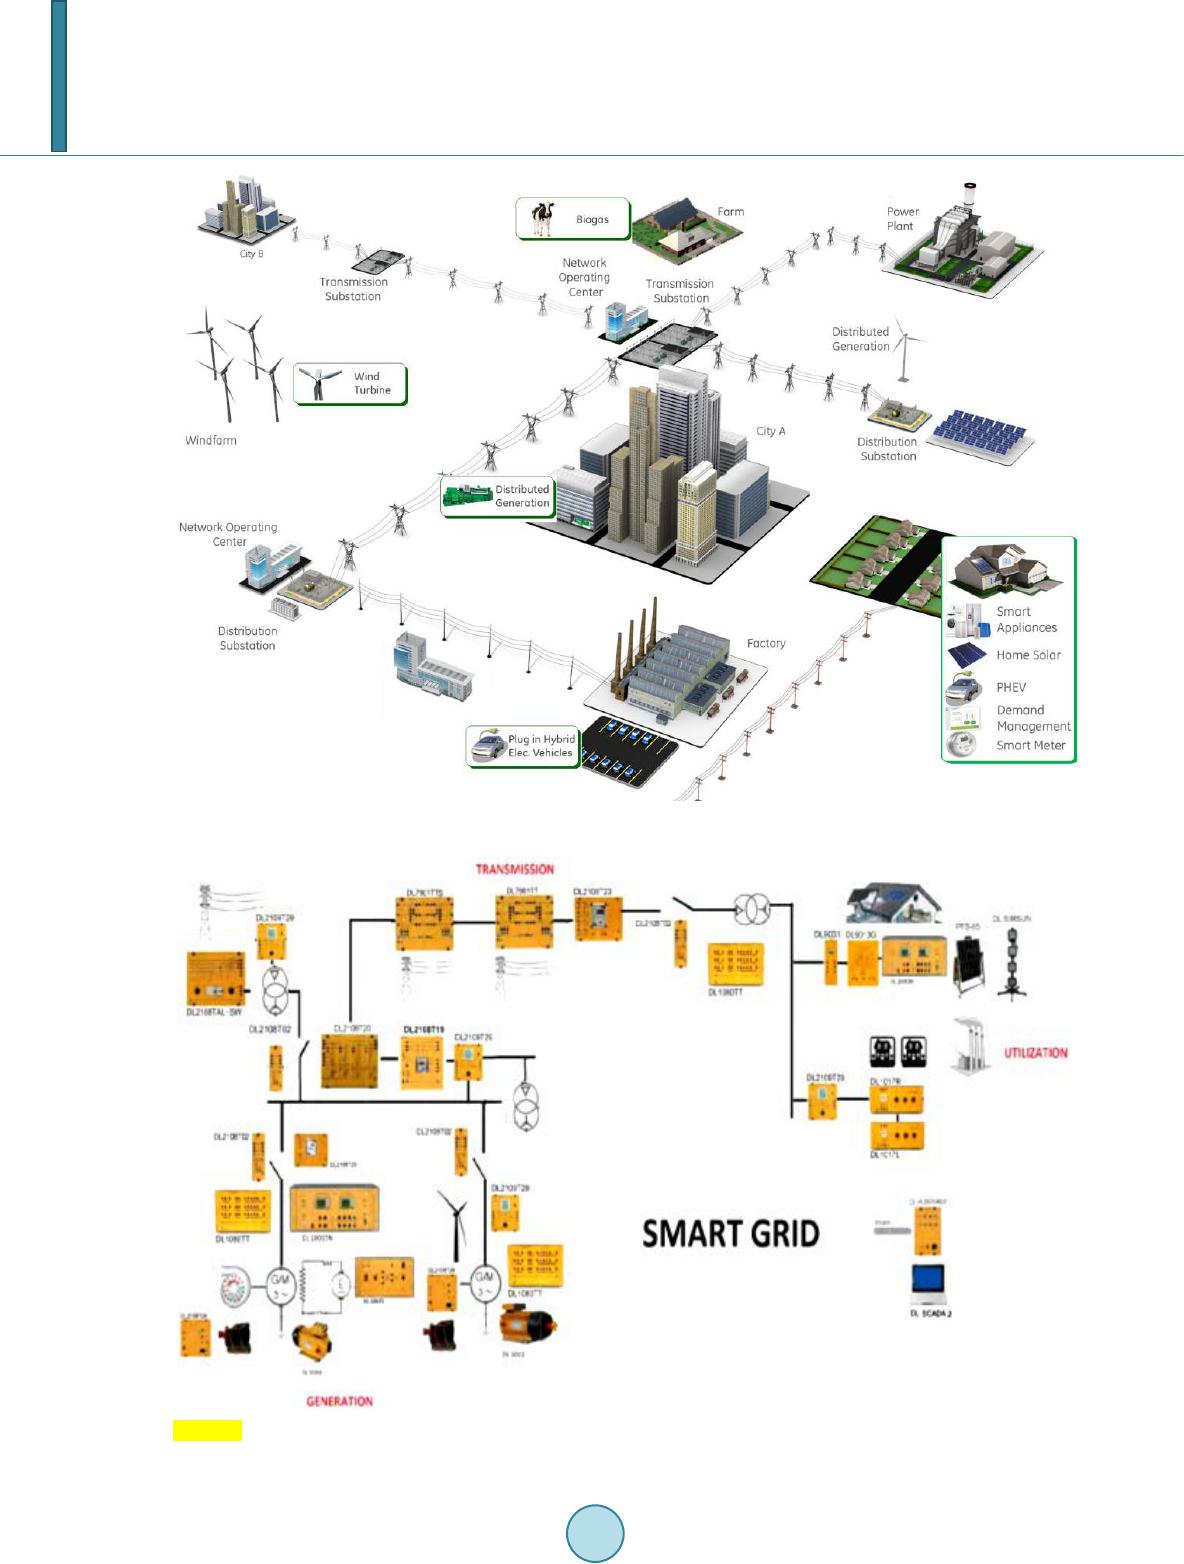 A. B. Cultura, D. O. Albina Figure 1. Illustration of a smart grid system. Figure 2. Block diagram of modular system for the study of the smart grid system.  A. B. Cultura, D. O. Albina problems or power interruptions [69]. It has therefore the function of sharing the electricity that is generated from various sources, both public and private, traditional and renewable, and ensuing that electrical devices use electricity as efficiently as possible. The laboratory simulates the generation of energy from different sources such as a traditional energy source (carbon, gas, etc.), a hydroelectric source, a wind source, and a solar source. Figure 3 is the smart grid trainer with each component description [9,10]. Transmission Line Model-Medium • Three-phase model of an overhead power transmission line of length 100 km, voltage 380 kV and current line 1000 A. • Switchable Capacitor Battery. • The unit is a switching system with which different capacitance values can be connected to the mains for re- active power compensation: 4 switching levels can be connected and disconnected using power contactors. • The switching levels each consist of 3 capacitors in star connection with discharging resistors: Level 1 (b1 coil ): 3 × 2 F/450 V Level 2 (b2 coil): 3 × 4 F/450 V Level 1 (b3 coil): 3 × 8 F/450 V Level 1 (b4 coil): 3 × 16 F/450 V Programmable Automatic Power Supply Unit • The power supply unit is suitable for regulating the excitation voltage of electric machines and brakes. It is essentially composed of a motor-driven variator, a control board and a single-phase bridge. • It can be either internally controlled in manual mode or externally controlled in automatic mode through the data acquisition system and the relevant software. • Module for Measuring the Electric Power. • The module for measuring the electric power is designed to satisfy the requirements of our 300 W (Eurolab), 1 kW (Unilab) and 3.5 kW (Uniplan) electric machine laboratories. • If necessary it may be used for other electrical machines not of our production provided that they are in- cluded in the power specified by the instrument characteristics. • In case of need the module may be connected to our data acquiring system, by means of the RS485 connec- tors. • Before connecting the module to the supply and to the line under analysis, verify that the voltage, the current and the frequency compatibility. Use of AC Section in Three-phase • This can be used to execute measure on Single-phase network (1 phase and neutral) • Three-phase network 3-wire (3 phase without neutral) and on Three-phase network 4-wire (3 phase and neu- tral). • This can perform measures on the tree configuration without any changes. • Transmission Line Model. Figure 3. The smart grid trainer.  A. B. Cultura, D. O. Albina • Three-phase model of an overhead power transmission line of length 360 km, voltage 380 kV and current line 1000 A. Grid Tie Power Inverter • The main difference between a standard power inverter and a grid tie power inverter is that the latter also ensures that the power supplied will be in phase with the grid power. • This allows individuals with surplus power (wind, solar, etc.) to sell the power back to the utility in the form of net mete-ring or the arrangement that local power utility offers. • Resistive Load. • The resistive load is designed to complete the 1.1 kW electric machines laboratory. • The load is composed by three resistances, with possibility of star, delta and parallel connection, controlled by a three switches. • As a function of the switch positions, we’ll have the following phase values: • Max power in single or three phase connection is 1200 W. • Rated voltage in star connection is 380 V, in Δ connection is 220 V, in single-phase is 220 V. • Inductive Load. • The inductive load is designed to complete the 1.1 kW electric machines laboratory. • The load is composed by three inductances, with possibility of star, delta and parallel connection, controlled by a three switches. • As a function of the switch positions, we’ll have the following phase values (at 50 Hz): • Max reactive power 890 VAr in three-phase or single-phase connection. • Rated voltage in star connection is 380 V, in Δ connection is 220 V, in single-phase is 220 V. • Capacitive Load. • The capacitive load is designed to complete the 1.1 kW electric machines laboratory. • The load is composed by three capacitors, with possibility of star, delta and parallel connection, controlled by a three switches. • As a function of the switch positions, we’ll have the following phase values (at 50 Hz):  A. B. Cultura, D. O. Albina • Max reactive power in single-phase or three-phase connection 825 VAr. • Rated voltage in star connection is 380 V, in Δ connection is 220 V, in single-phase is 220 V. • Three-Phase Transformer • Three-phase transformer for feeding a transmission line model 380 kV with scale factor 1:1000 for secon- dary current and voltage. ○ Primary: 3 × 380 V winding with tap at 220 V. Star or delta connection. ○ Secondary: 3 × 220 V winding with tap at +5%, −5%, −10%, −15%. Star connection for 3 × 380 V line voltage supply. Various star point connections possible. Nominal power: 800 VA. ○ Tertiary: 3 × 220 V winding, Delta connection for stabilizing the third harmonic voltage components. Nominal power: 266 VA Reactive Power Controller • The power factor regulator is an automatic system, based on a micro controller able to detect the power fac- tor of the line, and by means of some relays and a bank of capacitors it makes the cosφ re-enter among the limits set. • Such device has been engineered to re-phase the inductive loads, since the national corporation for the en- ergy distribution imposes some limits in the reactive energy absorption field, which produces only an in- crease of the transported current. 5. Power Outages in Mindanao Over the past five years, the supply of power in the Mindanao grid was struggling to meet demands. And on a seasonal trend, it was observed that reoccurring power outages occurs when the summer season begins and the supply of water to the dominant hydropower facilities is less. As a result, the Mindanao grid has experienced massive shortfall of supply to meet consumers demand for electric energy, such were the scenario in the years 2010, 2012 and just recently in 2013. As a background, almost 50% of the about 1300 Megawatt of power de- mand in the island is supplied by hydropower plants, a source of power heavy dependent on the amount of water stored in the hydropower plants reservoir; the rest of the demand is supplied by coal, geothermal and other fos- sil-fuel bases sources and a small fraction of solar energy. From a power systems operation and management point of view, the power outages in the island may be les- sened by a number of possible ways, some of which are enumerated as follows: a) increase the supply of power in the island by building power plants; b) efficient management of the dominant hydropower plants in the island by optimal utilization of the water in the reservoir to supply some of the shortfall during the less-rainy season; c) interconnection of the island to the much bigger electric grid from Luzon and Visayas; and d) other measures which include among others energy-efficiency measures, demand-side management, purchase of stand-by diesel generator sets and the likes. From all these measures, what is important is a reliable approximation of what is the amount of shortfall and on what year, thus there is a great need to quantify the outages to manage it. 5.1. Quantify the Shortfall of Supply Using the smart grid demonstration and training facilities, the authors envisioned to assist the power systems utilities in the island to efficiently manage the power system both from the operational and control point of view. With the smart grid demonstration facility, the proponent will train prospective generation, transmission and distribution personnel the theoretical and the practical probabilities to manage the grid, prepare them for better power and energy forecast, run the necessary load flow and power flow on a circumstances-based approach. This procedure will assess the operators, the distributor and the consumer of electricity the amount of deficit to be expected in a given time. More importantly, to properly assess the supply and demand options to limit the impact of the shortage of supply. 5.2. Better Forecast Together with simulation and statistical software available in the power industry, the training facility will en-  A. B. Cultura, D. O. Albina hance the forecast capability of existing and prospective generation, transmission and distribution entities. The training facility shall make comprehensive training workshops available to each of the power systems partici- pants and make use of the capability of the smart electric grid and demonstration facility for better electric and energy forecast. Effective forecast of both energy and power is one of the basic fundamentals for a successful power systems management: in the generation, it is tool to provide when to add capacity, in transmission, to up- grade the transmission lines, and in the distribution it is a signal to upgrade and increase the distribution lines and to manage their purchase of energy and power. To sum up no better management of electric systems can be without a reliable and efficient forecast [3]. 5.3. Managing Peak Demands One aspect that the smart grid system and demonstration facility can offer is the assistance and capability it will bring to manage peaks looking at the distribution utility point of view. From a 8760-hour load curve analysis of the existing rural electric cooperatives operating in the island, approximately 50 to 100 Megawatt of power can eradicated from the peak through efficient and effective power management, this may include supply aggrega- tion among individually contracted rural electric cooperatives to create a single purchaser of electricity, and oth- er methods such as implementing energy efficient capital expenditure projects. As a background, the rural elec- tric cooperatives in the island combined, distributes approximate 600 - 800 MW of electric power to the electric consumers, each having a separate contract with their individual suppliers as to the their base energy, interme- diate and peak demands. Under a shortfall or shortage of supply scenario, not all of the contacted energy may be given to the distribution utility or the rural electric cooperatives, a prevalent condition that usually occur during the peak period, as such, the utility resort to secure additional energy contract usually from a more expensive source to meet their peak demands, which will usually result in the spike of average energy or electricity rate. The au- thors envisioned that the training and demonstration facility and incorporating power flow models can provide the necessary capability building trainings to properly manage the peak demands from a demand point of view. 5.4. Renewable and Alternative Energy Penetration Rate Evaluation Another aspect envisioned by the authors is that the smart grid training facility will assist the researcher in the institute to analyze and evaluate the scenario associated with the entry and use of renewable energy and alterna- tive energy sources other than big hydro and geothermal plants. The smart grid will definitely provide a sharp and accurate feedback should a renewable and alternative energy systems will be incorporated in the Mindanao electric grid. Crucial to such evaluation is the impact of the penetration rate of these types of supply. As of this time, the grid distributes less than 1% of the total demand from solar energy. The island has rich potential re- sources for wind, small hydro, wind and solar for large scale and commercial energy generation. With smart grid, researchers will surely get a better feedback to evaluate entry of these resources to the grid and the impact of their penetration rate to the technical and power quality of the grid and most importantly the changes in the economic patterns once the large scale renewable energy resources come in. 5.5. Better Management of Reactive Power and Voltage Stability Crucial to any power systems operation and control, is the management of reactive power and voltage stability to maintain reliability and integrity of the power supply. The proponents wish to use the trainer and demonstra- tion facility and combined with our power system simulator to take a look at the technical parameter to manage reactive power and maintain a stable voltage supply. Managing reactive power is one key to efficiently manage the power grid, too much reactive power loss results to an inefficient system as less energy is delivered to the consumer for the same amount of energy produced, thus, resulting to much higher cost of generation of electric- ity. Attaining voltage stability is also crucial to maintaining integrity and reliability of the power grid as instabil- ity of supply voltage may lead to voltage collapse and eventually power outages. 6. Impact of the Project The impact or benefits of the project far outweighs compared to that of the cost of the trainer, while it is almost impossible to quantify the impact based on cost-to-benefit comparison, the following discussion may illustrate some of the impact.  A. B. Cultura, D. O. Albina 6.1. Managing Peaks Over 60 MW of electric power may be managed through supply management either in the form of supply ag- gregation of distribution utility or through energy efficient projects. Using conservative estimate, even if 10 MW will be saved and supplied during the peak which conservative stands at 10% of the 8760 hour pear year of op- eration or a total of approximately 900 hours per year, a total of 9000 megawatt-hour will be delivered to con- sumers during peak without capacity addition and a rate of 4000 pesos per megawatt-hour a total of 36 million pesos will be save by the utilities per year for properly managing the peaks. 6.2. Efficient Forcasting Efficient forecasting of energy and power is an integral part for efficient management of the distribution utility, every contracting period private distribution company and rural electric cooperatives alike submits their con- tracts to individual suppliers to contract their base, intermediate and peak demands. In all of these undertakings, they submit their own forecast energy and power and which stands as the basis of their power and energy pur- chase agreement. In almost all of these contracts, there is a corresponding penalty clause where distribution utilities may incur penalties should they over or under-forecast their demand. As a background, every 1 megawatt of demand from any electric utility means approximately 5000 mega- watt-hour of energy that needs to be secured through a power purchase contract per year. A good forecast may usually be in the 3% above or below the said energy projection. While a bad forecast may even reach an over-forecast as high as 20% - 30% or a deficit of 20% to 30%. Thus 20% overshoot means approximately 1000 megawatt hour of energy for every 1 megawatt of demand. The overshoot or deficit is usually multiplied by the penalty, an amount agreed the contracting parties. While it is impractical to evaluate the penalty that may be in- curred by a given utility, a simple calculation of a 25 MW peak electric utility may incur a million pesos of pe- nalty for overshooting its forecast over 20%. Mindanao at present has approximately 1300 MW of demand or approximately 6,500,000 Megawatt-hour of energy that needs to be supplied per year. 7. Conclusion The problem of the power industry in the Philippines prompted the authors to establish the Smart Electric Grid Demonstration and Training Facilities that will provide electric utilities and industries in Mindanao keep up with the emerging technologies in our current trends in power system. The grid cannot safely and reliably manage the loads of today and tomorrow without significant upgrades, hence it is in this context that trainings on smart grid technology must be conducted for power industries, academe and other stakeholders knowledge in power must be upgraded. This facility provides them knowledge on smart grid especially on how intelligently manage our electricity as one of the challenges in the power industry. In addition, this facility is not only a showcase of the academe-industry collaboration but is also necessary to move research towards demonstrating the application of smart technologies in the electric power industry and illustrating on how to manage the use of electric energy ef- ficiently with the integration of renewable energy resources. References [1] Vijaya priya , T. and Kothari, D.P. (2011) Smart Grid: An Overview. Journal on Smart Grid and Renewable Energy, 2, 305-311. [2] Smart Grid: U.S. Department of Energy. http://energy.gov/oe/technology-development/smart-grid [3] Rahman, S. (2009) The Smart Grid and Its Impact on the Integration of Distributed Energy Resources. Southeast Uni- versity, Nanjing. [4] http://visioninnovation313.wordpress.com/platforms/ [5] http://news.cnet.com/8301-11128_3-20009962-54.html [6] http://www.smartgridnews.com [7] http://www.iea.org/publications/freepublications/publication/name,3972,en.html [8] http://tinycomb.com/2009/05/03/what-is-the-smart -grid/ [9] Hytec Power Inc. [10] http://energy.gov/oe/technology-development/smart-grid
|