Journal of Water Resource and Protection
Vol.4 No.6(2012), Article ID:19895,8 pages DOI:10.4236/jwarp.2012.46039
Geoelectric Sounding for the Determination of Aquifer Transmissivity in Parts of Bayelsa State, South South Nigeria
1Department of Geology & Physics, Niger Delta University, Wilberforce Island, Nigeria
2Department of Geography and Environmental Management, Niger Delta University, Wilberforce Island, Nigeria
Email: *okenlani@yahoo.com
Received March 12, 2012; revised April 6, 2012; accepted May 1, 2012
Keywords: Aquifer; Longitudinal Conductance; Transmissivity; Dar Zarrouk Parameters; Geoelectric Parameters; Yenagoa
ABSTRACT
The application of geophysical methods in combination with pumping tests provides a cost-effective and efficient alternative to estimate aquifer parameters. In this study, nineteen Schlumberger vertical electrical soundings (VES) were occupied in parts of Bayelsa State using a maximum current electrode separation ranging beweeen 300 - 400 m with the aim of estimating the transmissivity of the alluvial aquifer in areas where no pumping test has been carried out. Four of the soundings were carried out near existing boreholes in which pumping test had been carried out. The VES data obtained was interpreted, and layer parameters such as true resistivities and thickness were determined. The geoelectric parameters were used to generate the Dar Zarrouk parameters. Correlating the Dar Zarrouk parameter (e.g longitudinal unit conductance) with transmissivity derived from pumping test data, a constant was found which translate longitudinal unit conductance to transmissivity in a hydrogeological setting where effective porosity is the primary control on resistivity and hydraulic conductivity. Transmissivity determined from the pumping test data range between 1634.0 - 5292.0 m2/day while transmissivity values estimated from the longitudinal unit conductance (Lc) range between 721 - 8991 m2/day. The transmissivity estimated from the pumping test (Tp) data and transmissivity estimated from the longitudinal conductance (Lc) on comparison show excellent correlation (R2 = 0.92). The high transmissivity values agree with the geology of the Benin Formation (Coastal Plain sands) consisting of fine-medium-coarse sands. The results give a useful first approximation of the transmissivity and could be used to site exploratory boreholes.
1. Introduction
The evaluation of hydraulic properties of subsurface aquifers is an important task in groundwater resources assessment and development. This is because these properties are important in determining the natural flow of water through an aquifer and its response to fluid extraction [1]. Besides, they are useful parameters for groundwater protection and prediction of contaminant transport [2]. Several methods are available in Groundwater Hydrology for evaluation and estimation of these aquifer characteristics. The most commonly used methods involve conducting pumping test on existing or newly drilled wells followed by analysis and interpretation of the pumping test data. However, such tests are both capital and labour intensive requiring several boreholes, many operatives, and a considerable amount of equipment. Besides, the pumping test method yields results appropriate only to a small section of the aquifer.
An alternative approach for estimating aquifer characteristics is the use of surface geoelectrical methods. The surface geoelectrical method especially the Vertical Electrical Sounding (VES) method of geophysical investigation is a non-invasive, relatively cheap and quantitative evaluation technique used for locating sites/depths for groundwater exploitation. Besides, it is used as an effective tool for ascertaining the subsurface geological framework of an area [3-5], and thus being used routinely for aquifer zone delineation and evaluation of the geophysical character of the aquifer. Since a correlation between hydraulic and electrical properties is possible, as both properties are related to the pore space structure and heterogeneity [6-7], the integration of aquifer parameters calculated from boreholes and surface resistivity parameters extracted from surface resistivity measurements is an effective method in estimating aquifer properties. In this study, this approach has been utilized in order to estimate aquifer transmissivity in numerous locations providing effective and inexpensive characterization of the study area aquifer system.
2. Geology and Hydrogeology of the Study Area
The study area lies between latitudes 4˚48' and 5˚08' north and Longitudes 6˚06' and 6˚30' east, South South Nigeria (Figure 1). It is within the Tropical Equatorial climate. There are two major climatic seasons in the areathe wet season from April to October and the dry season from November to March. Average annual rainfall is about 3000 mm [8] and this serves as the major source of groundwater recharge. This ensures a large volume of water input into the environment. There are a number of perennial streams and rivers in the area of study. They all form a network which empties to the Atlantic Ocean. As a result, most of the terrain is marshy and in some cases form beaches. The topography is invariably gentle. Plant type is generally mangrove except in the mainland areas where large areas are covered with oil palm and large trees.
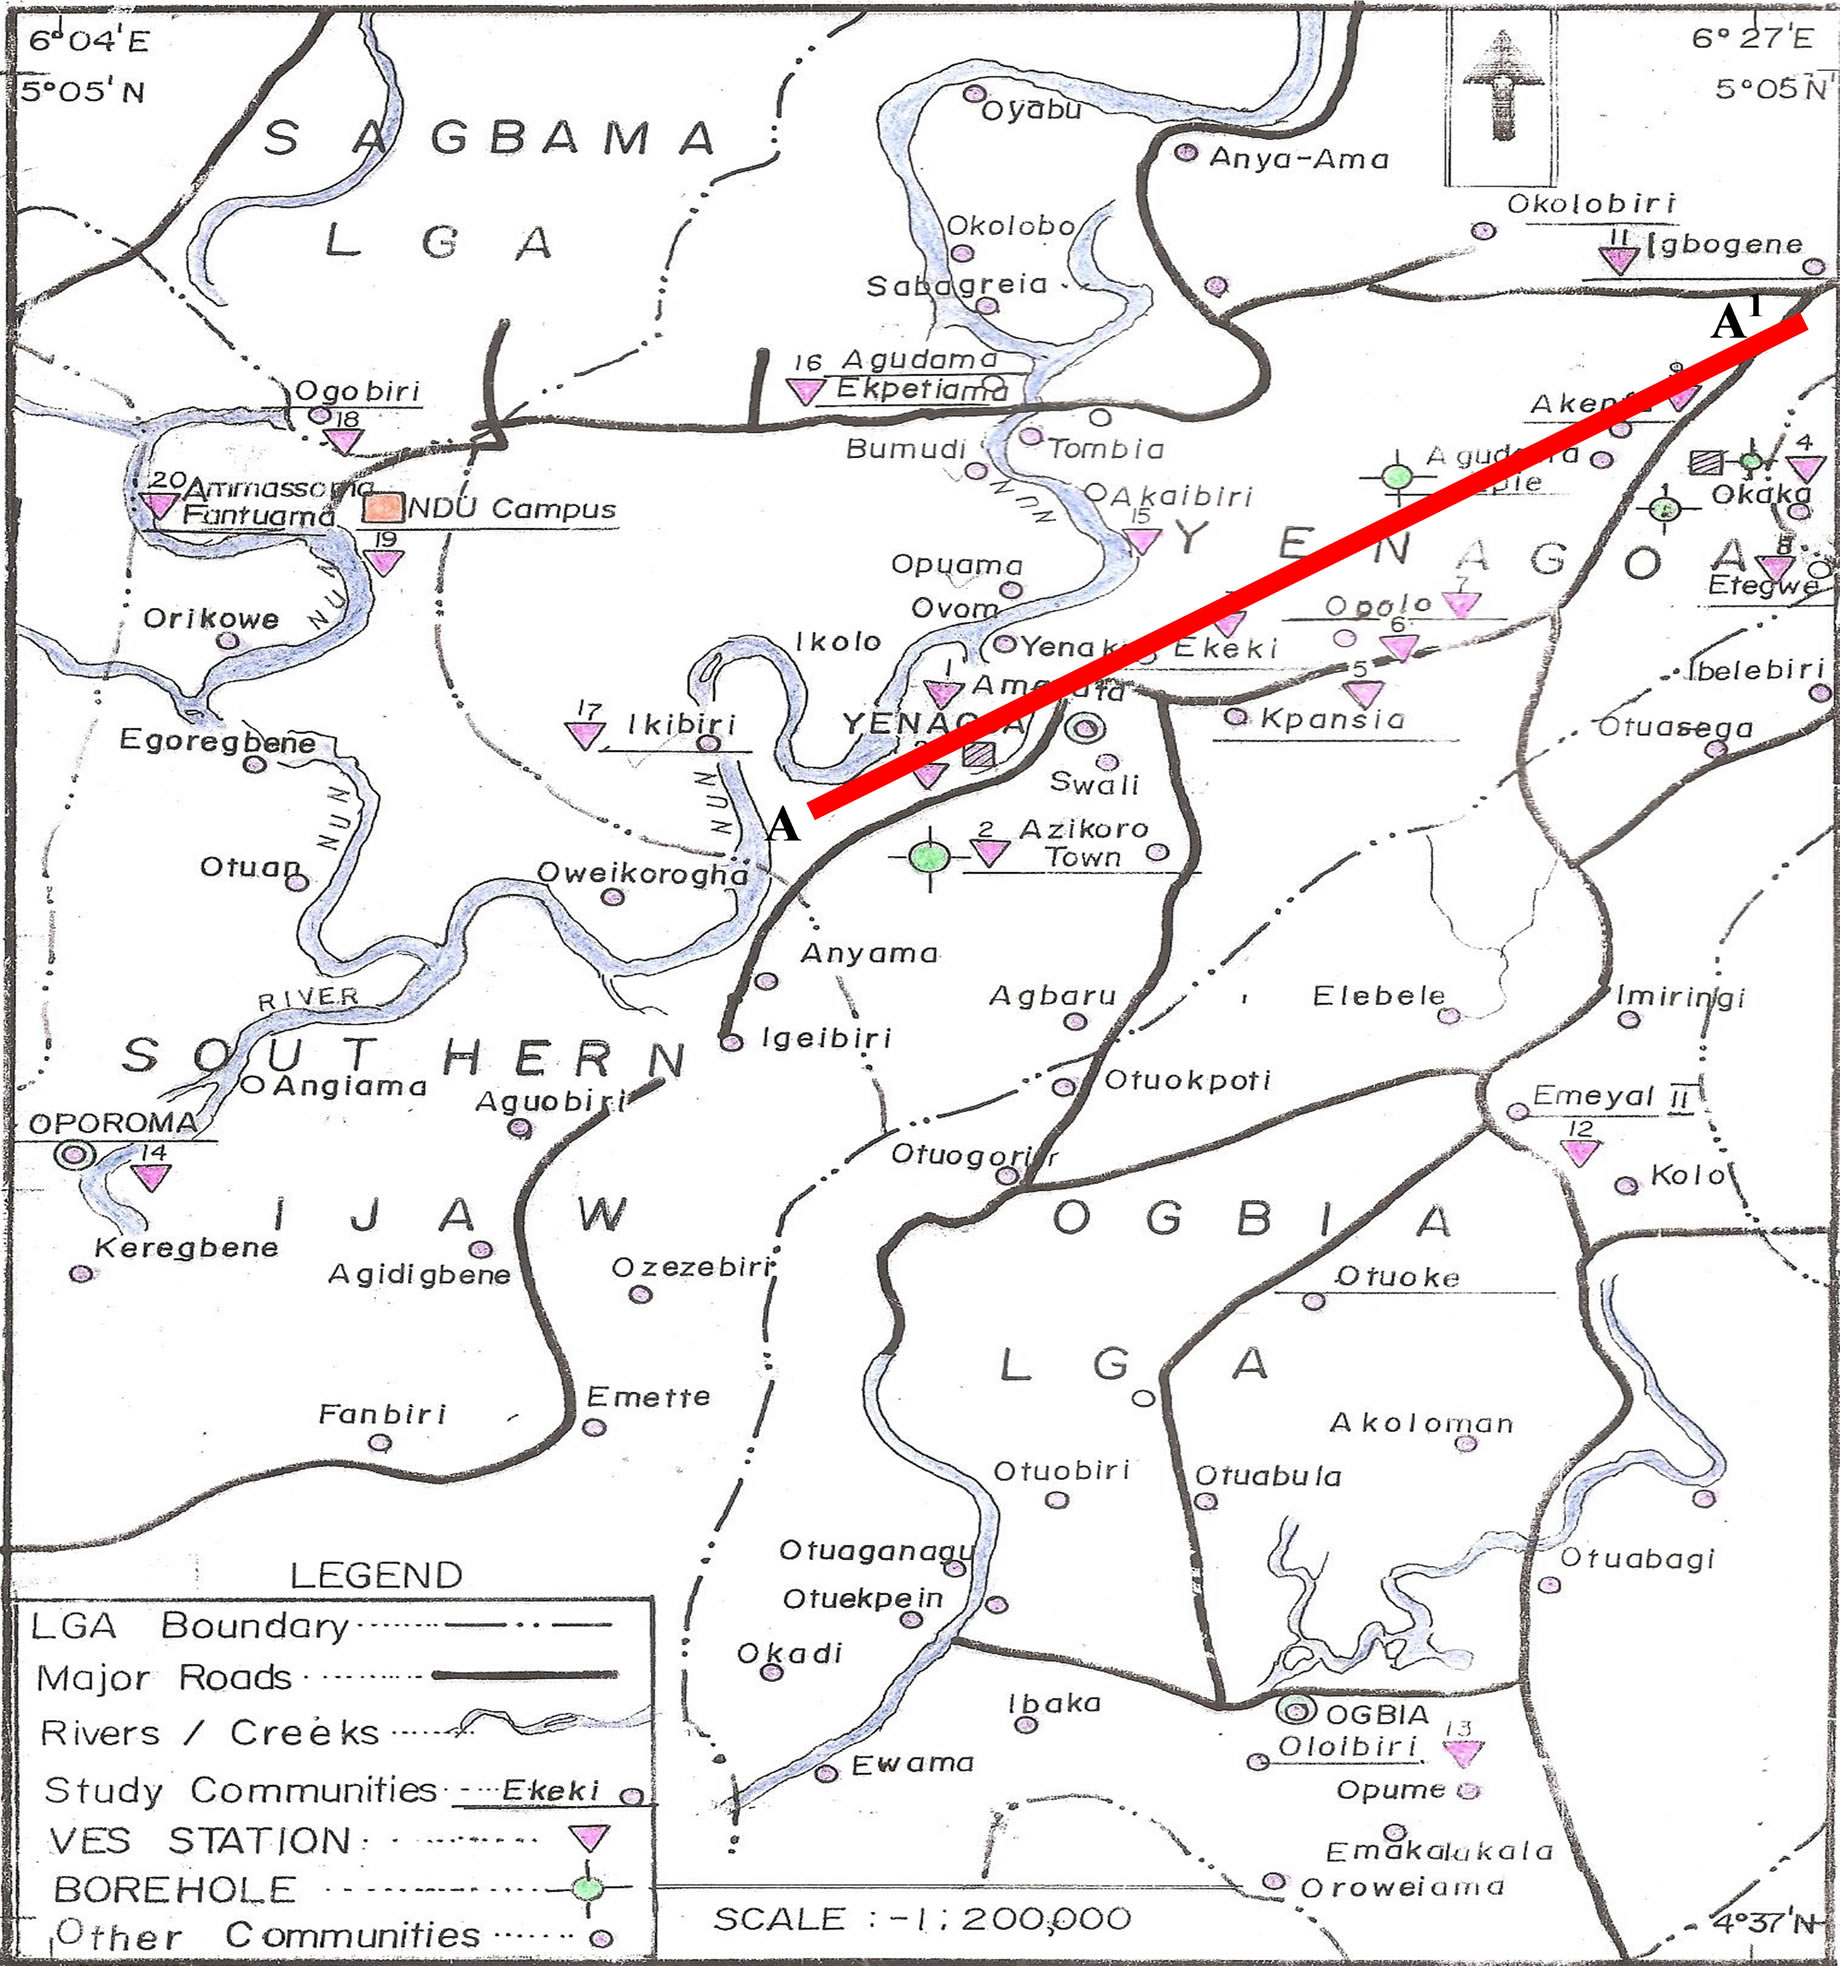
Figure 1. Map of study area showing sounding and Borehole (BH) points.
The study area is within the lower section of the upper flood plain deposits of the subearial Niger Delta [9]. The deposits are characterized by pebbles and coarse to fine sands with intercalations of silt, mud and clay in places. A variety of depositional environments (point bars, channel fills, natural levees and splay deposits, backswamps, ox-bow fills and palludal deposits) are typical [10]. The thickness of these Quaternary sediments does not exceed 120 m and it is predominantly unconfined. The specific capacities recorded from different areas within this formation vary from 6700 lit/hr/m to 13,000 lit/hr/m [11]. Underlying these Quaternary sediments is the Benin Formation which is about 2100 m thick on the average [10]. The formation represents the subsurface continental megafacies of the Niger Deltaic sequence (Table 1). It is essentially fluvial in origin and comprises of unconsolidated, massive, and porous freshwater bearing sands with localized shale interbeds. All the aquifers in the delta region are located within this lithounit. However, only the upper 200 m has been penetrated by boreholes in the study area. The age ranges from Miocene to Recent. The underlying paralic Agbada Formation, varies in thickness from 300 to 4500 m. The formation consists predominantly of unconsolidated pebbles, and very coarse to fine grained sand units with surbodinate shale beds. Syntectonic growth faults and rollover anticlinal structures are characteristic. These commonly form the major traps for oil and gas in the delta. Age ranges from Oligocene to Recent.
3. Materials and Methods
3.1. Mathematical Formulation
The combination of thickness and resistivity into single variables other words known as Dar Zarrouk parameters are used as a basis for the evaluation of aquifer properties [12-13]. The concept of Dar Zarrouk parameters were first introduced by [14] to explain the problem of non-uniqueness in the interpretation of resistivity depth sounding curves. Analytical relations between aquifer transmissivity and Dar Zarrouk parameters have been developed and various data sets tested [12,15-16]. The Dar Zarrouk parameters consist of the transverse resistance (RT) and longitudinal conductance (Lc). For a horizontal, homogeneous, and isotropic layer, the transverse resistance RT (Ωm2) is defined as:
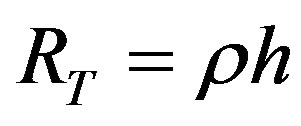 (1)
(1)
and the longitudinal conductance Lc (mho) is defined as:
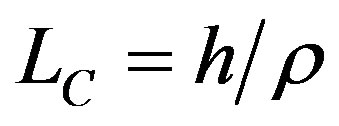 (2)
(2)
where h is the thickness of the layer (in metres) and ρ is the electrical resistivity of the layer in ohm-metres. In such a simple horizontal layer model, Niwas and Singhal. [12] established an analytical relationship between transmissivity and the Dar Zarrouk parameters based on the analogy between Darcy’s law of groundwater flow and Ohm’s law of current flow as follows:
 (3)
(3)
 (4)
(4)
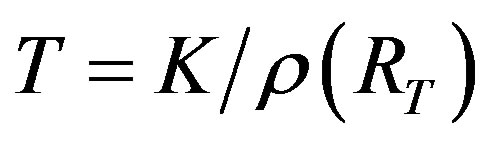
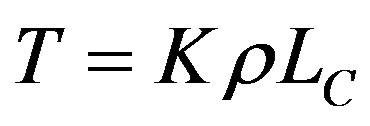
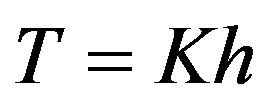
where T is the transmissivity (m2/d) defined as the product of aquifer hydraulic conductivity (K) and thickness (h), i.e.
 (5)
(5)
RT and Lc are the transverse resistance and longitudinal conductance respectively. Henriet, [17] observed that hydraulic conductivity of clayey sediment could be linked to electrical resistivity through the concept of clay content and that high clay contents generally correspond with low resistivities and hydraulic conductivity. In other words, in a clay-rich aquifer, a linear relationship exists between hydraulic conductivity and resistivity [12,18]. Therefore,
 (6)
(6)
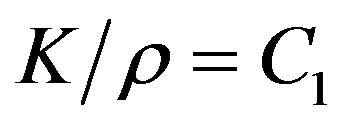
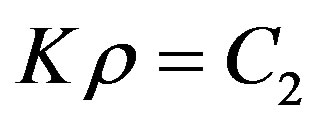
Frohlich and Kelly, [19] reported that in an unconsolidated, sandy, clay-free aquifer, a direct relationship exists between hydraulic conductivity and porosity (K α Φ), while an inverse relationship exists between porosity and resistivity (Φ α 1/ρ). Therefore,
 (7)
(7)
where C1 and C2 are constants. Substituting Equation (6) into (3), and Equation (7) into (4) gives
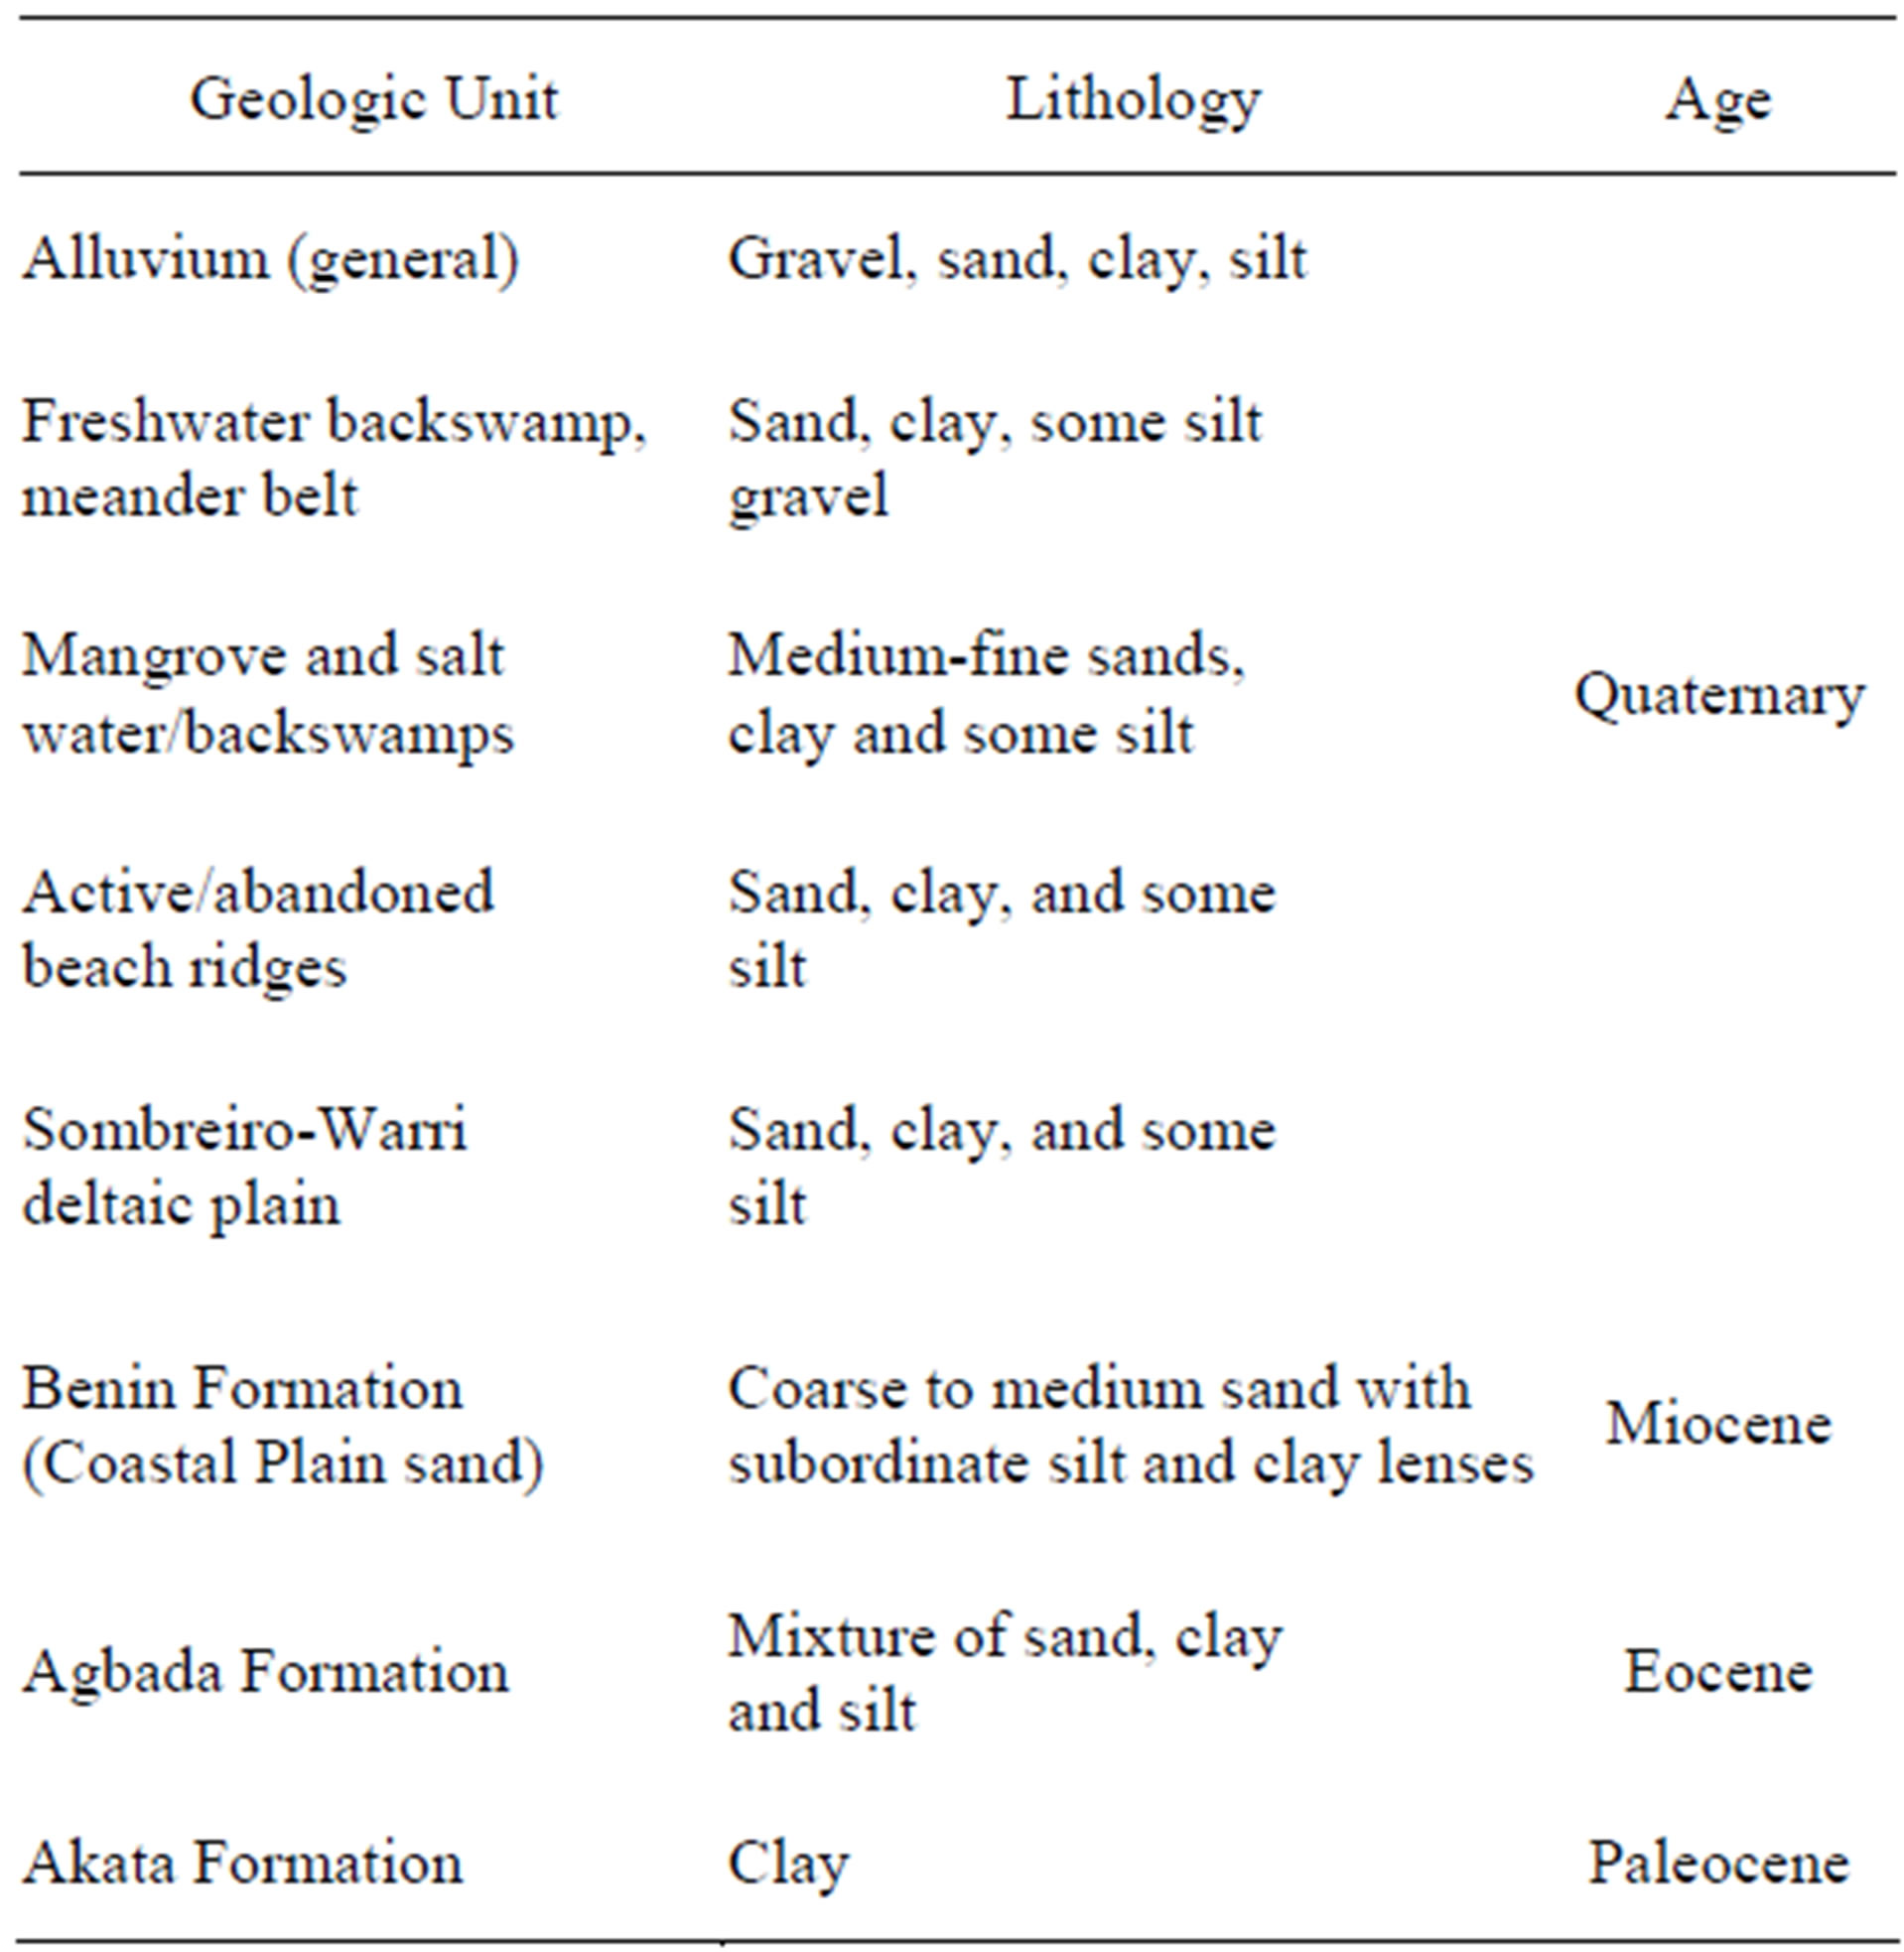
Table 1. Stratigraphic column of the Niger Delta (after Allen, 1965).
 (8)
(8)
 (9)
(9)
It implies therefore that in clay free sandy hydrogeological environments, Kρ can be considered constant; and in clay—rich environments  would remain constant. A presumption in these theoretical relations is that changes in resistivity and hydraulic conductivity across the aquifer are controlled exclusively by one factor at a time, either variations in effective porosity (Equation (7)) or changes in clay content (Equation (6)). Aside, the electrical conductivity of the groundwater is presumed not to vary significantly throughout the aquifer as this would also affect the measured resistivity [12].
Frohlich and Kelly, [18] observed that the transverse resistance is the dominant parameter for a layer when the electrical current tends to flow perpendicular to the bedding and therefore controls the shape of a K-shaped sounding curve i.e. where the middle of the three layers is of higher resistivity. Besides, when the electrical current flows parallel to the bedding, as in an H-type curve, the longitudinal conductance is the dominant parameter (Figure 2). [19] therefore suggested that depending on the geological conditions, transmissivity can be directly related to the transverse resistance or to the longitudinal conductance: the transverse resistance when clay content controls hydraulic conductivity (K-shaped) and longitudinal conductance when effective porosity is the controlling factor (H-shaped curve). Since transmissivity and the Dar Zarrouk parameters are bulk parameters, estimates of the appropriate constant (either C1 or C2) can be calculated by relating aquifer pumping test results and surface resistivity measurements at a few points in the aquifer. Transmissivity variations over the rest of the aquifer can then be easily determined from additional surface resistivity measurements.
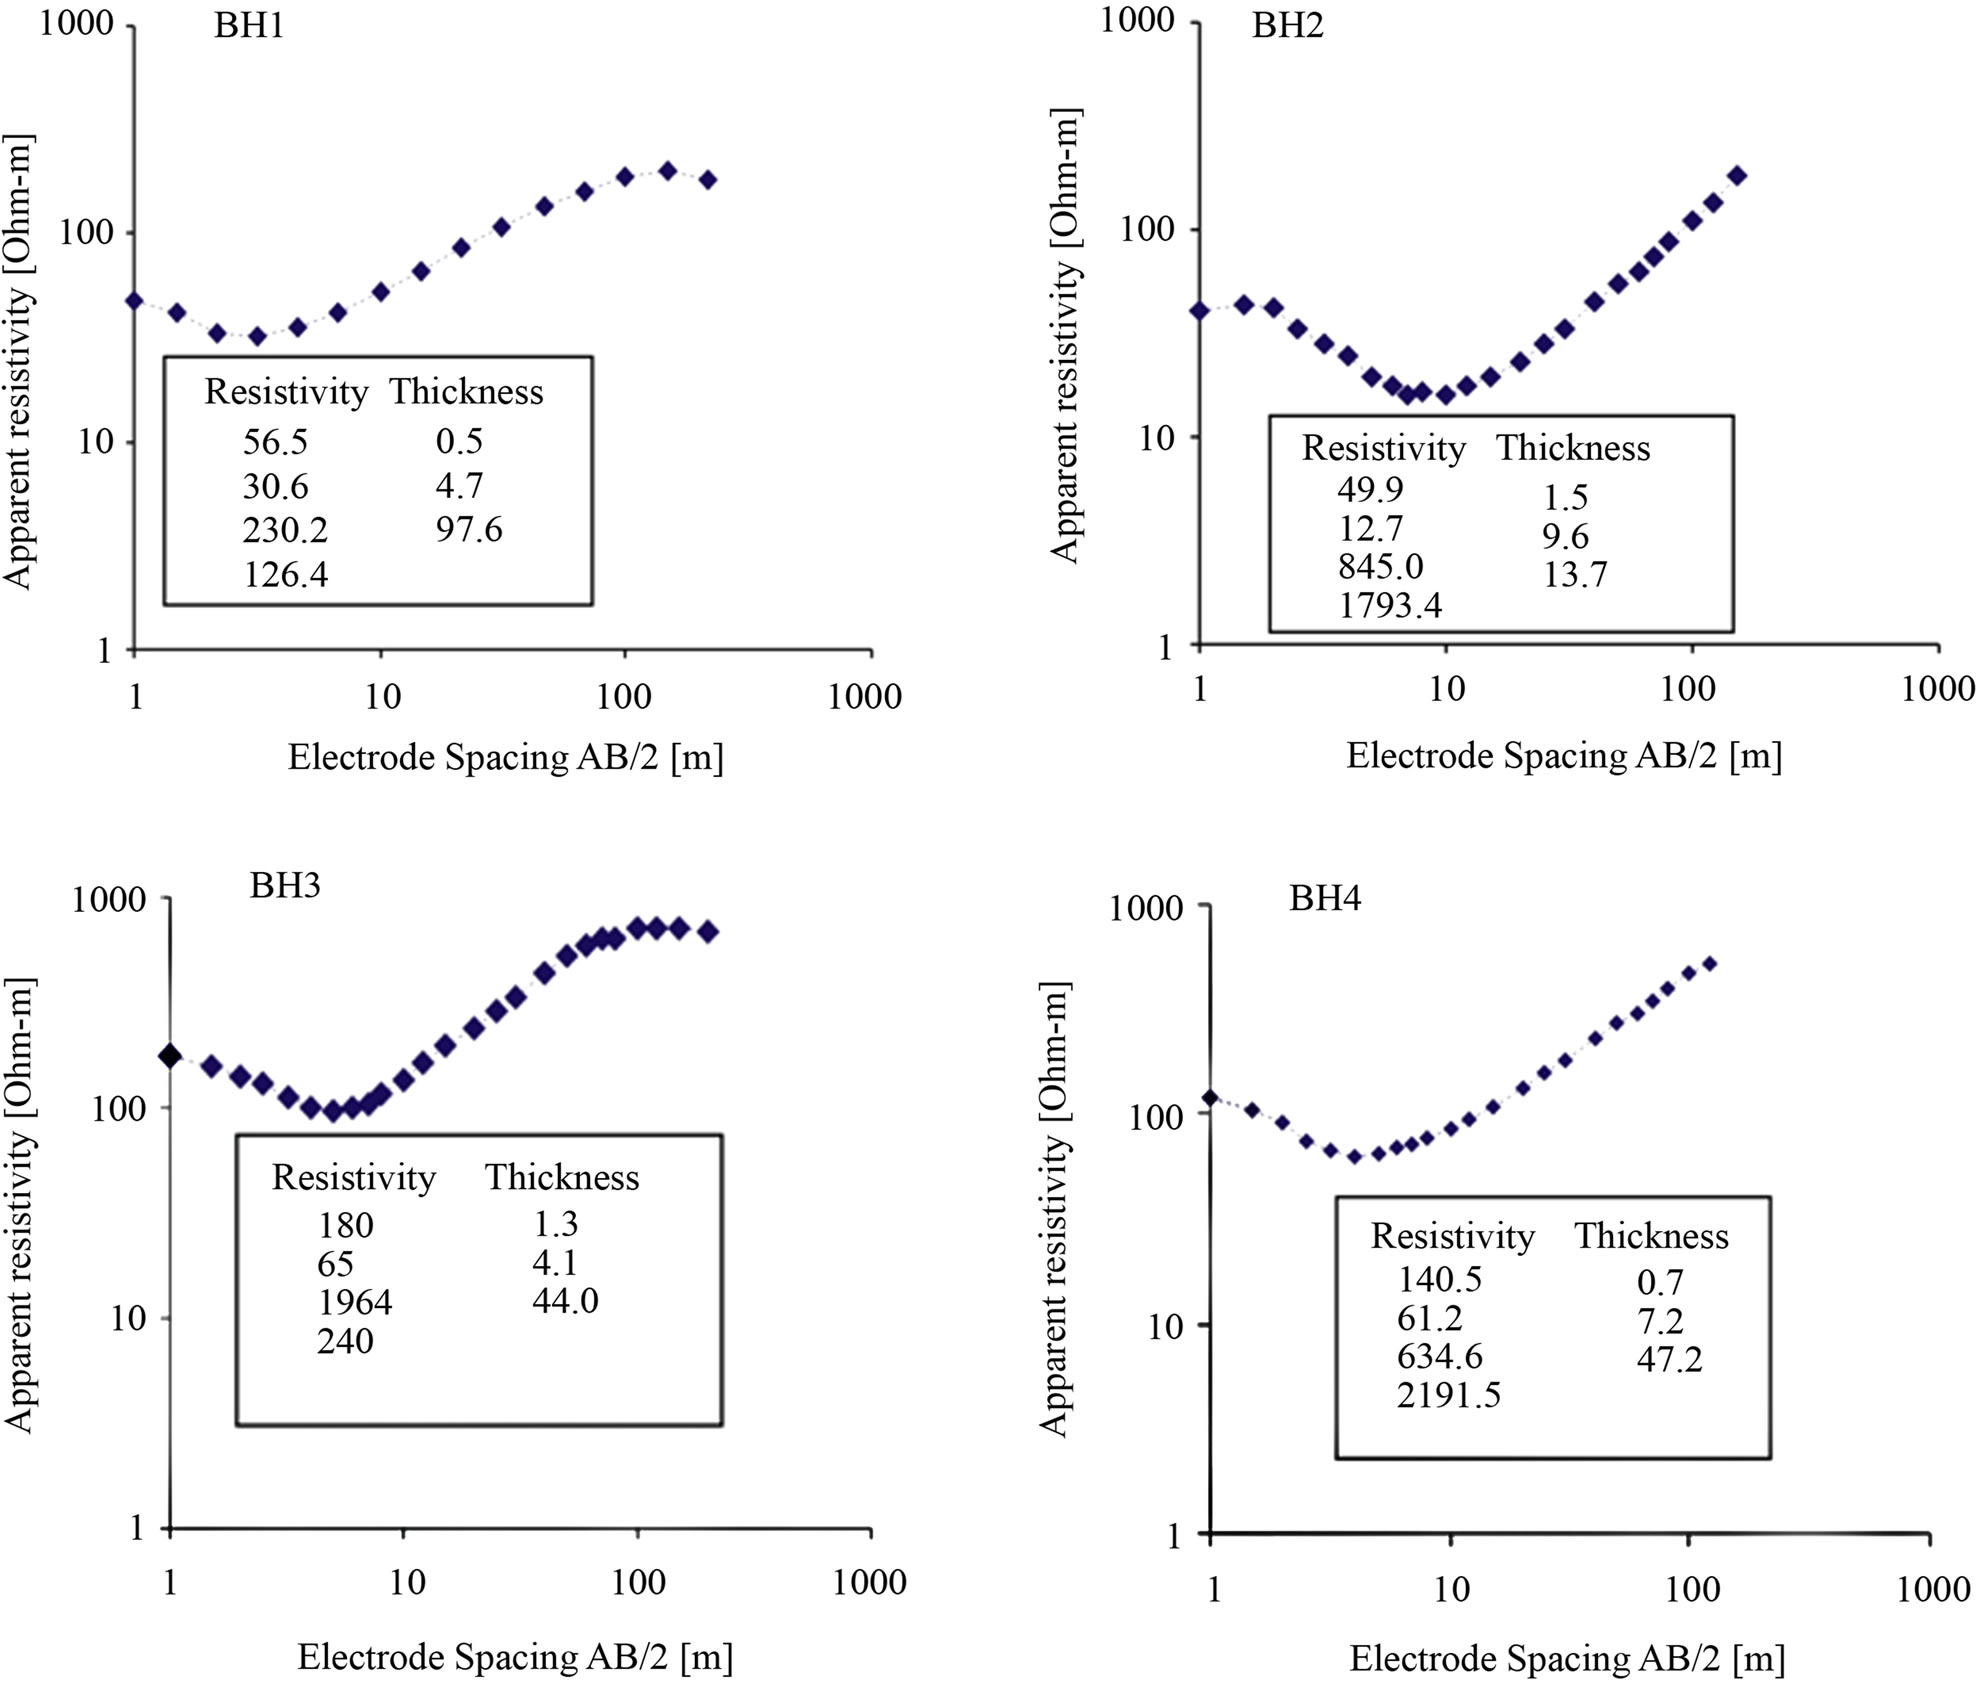
Figure 2. Resistivity soundings and interpretation at the four sites with transmissivity values.
3.2. Data Acquisition and Interpretation
The locations of the sounding points are shown in Figure 1. Vertical Electric Sounding using the Schlumberger electrode configuration was carried out by applying current to the ground through two electrodes (A and B) and then measuring the resultant potential difference (∆V) between the potential electrodes (M and N). The center point of the electrode array remains fixed but the spacings of the electrodes was increased so as to obtain information about the stratification of the ground [20]. The Schlumberger data are mostly taken in overlapping segments because at each step of AB spacing, the signals of the resistivity meter become weaker. Therefore, MN spacing was enlarged and two values for the same AB/2 were measured, one for the short and one for the long MN spacing.
The Schlumberger configuration was employed not only because it is faster and less likely to be influenced by lateral variations but also because it requires a lower number of operators. Because of extensive dense forestation and swampy terrain, soundings were carried out along existing foot paths or roads. A total of 19 VES sites were occupied. Array spread for current electrode spacing range between 300 to 400 m. The ZTI 1500 resistivity meter was used in this investigation.
Apparent resistivity values were determined by taking the product of the resistance as measured by the Terrameter and the geometrical factor, a parameter which is dependent on the potential and current electrode spacings.
The data obtained was later subjected to computer assisted iterative interpretation using a 1-D inversion technique software (1X1D, Interpex, USA). This programme was used to perform quantitative analysis and interpretation of the field curves. The software requires that the operator introduce the number, thickness, and resistivities of the subsurface layers. The theoretical curve for the initial input parameters is compared with the measured data. The starting model and its corresponding resistivity are transformed, refined or modified by the programme to obtain a best fit relation to the field data. The method of iteration was performed until the fitting error between field data and synthetic model curve became least and constant. Thus, the software yields the number, thickness and resistivity of the various layers. Borehole (BH) data was used to minimize the choice of equivalent models, by fixing thicknesses and depths to certain levels and allowing adjustment of resistivity. Correlation between VES interpretation at station 2 and borehole lithology determines the electrical characteristics of the rock units with depth (Figure 3). Figure 2 shows VES curves at four sites. Four soundings were made at the sites of existing boreholes. The respective VES stations are 02, 04, 08 and 11. Pumping test was also performed on these wells, which involve the measurement of the rise and fall of water level with respect to time. The tests were performed using submersible pumps and observations were made in the same wells. The data obtained was analyzed using Jacob Straight line method to obtain the transmissivity of the aquifer at these locations. The locations of the pumping wells are shown in Figure 1.
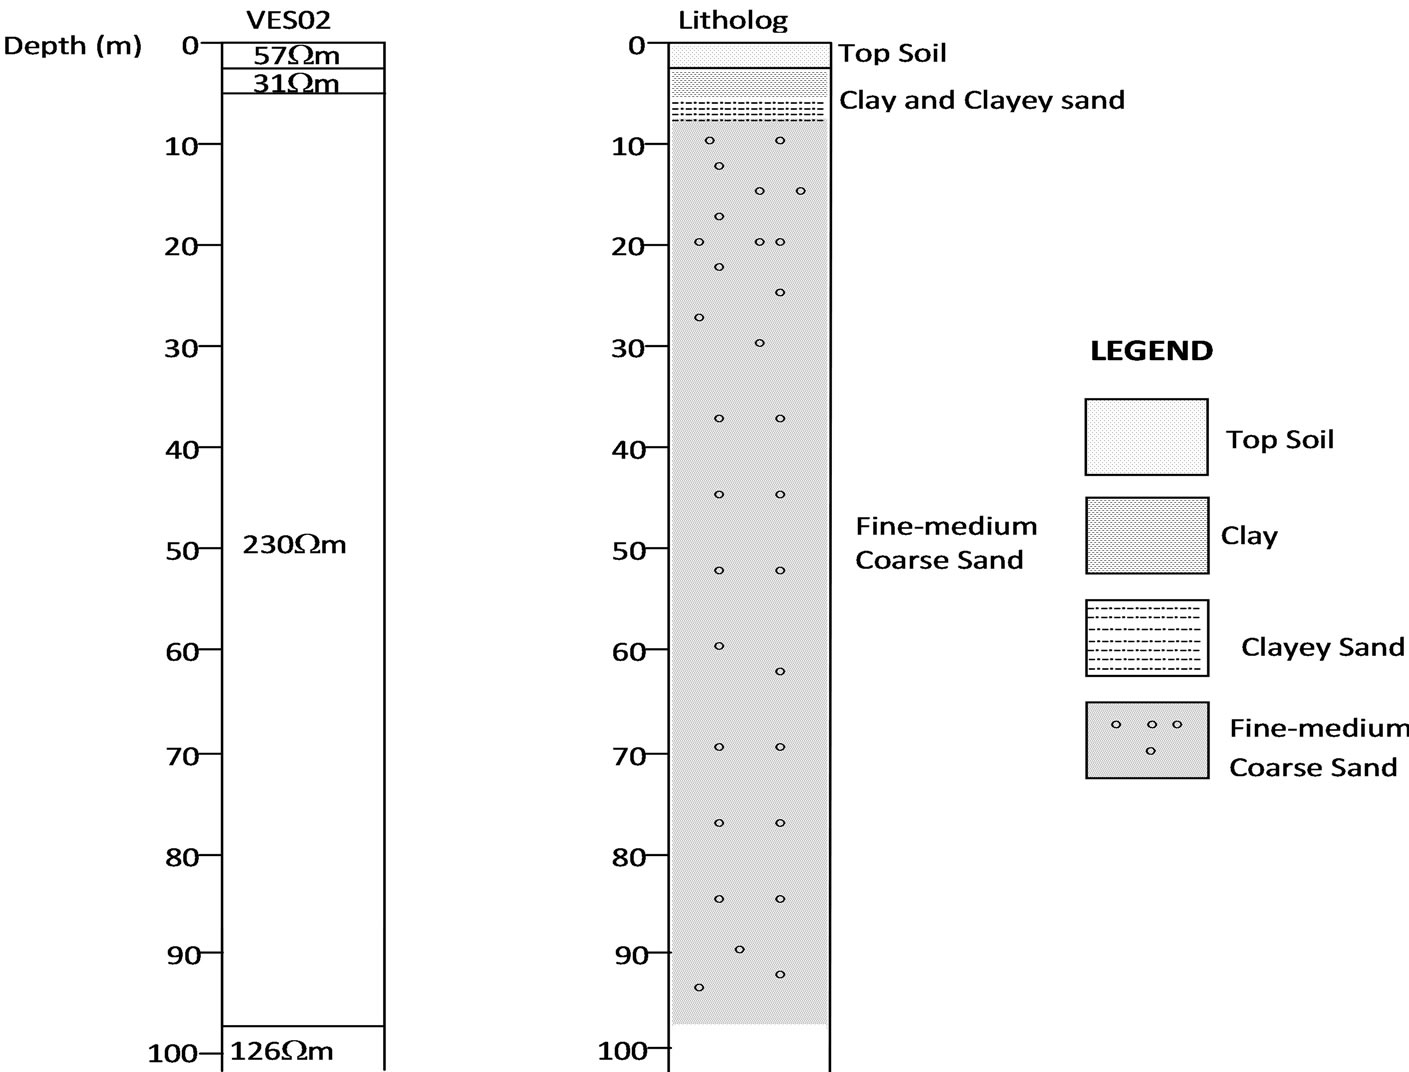
Figure 3. Correlation of VES 02 and lithology.
The general shape of the resistivity curves (Figure 2) suggests that the longitudinal conductance can be considered as the dominant Dar Zarrouk parameter. Since the longitudinal conductance is the dominant parameter, Equation (8) was used to calculate the transmissivity. From the interpretation of the resistivity data, it was possible to compute, for every VES station, the longitudinal unit conductance. Therefore, using data from the four locations where both transmissivity and longitudinal conductance data were available, a linear regression was taken between transmissivity and longitudinal conductance (Figure 4). A significant direct relation is illustrated by the data, giving a value of 2,067,900 Ω–1·m–1 for C2. Comparison of transmissivity estimated from pumping test data and transmissivity estimated from the longitudinal conductance (Figure 5) show excellent correlation (R2 = 0.92). Using the longitudinal unit conductance from the resistivity survey, the transmissivity at each of the VES sites was calculated. The transmissivity distribution in the entire area was therefore estimated (Figure 6).
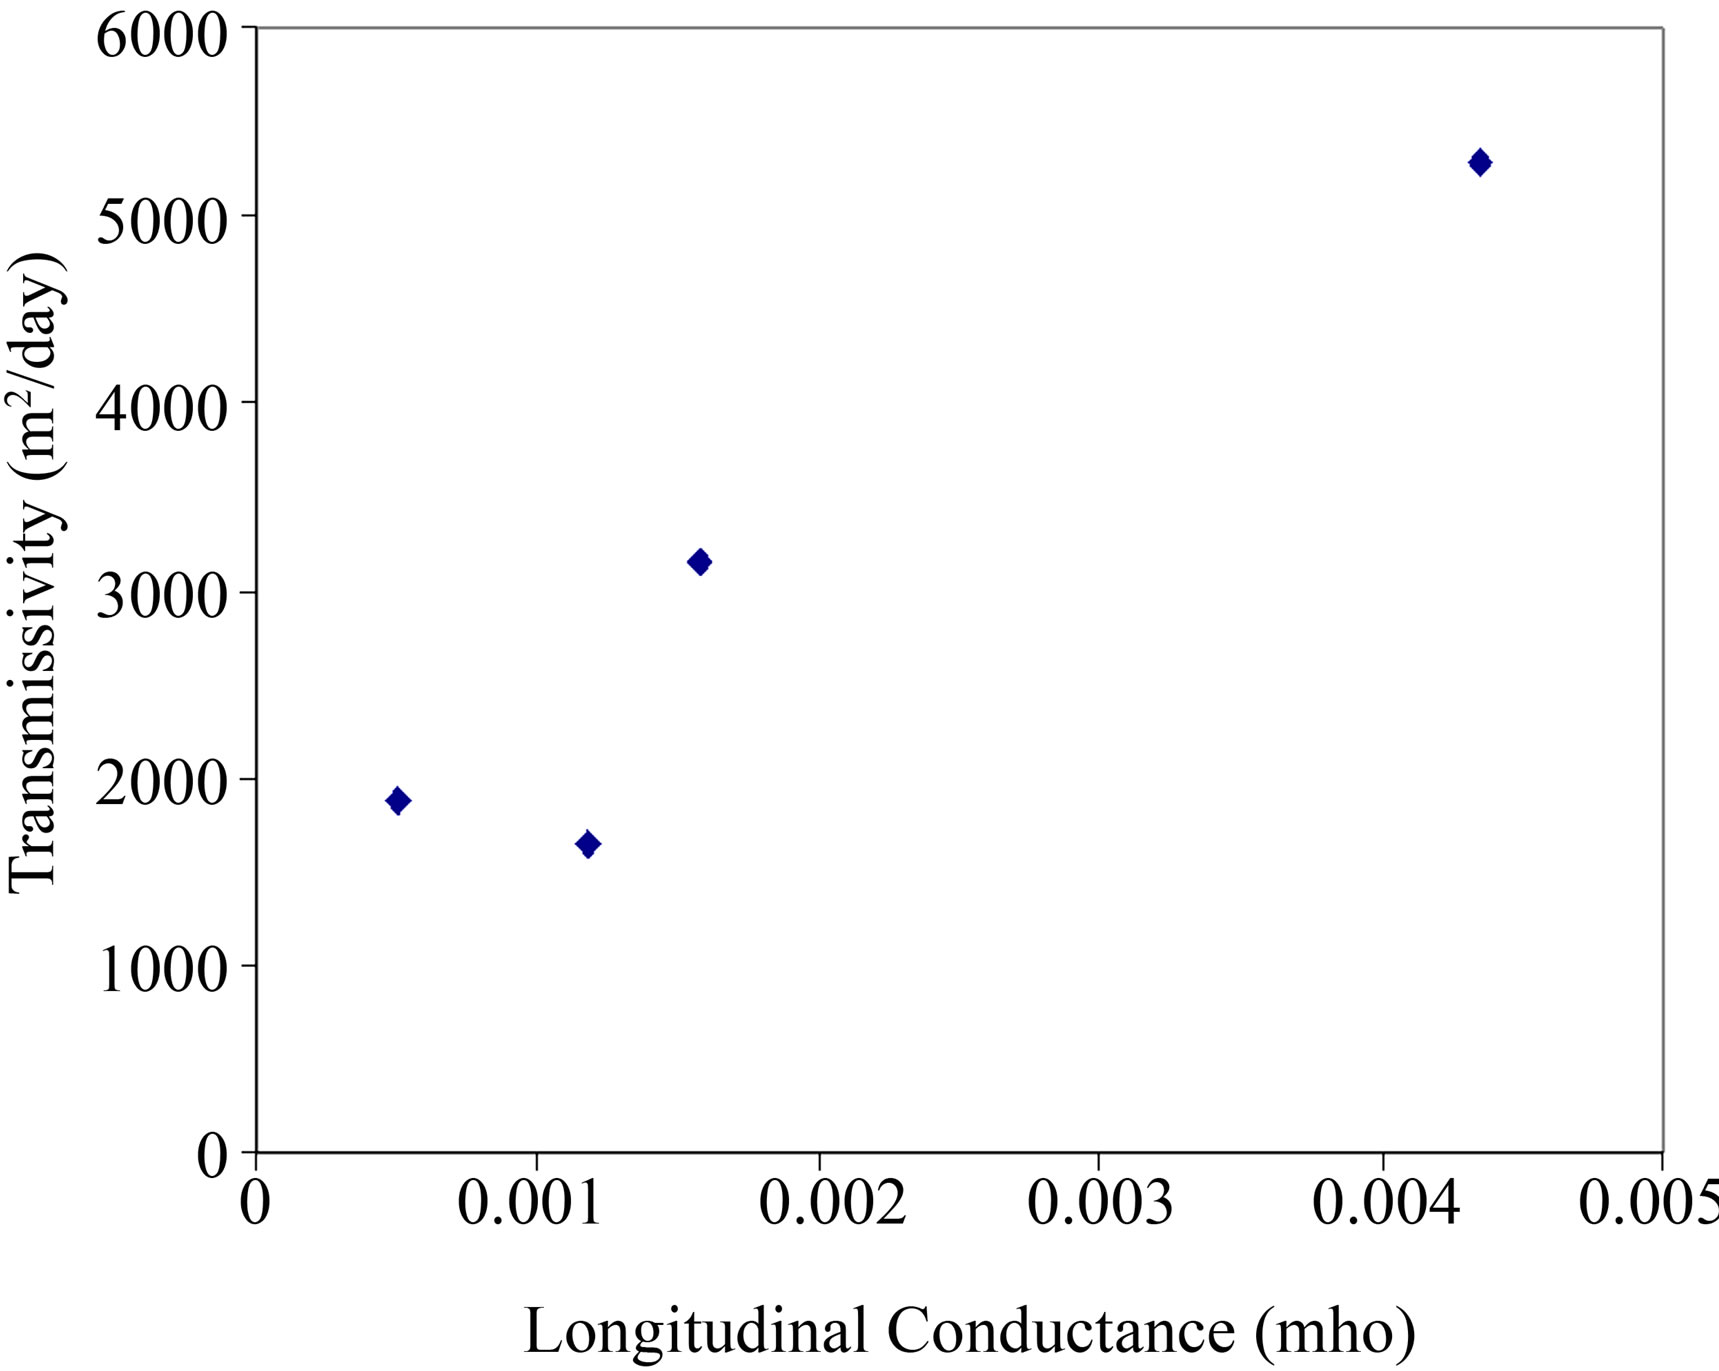
Figure 4. Longitudinal conductance and transmissivity at four sites within the study area.
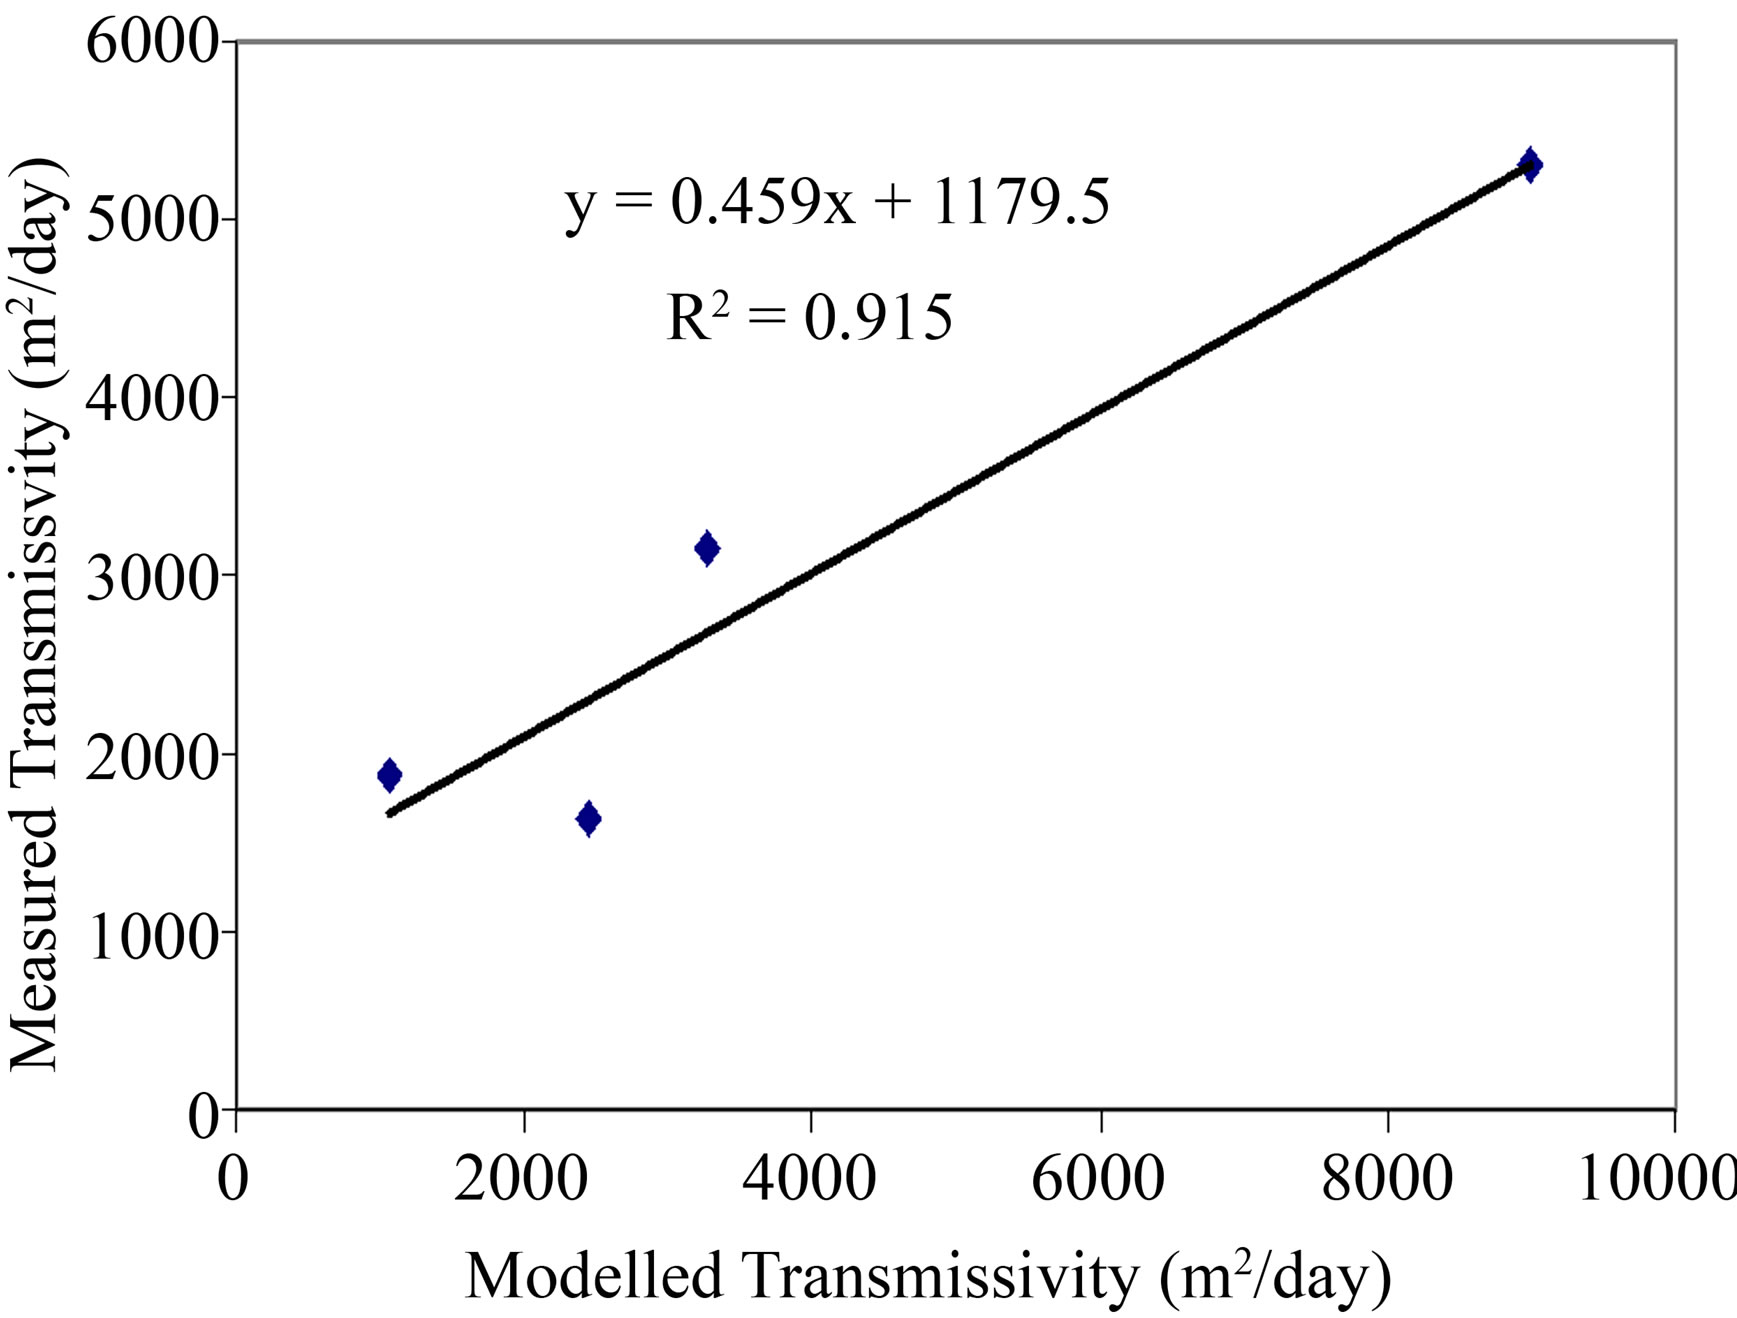
Figure 5. Correlation of measured and modeled transmissivity in the study area.
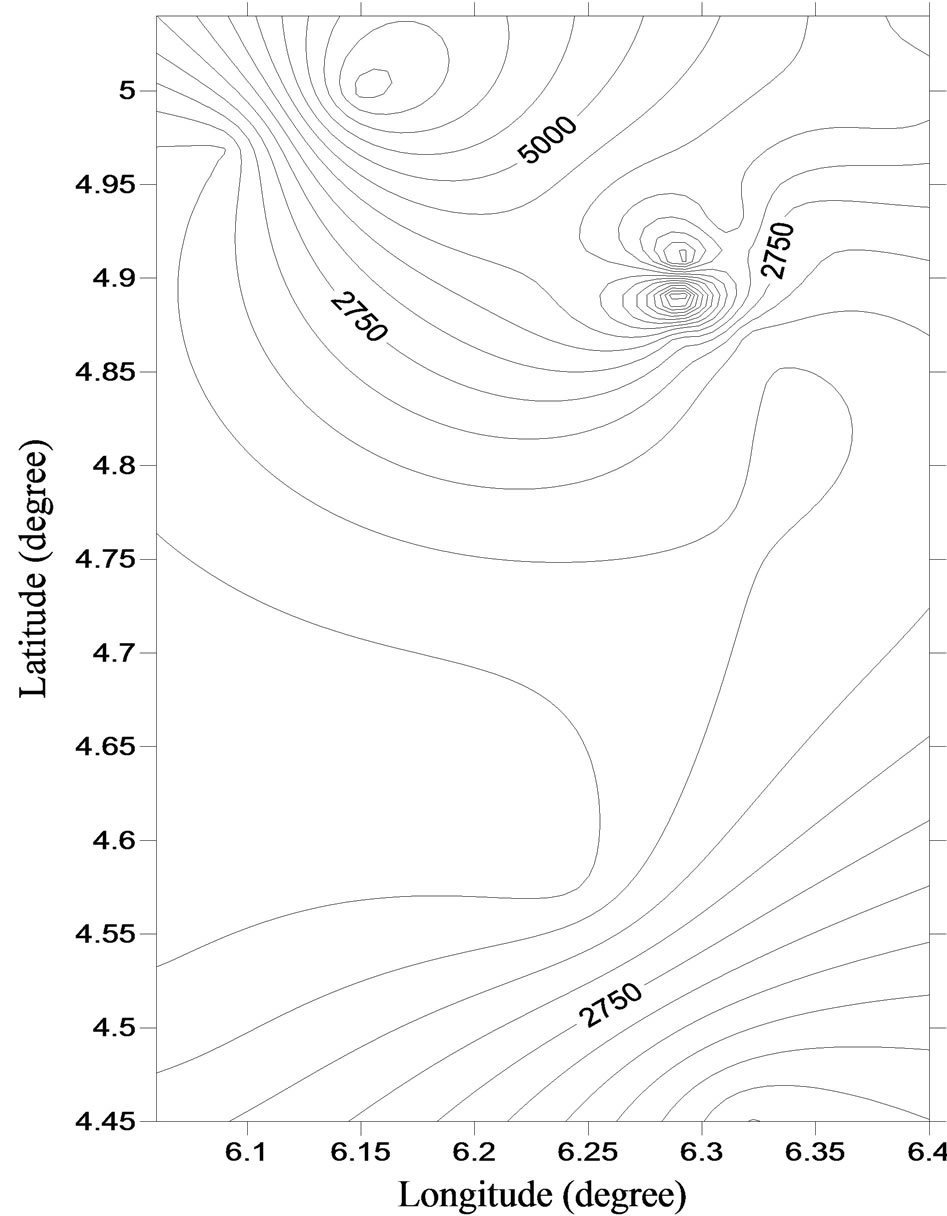
Figure 6. Transmissvity distribution in the study area estimated from the Dar Zarrouk transmissivity method.
4. Results and Discussion
Aquifer geoelectric parameters are presented in Table 2. Also shown in Table 2 are both measured and modeled transmissivity values determined from pumping test analysis using Jacob’s straight line method and those estimated using the Dar Zarrouk transmissivity method outlined in this study. Transmissivity distribution in the entire area is shown in Figure 6. Aquifer thickness is highly variable in the study area (Table 1), ranging between 11 m in the vicinity of VES 9 and 98.0 m in the vicinity of VES 2.
The lithology as inferred from litholog is fine-medium-coarse sand (Figure 3). The resistivity of the aquiferous layer range between 230 - 2868.2 Ωm with an average of 1014.7 Ωm. The transmissivity values are high over the entire area implying good groundwater potential. Measured transmissivity values range between 1634.0 - 5292.0 m2/day with an average of 2987.0 m2/day, while calculated transmissivity values range between 721.0 - 8991.0 m2/day with an average of about 3339.4 m2/day (Table 2).
Computed transmissivity values were plotted against transmissivity values determined from the pumping test data obtained in the same location (Figure 5). The regression line fitted to these data indicated a fairly good relation giving R2 = 0.92. The high transmissivity values
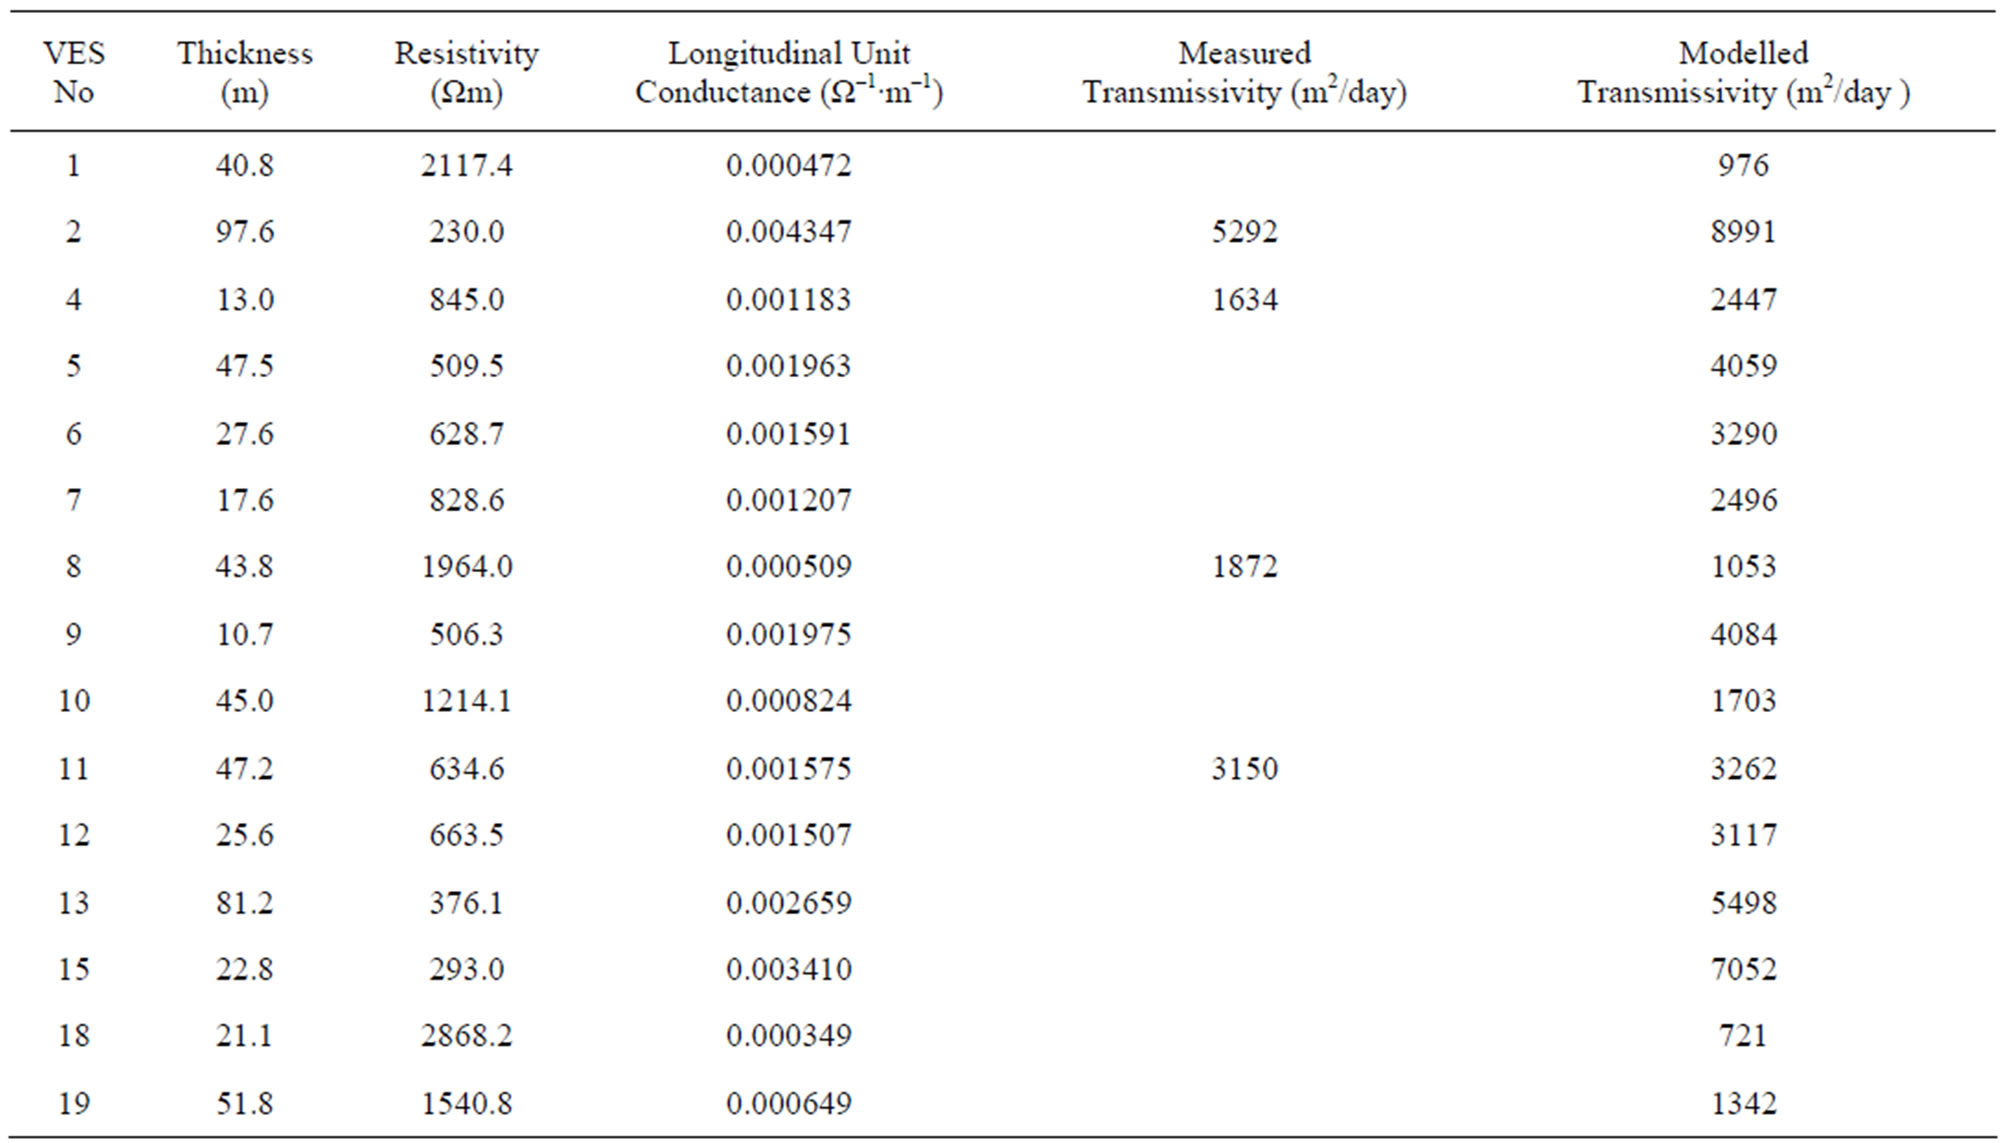
Table 2. Aquifer geoelctric parameters with measured and modeled Transmissivity values.
are consistent with the finding that the aquifer is composed of unconsolidtated fine-medium-coarse sands. Boreholes and wells located in the area are highly productive. The estimated transmissivity values of the quaternary alluvial sediments show a wide variation presumably due to the inhomogeneity of the sedimentary formation.
5. Conclusion
Drilling of wells to determine aquifer hydraulic parameters is often prohibitively expensive, thus Dar Zarrouk transmissivity technique outlined in this study in determining the aquifer transmissivity from VES is a cost effective alternative. The advantage of using Dar Zarrouk parameters to estimate transmissivity is that the nonuniqueness of interpreting resistivity data is minimized. The results give a useful first approximation of the transmissivity variation and could be used to site exploratory boreholes. Transmissivity values derived from analyzing pumping test data range from 1634.0 - 5292.0 m2/day while estimated transmissivity values range from 721.0 m2/day to 8991.0 m2/day. The correlation coefficient i.e. R2 = 0.92. The close agreement between estimated transmissivity values from analysis of vertical electric sounding data and transmissivity values calculated from pumping test data attests to the validity of the method. The high transmissivity values recorded over most parts of the area also agree with the geology of the Benin Formation (Coastal Plain Sands) consisting of fine-medium-coarse grained sands.
6. Acknowledgements
We are grateful to Mr Eleazer Ogulu for assisting in carrying out the pumping test and Dr Ebisomu Agedeh, for allowing us to use his borehole for the pumping test. Special thanks to Mr Franklin Akali for helping in acquiring the VES data.
REFERENCES
- A. T. Batayneh, “A Hydrogeophysical Model of the Relationship between Geoe Lectric and Hydraulic Parameters, Central Jordan,” Journal of Water Resource and Protection, Vol. 1, No. 6, 2009, pp. 400-407.
- V. Shevnin, O. Delgado-Rodriguez, A. Mousatov and A. Ryjov, “Estimation of Hydraulic Conductivity on Clay Content in Soil Determined from Resistivity Data,” Geofisica Internacional, Vol. 43, No. 3, 2006, pp. 195-207.
- G. V. Keller and F. C. Frischnechk, “Electrical Methods in Geophysical Prospecting,” Pergamon Press, Oxford, 1966, pp. 91-135.
- A. A. A. Zohdy, G. P. Eaton and D. R. Mabey, “Application of Surface Geophysics to Groundwater Investigations,” In: G. V. Keller and F. C. Frischnechk, Eds., Techniques of Water Resources Investigations of the United States Geological Survey, United States Government Printing Office, Washington DC, 1974, pp. 12-26.
- P. Sikander, A. Bakhsh, M. Arshad and T. Rana, “The Use of Vertical Electric Sounding Resistivity Method for the Location of Low Salinity Groundwater for Irrigation in Chaj and Rana Doabs,” Environmental Earth Sciences, Vol. 60, No. 5, 2010, pp. 1113-1129.
- W. Kelly, “Geoelectric Sounding for Estimating Aquifer Hydraulic Conductivity,” Ground Water, Vol. 15, No. 6, 1977, pp. 420-424. doi:10.1111/j.1745-6584.1977.tb03189.x
- O. Mazac, W. E. Kelly and I. Landa, “A Hydrogeological Model for Relations between Electrical and Hydraulic Properties of Aquifers,” Journal of Hydrology, Vol. 79, No. 1-2, 1985, pp. 1-19. doi:10.1016/0022-1694(85)90178-7
- L. C. Amajor and C. O. Ofoegbu, “Determination of Polluted Aquifers by Stratigraphically Controlled Biochemical Mapping: Example from the Eastern Niger Delta, Nigeria,” In: C. O. Ofoegbu, Ed., Groundwater and Mineral Resources of Nigeria, F. Vieweg, Braunschweig/Wiesbaden, 1988, pp. 62-73.
- J. R. L. Allen, “Late Quaternary Niger Delta and Adjacent Areas: Sedimentary Environments and Lithofacies,” American Association of Petroleum Geologists Bulletin, Vol. 49, No. 5, 1965, pp. 549-600.
- K. Short and A. J. Stauble, “Outline of Geology of Niger Delta,” American Association of Petroleum Geologists, Vol. 51, No. 5, 1965, pp. 761-779.
- M. E. Ofodile, “An Approach to Groundwater Study and Development in Nigeria,” Mecon Services Ltd., Ranchi, 1991, pp. 138-148.
- S. Niwas and D. C. Singhal, “Estimation of Aquifer Transmissivity from Dar Zar Rouk Parameters in Porous Media,” Journal of Hydrology, Vol. 50, 1981, pp. 393- 399. doi:10.1016/0022-1694(81)90082-2
- R. Dhakate and V. S. Singh, “Estimation of Hydraulic Parameters from Surface Geophysical Methods, Kaliapani Ultramafic Complex, Orissa, India,” Journal of Environmental Hydrology, Vol. 13, No. 12, 2005, pp. 1-11.
- R. Mailet, “The Fundamental Equations of Electrical Prospecting,” Geophysics, Vol. 12, No. 4, 1974, pp. 529-556. doi:10.1016/0022-1694(85)90050-2
- S. Niwas and D. C. Singhal, “Aquifer Transmissivity of Porous Media from Resistivity Data,” Journal of Hydrology, Vol. 82, No. 1-2, 1985, pp. 143-153.
- M. S. Kumar, D. Gnanasundar and L. Elango, “Geophysical Studies to Determine Hydraulic Characteristics of an Alluvial Aquifer,” Journal of Environmental Hydrology, Vol. 9, No. 15, 2001, pp. 1-8.
- J. P. Henriet, “Direct Applications of Dar Zarrouk Parameters in Groundwater Surveys,” Geophysical Prospecting, Vol. 24, No. 2, 1976, pp. 344-353. doi:10.1111/j.1365-2478.1976.tb00931.x
- R. K. Frohlich and W. E. Kelly, “The Relation between Hydraulic Transmissivity and Tranverse Resistance in a Complicated Aquifer of Glacial Outwash Deposits,” Journal of Hydrology, Vol. 79, No. 3-4, 1985, pp. 529-556. doi:10.1016/0022-1694(85)90056-3
- M. MacDonald, J. Burleigh and W. Burgess, “Estimating Transmissivity from Surface Resistivity Soundings: An Example from the Thames Gravels,” Quarterly Journal of Engineering Geology, Vol. 32, No. 2, 1999, pp. 199-205. doi:10.1144/GSL.QJEG.1999.032.P2.09
- O. Koefoed, “Geosounding Principles 1. Resistivity Sounding Measurements,” Elsevier, Amsterdam, 1977.
NOTES
*Corresponding author.