Journal of Geographic Information System
Vol.5 No.4(2013), Article ID:35341,15 pages DOI:10.4236/jgis.2013.54034
Geospatial Evaluation for Ecological Watershed Management: A Case Study of Some Chesapeake Bay Sub-Watersheds in Maryland USA
Benedict College, Columbia, South Carolina, USA
Email: istijosh@yahoo.com
Copyright © 2013 Isoken T. Aighewi, Osarodion K. Nosakhare. This is an open access article distributed under the Creative Commons Attribution License, which permits unrestricted use, distribution, and reproduction in any medium, provided the original work is properly cited.
Received March 18, 2013; revised April 18, 2013; accepted May 18, 2013
Keywords: Geospatial; Land Use; Water Quality; Remote Sensing; Nutrients; Watershed; GIS
ABSTRACT
Geospatial technology is increasingly being used for various applications in environmental management as the need for sustainable development becomes more evident in today’s rapidly-developing world. As a decision tool, Geographic Information system (GIS) and Global positioning System (GPS) can support major decisions dealing with natural phenomena distributed in space and time. Such is the case for land use/cover known to impact ecosystems health in very direct ways. Our study examined one such application in managing land use of some sub-watersheds in the eastern Shore of Maryland, USA. We conducted a 20-year historical land use/cover evaluation using Landsat-TM remotely sensed images and GIS analysis and water monitoring data acquired during the period by Maryland Department of Natural Resources, including sewage discharge of some municipalities in the area. The results not only showed general trends in land use patterns, but also detailed dynamics of land use-land cover classes, impact on water quality, as well as other useful information for guiding both terrestrial and aquatic ecosystems management decisions of the sub-watersheds. The use of this technology for evaluating trends in land use/cover on a decade-by-decade basis is recommended as standard practice for managing ecosystem health on a sustainable basis.
1. Introduction
Information has always been the cornerstone of effective decisions [1]. Consequently, most scientists and environmental managers in the US and many developed countries of the world now fully embrace geospatial technology (Geographic information systems, remote sensing and global positioning system) for the study of the environment, reporting on environmental phenomena, and modeling how the environment is responding to natural and man-made factors. Modeling land use/cover in relation to ecosystems is among such uses. Land use change has been known to be one of the most ubiquitous anthropogenic influences on global ecosystems [2]. Land cover patterns have also changed dramatically during the last century especially in North America with these historic changes leaving persistent legacies; similarly, the amount of land converted to urban and agricultural uses and the spatial arrangement of riparian habitats are useful indicators of the status of riverine ecosystems of the present times [3]. It has been reported that Change occurring on land affects water quality and thus the ecological health of the aquatic ecosystems; and such has been correlated with the degradation of biological, chemical and physical properties of streams within the Chesapeake Bay watershed [4]. The Lower Eastern Shore watershed and Coastal Bays of Maryland-subsets of the Chesapeake Bay watershed, have experienced rapid urbanization in the last decade with the increase in real estate development and roads as obvious indicators. Jantz et al., [5] observed a 61% increase in developed land within the Chesapeake Bay watershed between 1990 and 2000, with most (64%) of the new development occurring on agricultural lands and grasslands, while 33% occurred on forested lands. A decade ago, the US Environmental Protection Agency [6] reported that urbanization was threatening Maryland streams and that if the rate of urban sprawl continued, more streams will likely degrade. In that year, about 16% of Maryland’s land area was urban and was expected to grow to 21% in the next 25 years, while only 42% of the state was forested.
A Coastal Change Analysis Program (C-CAP) was initiated by the National Oceanic and Atmospheric Administration (NOAA) for monitoring LULC changes of the coastal regions of the US on a 5-year basis starting from 1996 [7]; and is still currently investigating techniques for analyzing land cover change data trends. Similarly, the Multi-Resolution Land Characteristics Consortium (MRCL) and the National Land Cover Data (NLCD) also exists for 1973, 1992, and 2001 [8]. However, no published analysis of long term trends in land use/cover exist-particularly in view of the rapidly changing demography as well as the agronomic and poultry industries of the coastal Eastern Shore of Maryland since the 1980’s.
The state of US surface water systems has also been receiving major attention due to point and non-point source pollution from anthropogenic sources. For example, a survey of some US surface waters [9] showed that about 44% of the assessed stream miles, 64% of assessed lake acres, and 30% of the assessed bay and estuarine square miles were not clean enough to support uses such as fishing and swimming. The leading causes of impairment-pathogens, mercury, nutrients, and organic enrichment/low dissolved oxygen are from sources such as atmospheric deposition, agriculture, hydrologic modifications, and unknown or unspecified sources. Although the Clean Water Act (CWA) was intended to restore and maintain the chemical, physical, and biological integrity of the nation’s surface waters [10], this goal has thus continued to pose a major challenge for water quality compliance, particularly due to contribution for nonpoint sources.
Significant relationships between land use-land cover (LULC) and water quality have been well documented over the years [11-18]. Agriculture, urban activity and industrialization are major sources of non-point pollution that contribute significant amounts of Phosphorus (P) and Nitrogen (N) to surface waters in the United States [19]. Urbanization has also been identified as a major threat to Maryland streams [6], and that a continuation of this trend could bring more streams into degraded status. This report classified 46% of all streams in Maryland in poor biological health conditions. It has been predicted that non-point source pollution will increase in the future if current land use-land cover practices continue [19]. It has been reported [17] that the extent of urban lands and its proximity to streams was the most important factor in predicting N and P concentrations in stream water. Also, lakes with highly forested catchments had lower levels of lead and chlorine and were less prone to eutrophication than lakes in non-forested catchments [20]. Urbanization and population growth usually lead to increased volume of wastewater, requiring treatment before discharge into surface waters; this invariably results in higher volumes of sewage effluents (usually containing high P and N) and thus increased point source pollution. The most deleterious effects of sewage discharge into coastal environment are eutrophication [21]. Sewage effluent discharged into surface water can also result in significant effects on marine biota [22], leading to changes in abundance, biomass and diversity of the organisms. While several studies exist for relating cause-and-effect of point and non-point pollution on water quality, studies that incorporate long-term trends are few. Such studies could provide better and more holistic insight into factors influencing surface water quality; and could potentially provide more precise and useful information for decisions on land use and water system management at the watershed and landscape levels.
The objectives of this study therefore were to 1) apply geospatial techniques for evaluating the historical Land use-land cover (LULC) trends in the lower Eastern Shore watersheds of Maryland over a 20 year period; and 2) evaluate the influence of historical land use-land cover changes and sewage loading on surface water quality of some lower Eastern shore watersheds.
2. Study Area
This study was conducted in the lower Eastern Shore watershed and coastal bays of Maryland situated between longitudes 74˚59'15.2''W and 76˚17'5.6''W and latitudes 37˚54'12.4''N and 38˚53'10.7''N. It is located between the Atlantic Ocean and the Chesapeake Bay and drains approximately 5596.69 km2 in Wicomico, Somerset and Worcester counties; and some portions of Caroline and Dorchester counties.
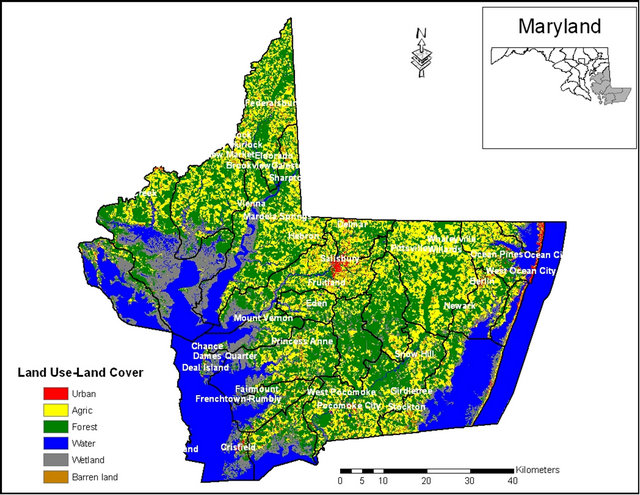
Major land use in the area includes cropland, forestry, pasture and urban; and water bodies include estuary, river/stream and wetlands. The area which is less than 100 feet above sea level includes a total of 23 sub watersheds [23] (see Figure 1). The major economic activities in the lower eastern shore are poultry production and grain farming-corn, soybeans and barley, including other important economic activities such as fishery and tourism.
3. Data and Methods
To capture historical land use/cover changes, remotely sensed satellite data were sourced from the United States Geological Survey’s Center for Earth Resources Observation Sciences (USGS-EROS). To this end, Landsat-TM satellite data of Maryland (Path 14, rows 33 and 34) for 1986 (May 6), 1996 (May 1) and 2006 (April 27) were obtained in GeoTiff format. These images were of 10 days temporal variability (1986-2006) due to cloud cover and were systematically corrected; the data were of very high acquisition quality and had been geo-referenced and atmospherically corrected. The reflective bands 1 - 5 and

Figure 1. Lower eastern shore of Maryland study sites.
7 were of pixel size of 30 m, while the thermal band 6 was 60 m. All maps were projected using NAD83 UTM Zone 18.
Historical (1986-2006) water quality data of the lower Eastern Shore watersheds monitored by Maryland’s Department of Natural Resources (MD-DNR) was acquired from the US Environmental Protection Agency Chesapeake Bay Program [24]. The scope was limited to assessment of physical and chemical water quality parameters such as Total phosphorus (TP), Total nitrogen (TN), total suspended solids (TSS), chlorophyll-a (CHLA), Secchi disc depth (SECCI), dissolved oxygen (DO), pH (PH), specific conductivity (SPCOND), salinity (SAL) and water temperature (WTEMP). Water quality data were pre-processed by taking the means for each month. Representative months for each season were taken to avoid bias from missing data. In this regard, the month of January was taken to represent winter, April to represent spring and July and November to represent summer and fall respectively. Only sites with continuous water quality monitoring data for 1986-2006 were included in the analyses. In order to validate the water quality data, water samples were randomly collected from GPS-guided sampling sites in July, 2006 and analyzed both in-situ and in the laboratory using the same standard procedures for the historic data. Because no significant differences existed, they were excluded from the final analysis. Similarly, the historical water quality data for the coastal bays were rather sporadic and thus was excluded from the final analysis.
LULC classification for the study area was done in Environment for Visualizing Images (ENVI 4.5) acquired from ITT Visual Information Solutions [25]. Bands 7, 4 and 2 were selected for supervised classification using Mahalanobis distance method after several trials. The reference group or regions of interest selection was guided by aerial photos, Google Earth and groundtruthing and personal knowledge of the study area. LULC classification system of Anderson et al., [26] was used for classification. It classifies land use-land cover into nine major categories: Urban or built up land, Crop/ Agricultural Land, Rangeland, Forest Land, Water, Wetland, Barren Land, Tundra, Perennial Snow or Ice at the level 1. However, rangeland, tundra and perennial snow land cover types are absent in the study location and were eliminated from the classification scheme. The classified images were exported into a GIS Environment ArcGIS 9.2 [27] where spatial analysis was completed. The 1986 Landsat images for rows 33 and 34 were merged and each sub watershed was masked and extracted. Areas of various land use in each watershed were quantified by multiplying the number of pixels for each land use by the spatial resolution (30 m × 30 m) of the Landsat images from which the LULC data was derived. Land use changes at 10-year intervals (1986-1996 and 1996-2006), and 20-year interval (1986-2006) were derived by overlaying the respective LULC maps for each interval. The overall change map was produced by overlaying the LULC map of the end of the study period (2006) over the initial map of 1986.
The Kruskal-Wallis one-way non-parametric analysis of variance test and the post hoc paired was employed to evaluate the how significant the land use/cover changed between each time intervals for the same area.
4. Results and Discussions
4.1. Land Use-Land Cover Dynamics
Figure 2 shows the general trends in extent of the major land use/cover in two decades. Whereas there were increasing trend with respect to the extent of urban lands, forest lands and surface water cover, barren lands, wetlands and croplands deceased during the 20-year study period.
The land use/cover of the study site in 1986, 2006 and the aggregate change during the period are shown in Figures 3(a)-(c) respectively; the latter was derived from map algebra techniques in Arc-GIS. During this period, forestlands and area covered by water increased by 8.5% and 10% respectively, while urban land increase by 121.8%. However, there was a net loss of agricultural lands (19.6%), wetlands (21.3%) and barren lands (51.3%) within the same period.
All the sub watersheds in the study area experienced an increase in urban land use between 1986 and 2006 (Table 1) except the narrow coastal bays bordering the Atlantic Ocean and consisting of basically water (99.6%) and beaches (0.2%). The largest net gain in urban land occurred in the Lower Wicomico sub-watershed. Urban land increased by 18.26 km2 in the Lower Wicomico River sub watershed during the study period (11.37%).
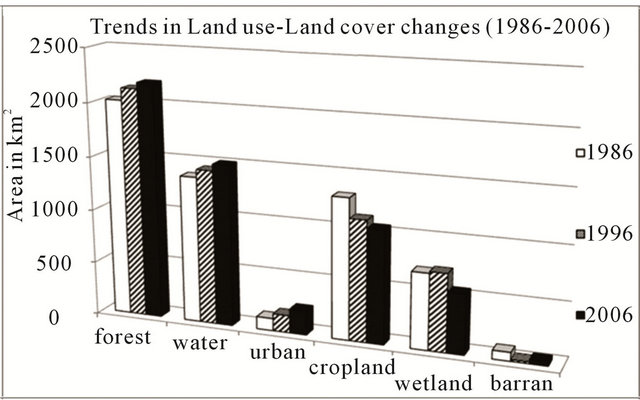
Figure 2. Trends in land use-land cover changes from 1986- 2006.
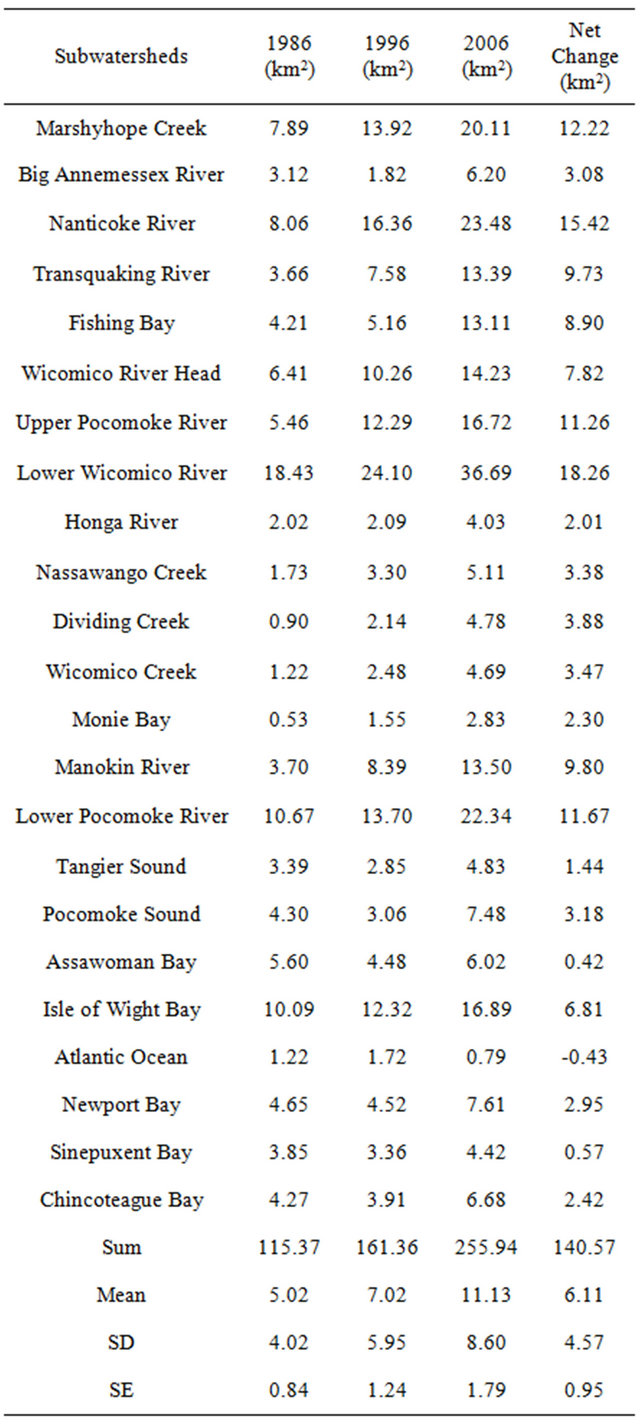
Table 1. Changes in urban land in the lower eastern shore sub-watersheds (1986-2006).
Using the Kruskal-Wallis test and the post hoc paired comparisons, the lower Eastern Shore sub watersheds increased significantly (p < 0.05, H = 9.87, n = 23) in urban land area between 1986 and 2006 after a total of 227.29 km2 of other land uses were converted to urban lands. However, changes between 1986-1996 and 1996- 2006 intervals were not significant.
Most of the gains in urban land (56% or 127.20 km2) occurred on agricultural lands with the greatest change
 (a)
(a) (b)
(b) (c)
(c)
Figure 3. (a) Land use/cover of Maryland eastern shore sub-watersheds 1986; (b) Land use/cover of Maryland eastern shore sub-watersheds 2006; (c) Land use change in Maryland eastern shore sub-watersheds (1986-2006).
occurring in the Lower Wicomico River sub watershed (18.3 km2), Nanticoke River (13.1 km2), Upper Pocomoke River (11 km2), Marshyhope Creek (10.2 km2) and Lower Pocomoke River (10.5 km2) sub watersheds. This trend is not unexpected considering the fact that residential developments and commercial growth attendant to increasing world population growth are not only occurring in urban centers but also in previously small towns and lands previously used for agricultural purposes [28]. About 33% (75.17 km2) of urban land growth occurred on forested lands and the most significant loss to urbanization also occurred in the Lower Wicomico (8.1 km2), Marshyhope Creek (8.1 km2), Nanticoke River (8.0 km2) and Lower Pocomoke River (7.1 km2) sub watersheds. This trend is similar to that reported in 2004 [5] where a 61% increase in developed lands within the Chesapeake Bay watershed from 1990-2000 were observed and were attributed mostly to new urban development (64%) occurring on agricultural lands and grasslands, while 33% occurred on forested lands. The National Oceanic and Atmospheric Administration (NOAA) data also showed a similar trend for the lower Eastern Shore between 1996 and 2005. A total loss of approximately 12.65 km2 of wetlands to urbanization occurred, while 8.19 km2 of barren land were converted to urban lands during the 20- year study period.
The total populations of the lower Eastern Shore counties (Dorchester, Somerset, and Wicomico and Worcester counties) were approximately 155,708 in 1986, 176,905 in 1996 and 198,155 in 2006. At an average annual growth rate of 0.98%, the projected population for 2030 was 249,700 and will be double the population in 1970 [29]. Therefore, the gains in urban land can be attributed to the changes in the demography of the major cities/ towns in the sub watersheds. For example, Salisbury, in the Lower Wicomico River sub watershed has been experiencing a rapid growth in housing development due to increase in population from approximately 16,850 in 1986 to 27,172 in 2006—a 61% increase (Maryland Department of Planning, 2006). Such growth in urban lands create impervious surfaces and thus reduce infiltration, and increase nutrient, sediment and other pollutant loadings into the aquatic ecosystems which lowers quality of the surface waters [30-32]. Urbanization in Marshyhope Creek (12.22 km2) can be attributed to population growth in Federalsburg and Hurlock while population growth in towns such as Hebron, Vienna, Mardela Springs and Sharptown is responsible for the 15.42 km2 increase in urban land use observed in Nanticoke River sub watershed. Population growth in Pocomoke City and Snow Hill are mainly responsible for the 11.67 km2 increase in urban land use in Lower Pocomoke River sub watershed. A combined urban land gain of 7.23 km2 in Isle of Wight and Assawoman Bay is due to population growth in Ocean City—a popular tourist city in the Eastern Shore of Maryland.
There was a net loss of about 256.16 km2 (19.6%) of cropland land in the lower Eastern Shore sub watersheds between 1986 and 2006 in general. The largest net loss of agricultural lands occurred in the Lower Wicomico River sub watershed (Table 2). In this sub watershed, Agricultural land decreased from 108.62 to 74.92 km2 from 1986-2006. However, there were no significant differences in agricultural land use between 1986 and 1996, 1996 and 2006 or 1986 and 2006 (p < 0.70, H = 0.83, n = 23). This finding was corroborated with the Census of Agriculture conducted by the United States Department of Agriculture every five years that showed a decline in the use of land for crop production [33]. Agricultural lands in Maryland decreased consistently over the years from 686,964 ha in 1987 to 553,324 ha in 2007, representing a 19.5% loss. However, the poultry industry in Maryland has been on a steady rise. Broilers and other meat-type chickens sold have increased from 257,070,110 in 1987 to 296,373,113 in 2007 (up by 13.3% between 1987 and 2007).
The greatest loss of agricultural lands occurred in the Lower Wicomico River sub watershed followed by Nanticoke River and Upper Pocomoke River sub watersheds. Agricultural lands lost 127.20 km2 to urban sprawl. A large land mass (457.31 km2) of agricultural lands was converted to forested lands during the study period. Nanticoke River (58.4 km2), Upper Pocomoke River (49.9 km2), Marshyhope Creek (42.5 km2), Lower Wicomico River (39.2 km2), Lower Pocomoke River (41.1 km2) and Transquaking River (36.2 km2) sub-watersheds experienced large changes from agricultural land to forested land. Forest lands were also lost to agriculture (301.61 km2) between 1986 and 2006 in the Lower Eastern Shore with most of those changes occurring in Marshyhope Creek (40.5 km2), Nanticoke River (40.8 km2), Upper Pocomoke River (33.3 km2)In the Lower Pocomoke River (18.3 km2) and Transquaking River (27.6 km2) subwatershed, Agricultural land to wetland change was 54.83 km2 while an approximate 21.59 km2 of agricultural land in 1986 became barren in 2006. Marshyhope Creek and Nanticoke River sub watersheds have lost 7.5 km2 and 4.6 km2 of agricultural lands respectively to barren lands. About 636.89 km2 (about 47% of agricultural lands) remained unaltered during the same period especially in the Upper Pocomoke River (109.3 km2) and the Nanticoke River sub
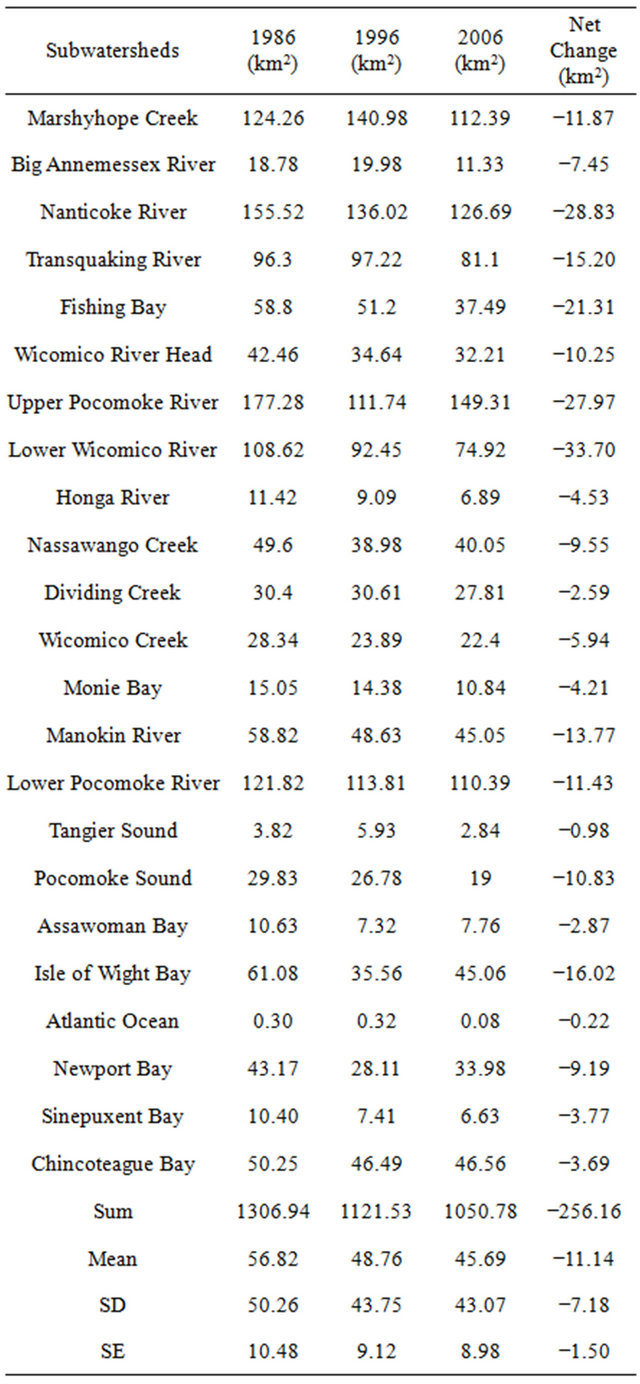
Table 2. Changes in agricultural lands in the lower eastern shore sub-watersheds (1986-2006).
watersheds (75.2 km2). While a total of 250.16 km2 agricultural land was lost to other land uses during the study period, an average of 11.14 ± 1.50 km2 were lost per sub watershed.
Very substantial areas of forest lands (1447.29 km2 or 71%) remained unaltered between 1986 and 2006 for Lower Pocomoke River, Upper Pocomoke River, Nanticoke River, Fishing Bay and Marshyhope Creek. However, whereas forest land occupied 2022.6 km2 in 1986, only 2193.9 km2 remained in 2006 (Figure 4), with a net

Figure 4. Forest land change in Maryland eastern shore (1986-2006).
gain of 171.27 km2 (8.5%) during the 20-year period. The recent U.S Census of Agriculture [32] reported increase in woodlands and pastures in Maryland in general. However, this change was not significant between alltime intervals investigated (p < 0.90, H = 0.28, n = 23). Although forested lands increased in most sub-watersheds, Marshyhope Creek actually experienced a net loss of 8. This result is corroborated by the NOAA land useland cover data which also showed an increase in forested lands for the Lower Eastern Shore between 1996 and 2005 [7]. Increase in forested land in the Lower Eastern Shore can be attributed to natural forest regrowth and Maryland Forest Conservation Act enacted in 1991. This Act stipulates that, “gaining approval of the required Forest Conservation Plan (development of more than one acre) may require long term protection of included priority areas or planting/replanting (afforestation or reforestation) a sensitive area off-site” [34]. The largest net gain in forest land (21.07 km2) during the study period was in the Lower Wicomico sub watershed. Gains in forest land from other land uses decreased in the following order: Agricultural land to forest (457.31 km2), wetland to forest (204.45 km2), urban to forest (38.48 km2), water to forest (27.53 km2) and barren land to forest (19.38 km2).
There was a net gain of about 135.89 km2 (10%) of areas covered by water in the lower Eastern Shore sub watersheds between 1986 and 2006 (Figure 5). During the study period, however, 154.61 km2 of wetlands became inundated. Most of this inundation occurred in Fishing Bay (55.77 km2) situated at the edge of Chesapeake Bay in Dorchester county. Conversely, only 31.44 km2 of water covered areas in 1986 became wetlands in 2006 with Fishing Bay also experiencing the most change of 6.4 km2. Some forested lands (32.2 km2) were also inundated by water during the study period, while 9.6 km2 of agricultural lands also became inundated with water. About 6.6 km2 of urban lands similarly became inundated by water while a total change from barren land to water in the lower Eastern Shore was 1.63 km2 during the study period. The increase in water cover in the Lower Eastern Shore of Maryland is due in part to sealevel rise-perhaps a global warming effect on the estuarine tributaries of the Chesapeake Bay which empties into the Atlantic Ocean. This rise is indicated by the decrease in the extent of wetlands and salt marshes (by 22%) through submergence, and barren land (which decreased by 2%) during the study period. Hilbert [35] reported a similar trend in the Grand Bay National Estuarine Research Reserve area of Mississippi in the Northern coast of Gulf of Mexico from 1974 to 2001.
Loss of wetlands was observed in 17 out of the 23 sub watersheds in the study area (Table 3). In general, there was a 23% net loss (150.02 km2) of wetlands from 1986-2006 in the study area. But these losses were not significant (p < 0.50, H = 1.80, n = 23) for the periods between 1986-1996, 1996-2006 or 1986-2006. Similar results were observed in NOAA land use-land cover data
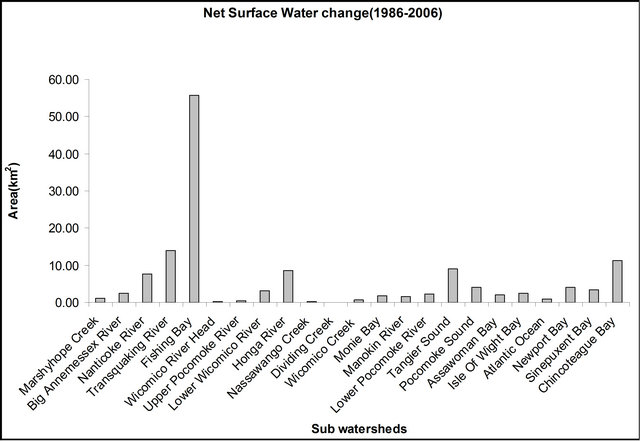
Figure 5. Net surface water cover in Maryland eastern shore sub-watersheds (1986-2006).
which also showed loss of wetlands for the lower Eastern Shore between 1996 and 2005 [7]. The vital ecological functions of wetlands—such as water quality improvement/preservation, fish and wildlife habitats, reduction of flood damage, shoreline erosion protection etc., make their decline of great ecological concern. The Congaree Bottomland Hardwood Swamp in South Carolina was estimated to remove pollutants equivalent to that removed annually by a $5 million waste water treatment plant [18]. The decreasing extent of wetlands in the lower Eastern Shore has the potential to compromise several ecological services.
Our results also indicate that during the study period, 154.61 km2 of wetlands became covered by water. Most of this wetland inundation by water (55.77 km2 representing 41%) occurred in Fishing Bay where the largest net loss of 53.16 km2 (35%) of wetlands occurred. Nutria (Myocastor coypus) has been a primary force in accelerating wetland loss in the Black Water basin—where Fishing Bay is located—as well as other sub watersheds in Maryland. Nutria feed on marsh vegetation, expose the mud and thereby predispose marshes to erosion. Consequently, the marsh surface sinks and the vegetation is lost to flooding. Large area of marsh lands in the Black Water National Wildlife Refuge (BNWR) within the same watershed have been reported lost to Nutria [36]. Although, this destructive rodent has been eradicated from BNWR [37], 53% of the remaining marshes in BNWR is considered unhealthy and is likely to be lost in the future [35]. It is obvious therefore that the activities of these nonnative rodent species on the wetlands may have contributed in part to the decreasing wetlands and increasing extent of water cover in the lower eastern shore of Maryland. Reciprocally, only 31.44 km2 of areas covered by water in 1986 have become wetlands in 2006 with Fishing Bay also experiencing the most change of 6.4 km2. This indicates, fluctuations between areas covered by water and wetland in Fishing Bay but with more wetlands becoming flooded. Of the 704.25 km2 of wetlands in 1986, only 299.56 km2 of wetlands (which represents about 43%) have remained unaltered between 1986 and 2006 especially in Fishing Bay (79.3 km2), Nanticoke River (35.4 km2), Honga River (29.6 km2) and Manokin River (25.9 km2) sub watersheds. Approximately 204.45 km2 of wetlands became forested between 1986 and 2006. Most of this change has occurred in the Lower Pocomoke River (25 km2), Manokin River (23.7 km2) watersheds as well as Fishing Bay (21.6 km2). A total of 34.09 km2 of wetlands was lost to agricultural land use in the study region between 1986 and 2006. Small areas of wetlands also changed to agricultural land in the Lower Pocomoke River (5.4 km2), Manokin River (3.4 km2) and Fishing Bay (3.0 km2). About 12.65 km2 of wetlands became urbanized in 2006.
There was a decrease in barren lands (51.3%) in all the sub watersheds (Table 4) except for Marshyhope Creek (with a net gain of 2.22 km2), and Sinepuxent Bay (1.05 km2) while Assawoman Bay experienced no net gain.
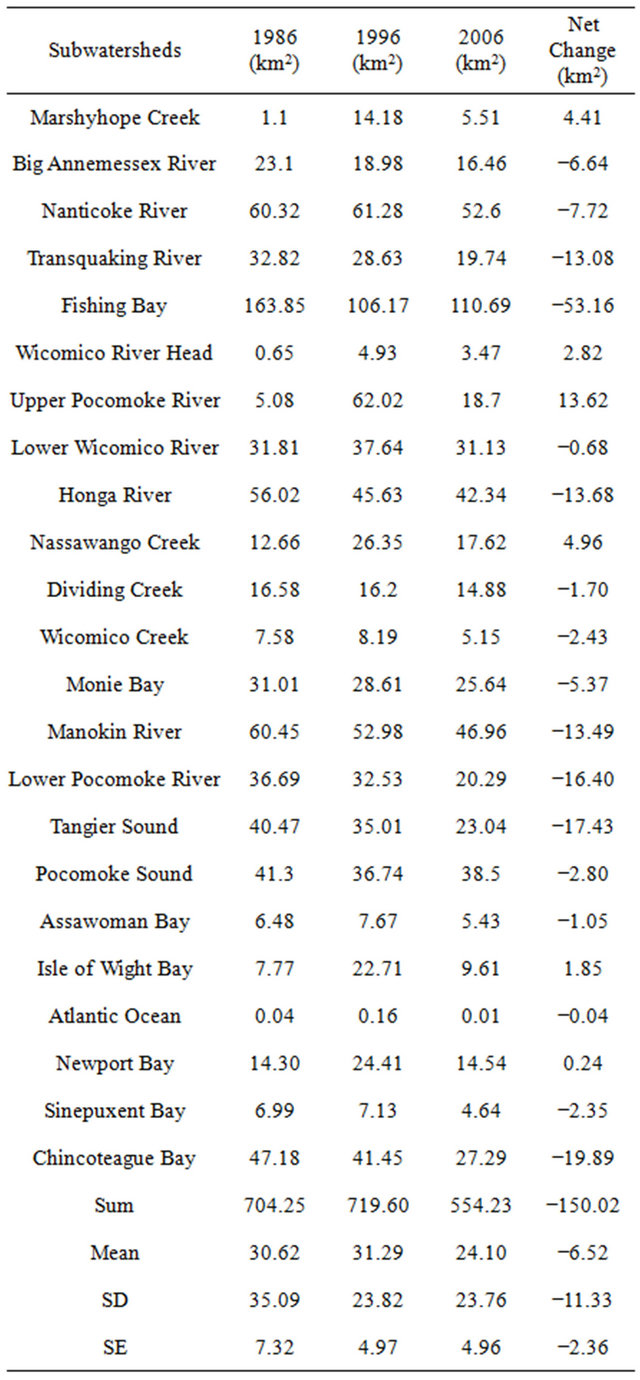
Table 3. Changes in wetlands in the lower eastern shore sub-watersheds (1986-2006).
Barren lands, which are mainly beaches in Assawoman Bay and Isle of Wight Bay where Ocean City (a popular tourist city) is located have experienced increase in water covered areas by 2.07 km2 in Assawoman Bay and 2.56 km2 in Isle of Wight Bay. This may be due to the rising sea level-a trend which has also been reported by Hilbert [34] in the Grand Bay National Estuarine Research Reserve area of Mississippi in the Northern coast of Gulf of Mexico from 1974-2001. The lower Eastern Shore sub watersheds recorded a significant net loss of about 41.55
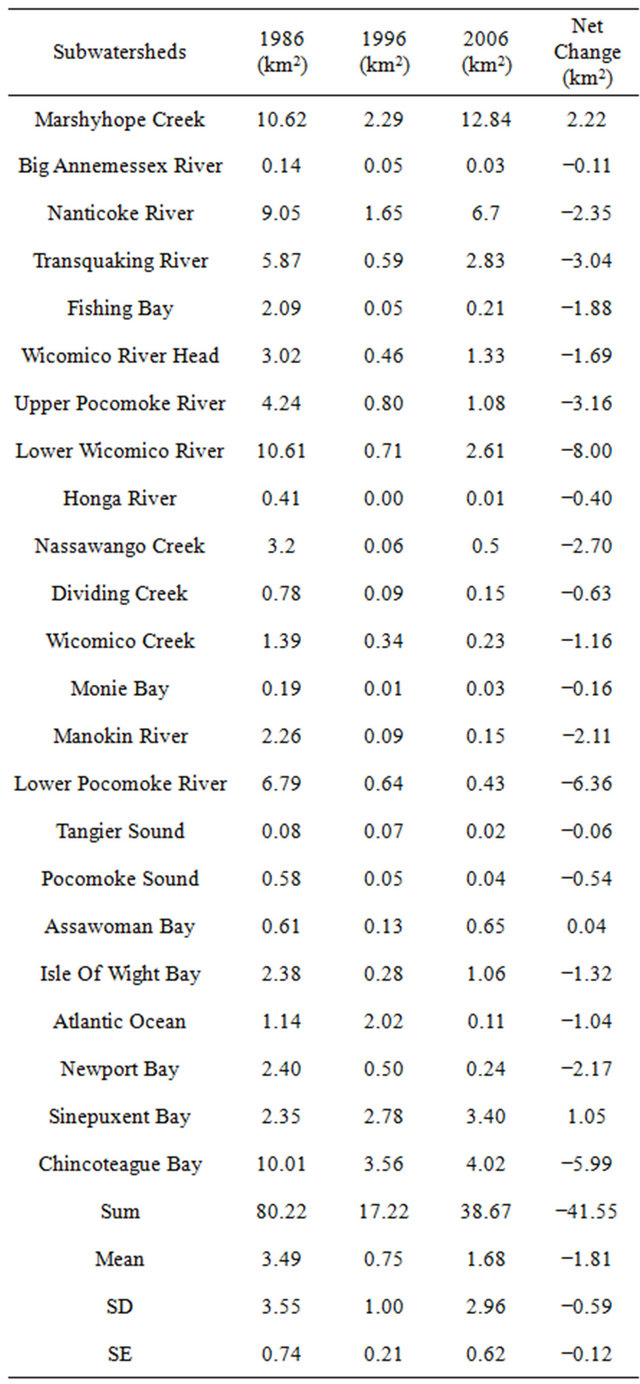
Table 4. Changes in barren lands in the lower eastern shore sub-watersheds (1986-2006).
km2 of barren lands between 1986 and 2006 (p < 0.05, H = 13.28, n = 23). Barren land significantly (p < 0.05) decreased from 80.22 km2 in 1986 to 17.22 km2 in 1996; however, changes between 1996 and 2006 was not significant.
About 43.20 km2 of barren land was converted to agricultural land while 8.19 km2 of barren land became urbanized. As of 2006, approximately 19.38 km2 of barren lands became forested within the 20-year period, with the largest changes occurring in the Lower Wicomico River (2.7 km2), Marshyhope Creek (2.4 km2) and Nanticoke River (2.0 km2) sub watersheds. Only 6.68 km2 of barren land remained unaltered especially in the Marshyhope Creek (1.6 km2).
4.2. Land Use and Water Quality and Nutrient Loading
A stepwise regression analysis of the land use and water quality/nutrient variables and the resulting correlation matrix is shown in Table 5. A significantly positive correlations was observed between forest land cover and agricultural land use (r2 = 0.95); urban land use and forest land cover (r2 = 0.72); Total N and Total P levels (r2 = 0.68). However, significantly negative correlation was observed between Secchi depth (SECCHI) and Total P; as well as the latter and total suspended solids (TSS). No significant correlations were observed between the other combinations of variables evaluated. Land use-land cover, wastewater treatment plants sewage load, water quality and climatic data were combined and used to develop regression models. However, none was possible for Total N-obviously because of the ubiquitous nature of N in the environment.
We observed a significant (p < 0.05) decrease in Total Phosphorus (TP) concentration for the water systems during the period investigated (Figure 6) ranged from to 0.093 mg/l in 1986 to 0.044 mg/l in 2006. Howeversome location variations were observed e.g., the Lower Pocomoke River and the Nanticoke River recorded the highest mean TP of 0.121 ± 0.100 mg/l and 0.083 ± 0.05 mg/l respectively. These surface waters are within watersheds made up of 24.5% and 27% agricultural lands respectively; consequently the crop fields may have been contributing substantially to the phosphorus loading of the water systems-particularly where conventional cropping methods involving inorganic fertilizers or poultry manure are used, coupled with sewage discharge to Nanticoke River and Lower Pocomoke River from Sharptown and Snowhill wastewater treatment plants. Lower
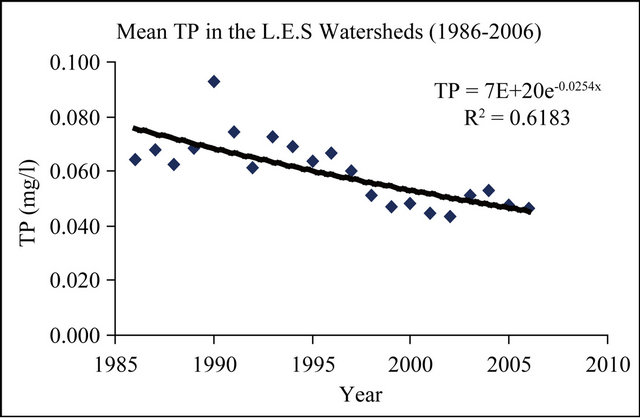
Figure 6. Mean total phosphorus of Maryland eastern shore surface waters (1986-2006).

Table 5. Pearson correlation of log-transformed data.
levels of TP at Tangier Sound and Monie Bay sites also correlated with small areas of agricultural lands.
Urban lands increased at the expense of agricultural lands and barren lands which decreased by 9.7% and 10.2% respectively from 1986-2006. Increasing urban lands increases the extent of impervious surfaces from buildings, roads and runoff that are known to accelerate nutrients, sediments and chemical loadings into the aquatic systems [30,31]. However, an analysis of the water quality monitoring data from several stations in the stream networks did not adequately support this trend as the total phosphorus decreased generally during the same period.
On the other hand, decrease in agricultural lands and phosphorus input through point sources (Waste Treatment plants) during the same period may have influenced the general trends observed-perhaps as a result of better compliance to the National Pollutant Discharge Elimination System (NPDES) rules (for point source) in the last two decades; or more efficient use of fertilizers and soil conditioners (from non-point source).
Total Nitrogen (TN) levels varied within a narrow range during the 20-year study period, (1.00 - 1.71 mg/l). In general, no discernible trends were observed for Nitrogen levels in the surface waters as can be seen in Figure 7. On the other hand, point source discharge of nitrogen from the waste treatment plant increased significantly during the period (Figure 8). The increase is due to the steady growth in population and thus more waste being produced and processed by the various treatment plants in the area. For specific sampling sites however, some differences were observed. For example, Nanticoke River and the Lower Pocomoke River sub-watersheds had the highest TN with mean N of 3.218 ± 1.2 mg/l and 1.912 ± 0.7 mg/l respectively. TN increased significantly (p < 0.05) at the Nanticoke River, while a decrease was observed at the Lower Pocomoke River. Agricultural land decreased by 6% in Nanticoke River and decreased by 2% in Lower Pocomoke River sub watershed, but there was a substantial increase in croplands (24.5% and 27.0% respectively) in 2006.
Increased nutrient availability in surface water systems due to anthropogenic causes could lead to eutrophication and increase in chlorophyll-a levels in coastal waters resulting from increased phytoplankton biomass. Chlorophyll-a level provides a useful proxy indicator of the amount of nutrients incorporated into phytoplankton biomass.
Dissolved Oxygen (DO) affects aquatic life [22]. In this study, DO levels showed a significant decrease from 1986-2006 in general (Figure 9). However, there were site variations such as the Lower Wicomico River watershed where increases in urban population resulted in increased nutrient loading rates from Salisbury, Fruitland
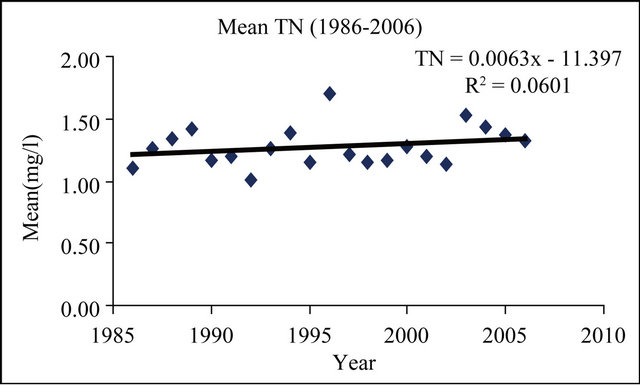
Figure 7. Mean total N in maryland eastern shore surface water (1986-2012).
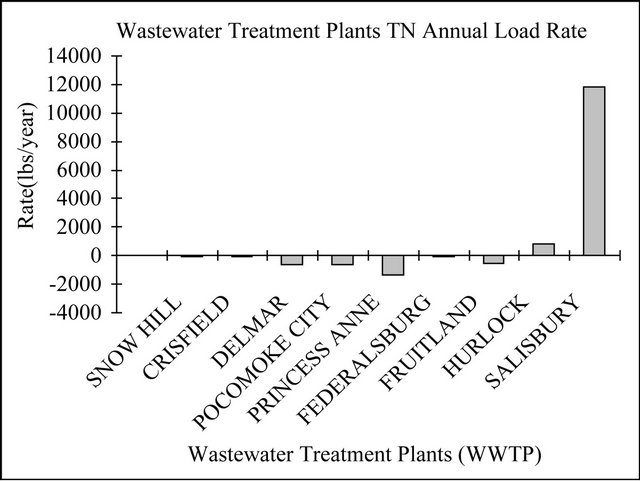
Figure 8. Mean annual nitrogen loading from wastewater treatment plants.
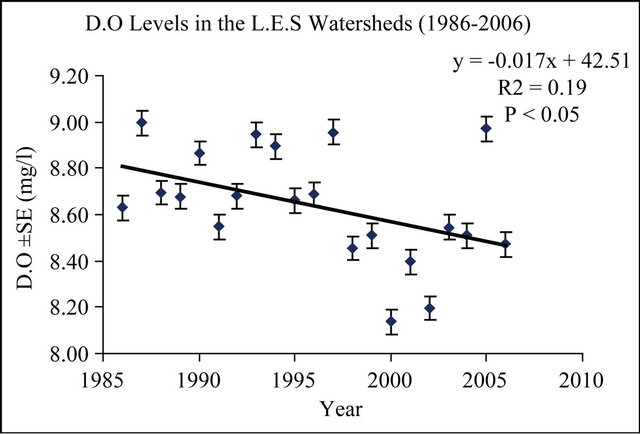
Figure 9. Dissolved oxygen levels in the lower eastern shore watersheds (1986-2006).
and Delmar wastewater treatment plants that empty into the Wicomico River and thus low DO levels during the period into the water system. On the other hand, the Annemessex River, Fishing bay and Monie bay had relatively higher DO due to fewer wastewater discharge into their surface water systems. The mean annual TP discharged into surface water was highest (44379.4 kg/year) at the Salisbury WWTP; however there was a decrease in the rate of TP discharged into the Wicomico River (475 kg/year) from Salisbury WWTP during the study period. TP decreased from an average of 19,727 kg/year in 1986 to 8835 kg/year in 1992 and remained stable from 1993 to 2006. Other WWTP with significant (p < 0.05, n = 20) decreasing TP load rates are Crisfield, Delmar, Princess Anne and Federalsburg. TP loading rates have however been increasing significant (p < 0.05) at Hurlock (197 kg/year).
5. Conclusions
Urban land increased followed by surface water and forest lands in the Lower Eastern Shore watersheds from 1986-2006. However, there were net losses of crop/agricultural lands, wetlands and barren lands during the two decades of this study. Most of the urban land gain occurred on crop/agricultural land while a third occurred on forested land. The largest gains in urban land as well as loss of crop/agricultural, forest and barren lands occurred in Lower Wicomico River sub-watershed. Net area covered by water increased by 135.9 km2 from 1986-2006 for all sub watersheds and 154.61 km2 of wetlands was inundated or covered by water. Most of such coverage (41%) occurred in Fishing Bay, in Dorchester County, and was attributed to the rising sea level as these tributaries of the Chesapeake Bay empties into the Atlantic Ocean. 17 out of 23 sub watersheds in the lower Eastern Shore experienced decreased wetlands areas from 1986- 2006. The net area of wetlands lost was 150 km2 especially in Fishing Bay (35%) and threatens the Blackwater National Wildlife Refuge (BNWR) located there. This signals change in the coastal ecology attributable in part to global climate change and the consequent sea level rise as well as wetland subsidence due to the destructive feeding activities of Myocastor coypu (Nutria)-a nonnative rodent species which feeds on marsh vegetation. Declining wetlands have serious ecological implications with respect to the various ecological services it provides: notably habitat loss for shellfish and waterfowls, flood buffer and wastes filter. It is also envisaged that the change in salinity of the brackish water would have major implications on the biota and could affect the biodiversity of the wetlands and surface water alike. Excessive concentration of P is the most common cause of eutrophication in freshwater lakes, reservoirs, streams and in headwaters of estuarine systems [37]. However, in this study, both Nitrogen and Phosphorus did not show a similar trend-despite the enormous nutrient loading from the wastewater treatment plants in the sub-watersheds. Whereas Phosphorus trend for the study location showed a decrease during the period, the trend was mostly attributable to the declining crop/agricultural land use-rather than the decrease in P loading from wastewater treatment plants. Obviously, the increase in urban land use and the resultant increase in impervious surface area and runoff may have contributed other pollutants rather than P. Although there were no discernible trends in TN in general, the Lower Wicomico River which receives very heavy N load annually from three wastewater treatment plants (Delmar, Fruitland and Salisbury) showed a generally increasing trend-albeit local. This result is supported by a Hawaiian coastal waters study [21] where the discharge of effluent from two wastewater treatment plants did not significantly impact water quality parameters outside the zone of initial dilution. The Lower Wicomico River also received the highest Phosphorus load-though with a declining trend like other; this may probably reflect more compliance to National Pollutant Discharge Elimination System (NPDES) rules over the years. This site is apparently being impacted by both urban land use and waste treatment plant discharge resulting from the growing human population (particularly, Salisbury) in the watershed. There was also a general decrease in the dissolved oxygen levels in the surface waters during the period due to increasing Nitrogen load from several wastewater treatment plants in the area with implications for eutrophication.
The geospatial technology employed in this work has demonstrated the versatility of GIS/Remote sensing for quantifying past changes in land use/cover with respect to identifying precisely where changes occurred (Change detections) in the use of the lands that can guide urban and regional planners. Furthermore, these techniques have revealed the gradual effect of the climate change in the rising sea-level. However, it is suggested that a comprehensive historical land use/land cover be done every decade in order to detect significant changes as was observed in this study. Furthermore, developing nations are encouraged to take advantage of the remotely sensed Landsat data-which exist for the entire world for analyzing past and present trends in land use and cover for improving environmental and urban planning in general.
REFERENCES
- J. K. Berry, “Map Analysis: Understanding Spatial Patterns and Relationships,” 2007. http://www.innovativegis.com/basis/MapAnalysis
- V. H. Dale, S. Brown, R. Haeuber, N. T. Hobbs, N. Huntly, R. J. Naiman, W. E. Riebsame, M. G. Turner and T. Valone, “Ecological Principles and Guidelines for Managing the Use of Land,” Ecological Applications, Vol. 10, No. 3, 2000, pp. 639-670.
- S. E. Gergel, M. G. Turner, J. R. Miller, J. M. Melack and E. H. Stanley, “Landscape Indicators of Human Impacts to Riverine Systems,” Aquatic Science, Vol. 64, No. 2, 2002, pp. 118-128. doi:10.1007/s00027-002-8060-2
- M. A. Palmer, G. E. Moglen, N. E. Bockstael, S. Brooks, J. E. Pizuto, C. Wiegand and K. Van Ness, “The Ecological Consequences of Changing Land Use for Running Waters, with a Case Study of Urbanizing Watersheds in Maryland,” Human Population and Freshwater Resources, Yale University Press, New Haven, 2002, pp. 85-113.
- P. Jantz, S. Goetz and C. A. Jantz, “Urbanization and the Loss of Resource Lands within the Chesapeake Bay Watershed,” Environmental Management, Vol. 36, No. 6, 2004, pp. 808-825. doi:10.1007/s00267-004-0315-3
- D. M. Boward, P. F. Kazyak, S. A. Stranko, M. K. Hurd and T. P. Prochaska (US Environmental Protection Agency) “From the Mountains to the Sea: The State of Maryland’s Freshwater Streams,” EPA Report 903-R-99-023, Maryland Department of Natural Resources, Annapolis, 1999, 64 p.
- National Oceanic and Atmospheric Administration, “Coastal Services Centre,” Land Cover Analysis: Northeast Land Cover, 2007. http://www.csc.noaa.gov/crs/lca/northeast.html
- MRCC, “Multi-Resolution Land Characteristics Consortium,” National Land Cover Database, 2008. http://www.mrlc.gov/index.php
- US Environmental Protection Agency, Office of Wastewater Management, “National Water Quality Inventory: Report to Congress,” Reporting Cycle, EPA 841-R-08-00, 2004.
- US Environmental Protection Agency, “Clean Water Act, Major Environmental Laws,” 2002. http://www.epa.gov/region5/water/pdf/ecwa.pdf
- M. A. Palmer, G. E. Moglen, N. E. Bockstael, S. Brooks, J. E. Pizzuto, C. Wiegand and K. Van Ness, “The Ecological Consequences of Changing Land Use for Running Waters: The Suburban Maryland Case,” Yale Bulletin of Environmental Science, Vol. 107, 2002, pp. 85-113.
- P. Basnyat, L. D. Teeter, K. M. Fynn and B. G. Lockaby, “Relationships between Landscape Characteristics and No-Point Inputs to Coastal Estuaries,” Environmental Management, Vol. 23, No. 4, 1999, pp. 539-549. doi:10.1007/s002679900208
- J. S. Harding, E. F. Benfield, P. V. Bolstad, G. S. Helfman and E. B. D. Jones, “Stream Biodiversity: The Ghost of Land Use Past,” Proceedings of the National Academy of Sciences of the USA, Vol. 95, No. 25, 1998, pp. 14834- 14847. doi:10.1073/pnas.95.25.14843
- N. E. Roth, J. D. Allan and D. E. Ericson, “Landscape Influences on Stream Biotic Integrity Assessed at Multiple Spatial Scales,” Landscape Ecology, Vol. 11, No. 3, 1996, pp. 141-156. doi:10.1007/BF02447513
- J. Omernik, A. Abernathy and L. Male, “Stream Nutrient Levels and Proximity of Agricultural and Forest Land to Streams: Some Relationships,” Journal of Soil and Water Conservation, Vol. 36, No. 4, 1981, pp. 227-231.
- L. Osborne and M. Wiley, “Empirical Relationships between Land Use/Cover Patterns and Stream Water Quality in an Agricultural Catchment,” Journal of Environmental Management, Vol. 26, 1988, pp. 9-27.
- J. Karr and I. Schlosser, “Water Resources and the LandWater Interface,” Science, Vol. 201, No. 4352, 1978, pp. 229-234. doi:10.1126/science.201.4352.229
- US Environmental Protection Agency, “Watersheds Academy: Wetland Functions and Values,” 2008. http://www.epa.gov/watertrain/wetlands/index.htm
- S. R. Carpenter, N. F. Caraco, D. L. Correll, R. W. Howarth, A. N. Sharpley and V. H. Smith, “Nonpoint Pollution of Surface Waters with Phosphorus and Nitrogen,” Ecological Applications, Vol. 8, No. 3, 1998, pp. 559-568. doi:10.1890/1051-0761(1998)008[0559:NPOSWW]2.0.CO;2
- N. E. Detenbeck, C. M. Elonen, D. L. Taylor, L. E. Anderson, T. M. Jicha and S. L. Batterman, “Region, Landscape and Scaleeffects on Lake Superior Tributary Water Quality,” Journal of the American Water Resources Association, Vol. 40, No. 3, 2004, pp. 705-720. doi:10.1111/j.1752-1688.2004.tb04454.x
- R. Parnell, “The Effects of Sewage Discharge on Water Quality and Phytoplankton of Hawaiian Coastal Waters,” Marine Environmental Research, Vol. 55, No. 4, 2002, pp. 293-311. doi:10.1016/S0141-1136(02)00275-1
- M. S. Adam, J. L. Stauber, M. E. Binet, R. Molloy and D. Gregory, “Toxicity of a Secondary-Treated Sewage Effluent to Marine Biota in Bass Strait, Australia: Development of Action Trigger Values for a Toxicity Monitoring Program,” Marine Pollution Bulletin, Vol. 57, No. 6-12, 2008, pp. 587-598.
- US Environmental Protection Agency, “Surf Your Watershed,” 2009. http://cfpub.epa.gov/surf/locate/hucperstate_search.cfm?statepostal=MD
- US Environmental Protection Agency, “Chesapeake Bay Program,” Historic Water Quality Data, Annapolis, 2007.
- ITTVIS, “Environment for Visualizing Images,” ENVI, 2008.
- J. R. Anderson, E. E. Hardy, J. T. Roach and R. T. Witmer, “A Land Use and Land Cover Classification System for Use with the Remote Sensor Data,” Geological Survey Professional Paper 964. A Revision of the Land Use Classification System as Presented in US Geological Survey Circular, 1976, p. 671.
- Environmental Systems Research Institute, ArcGIS9.2, Redlands, 2007.
- T. N. Carlson and S. T. Arthur, “The Impact of Land UseLand Cover Changes Due to Urbanization on Surface Microclimate and Hydrology: A Satellite Perspective,” Global and Planetary Change, Vol. 25, No. 1-2, 2000, pp. 49-65. doi:10.1016/S0921-8181(00)00021-7
- Maryland Department of Planning, “Historical and Projected Total Population for Maryland’s Jurisdictions,” Planning Data Services, 2006. http://www.mdp.state.md.us/msdc/popproj/TOTPOP_PROJ06.pdf
- Z. Tang, B. A. Engel, B. C. Pijanowski and K. J. Lim, “Forecasting Land Use Change and Its Environmental Impact at a Watershed Scale,” Journal of Environmental Management, Vol. 76, No. 1, 2005, pp. 35-45. doi:10.1016/j.jenvman.2005.01.006
- M. A. Mallin, S. H. Ensign, M. R. McIver, G. C. Shank, and P. K. Fowler, “Demographic, Landscape, and Meteorological Factors Controlling the Microbial Pollution of Coastal Waters,” Hydrobiologia, Vol. 460, No. 1-3, 2001, pp. 185-193. doi:10.1023/A:1013169401211
- M. A. Van Buren, W. E. Watt, J. Marsalek and B. Anderson, “Thermal Enhancement of Storm Water Runoff by Paved Surfaces,” Water Research, Vol. 34, No. 4, 2000, pp. 1359-1371. doi:10.1016/S0043-1354(99)00244-4
- United States Department of Agriculture, 2009. http://www.agcensus.usda.gov./Publications/2007/Full_Report/Volume_1,_Chapter_1_State_Level/Maryland/st24_1_001_001.pdf
- Maryland Department of Natural Resources, “Forest Service: Urban and Community Forestry,” Forest Conservation Act, 1995. http://www.dnr.state.md.us/forests/programapps/newFCA.asp
- W. K. Hilbert, “Land Cover Change within the Grand Bay National Estuarine Research Reserve: 1974-2001,” Journal of Coastal Research, Vol. 22, No. 6, 2006, pp. 1552- 1557. doi:10.2112/05-0582.1
- US Fish and Wildlife Service, “Blackwater National Wildlife Refuge: Nutria and Blackwater Refuge,” 2009. http://www.fws.gov/blackwater/nutriafact.html#damage
- D. I. Correli, “Phosphorus: A Rate Limiting Nutrient in Surface Waters,” Poultry Science, Vol. 78, No. 5, 1998, pp. 674-682.