Natural Science
Vol.4 No.2(2012), Article ID:17325,4 pages DOI:10.4236/ns.2012.42016
Adsorption of yellow dye: Acid yellow RR from its aqueous solution using two different samples of activated carbon by static batch method
![]()
University Institute of Fashion Technology, Panjab University, Chandigarh, India; kaushikrita@rocketmail.com
Received 11 December 2011; revised 10 January 2012; accepted 28 January 2012
Keywords: Adsorption; Acid Yellow RR; Activated Carbon; Textile Industry Effluent
ABSTRACT
Removal of dye Acid Yellow RR, using two different samples of activated carbon by static batch method was studied. Experimental data on optical density of blank solutions of different concentrations ranging from 10 to 100 mg/L and optical density of solutions after adsorption on activated carbon samples were taken and analyzed. Calibration curves were plotted and the amount of dye qe adsorbed was calculated. The data was fitted to Polynomial, Langmuir and Freundlich isotherms for two different carbon samples and different concentration and pH values. Constants were calculated from the slope and intercept values of the isotherms. Coefficient of correlation R2 and Standard Deviation SD were also noted. The data fitted well to the isotherms. Carbon sample C1 showed higher potential to adsorb the yellow dye. Adsorption was higher at lower concentrations of the solution. Carbon sample C2 showed better adsorption in acidic pH as compared to in alkaline pH. From the analysis of the data it is shown that C2 sample has a good capacity to remove the textile dye from the residue water although sample C1 was still better.
1. INTRODUCTION
Color is the main attraction of any fabric. As far back as in 3500 B.C. natural dyes extracted from vegetables, fruits, flowers, certain insects and fish were being used to dye fabric. With the discovery of synthetic dyes by W H Perkins in 1856 use of synthetic dyes gave way to natural dyes that gave a limited and dull range of colors that had lower fastness to light and washing [1]. More than 3600 individual textile dyes are being manufactured by the industry today. Large quantities of water are required in the industry for textile processing, dyeing and printing. The daily water consumption of an average sized textile mill having a production of about 8000 Kg of fabric per day is about 1.6 million liters. Dyeing section contributes to 15% - 20% of the total waste water flow [2]. The entire waste water may contain elements like sulphur, naphthol, vat dyes, nitrates, acetic acid, soaps, chromium compounds and heavy metals like copper, arsenic, lead, cadmium, mercury, nickel, and cobalt and certain auxiliary chemicals all of which collectively make the effluent highly toxic [3] Other harmful chemicals present in the water may be formaldehyde based dye fixing agents, chlorinated stain removers, hydro carbon based softeners and non bio degradable dyeing chemicals. All these organic materials are of great concern in water treatment because they react with many disinfectants to form by products (DBP’S) that are often carcinogenic and therefore undesirable. Many of these show allergic reactions. The colloidal matter present along with colors and oily scum increases the turbidity, gives the water a bad appearance, and prevents photosynthesis [4]. Depletion of dissolved Oxygen in water adversely effects marine life. In addition when this effluent is allowed to flow in the fields it clogs the pores of the soil resulting in loss of soil productivity. If allowed to flow in drains and rivers it effects the quality of drinking water in hand pumps making it unfit for human consumption. Such polluted water can also be a breeding ground for bacteria and viruses.
Geetha A., Siva Kumar P., Sujatha M., Palanisamy P.N. and Somasundaram T. [5] studied the adsorption of dye Acid Blue from an aqueous solution onto activated areca nut shell carbon using batch adsorption method. Adsorption kinetics, equilibrium and thermodynamics were investigated as a function of initial dye concentration, temperature and pH. Kinetic studies indicated that the adsorption followed Elovich model. The equilibrium data were analyzed using Langmuir and Freundlich isotherm models. The adsorption capacity of ANSC was found to be increasing with increase in temperature. Based on regression coefficient, the equilibrium data found fitted well to Freundlich model. Thermodynamics parameters such as ∆G0, ∆H0, ∆S0 for adsorption were evaluated. The thermo dynamics of Acid Blue-ANSC system indicated endothermic nature of the process. It is found that the areca nut shell activated carbon is effective for the removal of Acid Blue from aqueous solution.
The adsorption capacity of riverbed sand, saw dust, vermiculite and soil for Cr(III) ions from tannery effluent has been investigated in detail by Sumathi K.M.S. and Mahimairaja S. [6] in order to evaluate their possible application as filter material in reed bed treatment system. The adsorption isotherm was determined alongwith the effect of contact time, initial Cr concentration and pH on the efficiency of Cr removal. It was concluded that the maximum adsorption of Cr (>90 percent) was achieved by vermiculite and soil within 24 hours. The equilibrium isotherm data for vermiculite was found to follow Freundlich and Langmuir equations and a separation factor was used to judge the favorable adsorption. Vermiculite exhibited a higher adsorption capacity followed by sand, sawdust and soil .The Cr retention capacity of adsorbents in different pH was calculated on the basis of the distribution coefficient (Kd) and the highest Kd value was achieved by vermiculite (61.1) at pH 5.0.
V.K. Rattan, Abhiti Purai, Harminder Singh, and Mahboobeh Manoochehri [7] studied the ability of Cow dung ash without any pretreatment to remove color from textile dyes N Blue RGB, Green B, and Eosin YWS from aqueous solution. Cow dung ash an eco friendly and low cost adsorbent was prepared by burning cow dung cakes in muffle furnace at 500˚C. The adsorption was achieved under different pH and adosrbate concentration. The data was fitted to simple polynomial and the isotherms similar to Langmuir and Freundlich isotherms.
2. MATERIALS AND METHOD
2.1. Adsorbate Preparation
Samples of Granular Activated Carbon C1 and C2 used were obtained from Brillex Chemical Ltd. Punjab and Industrial Carbon Pvt. Ltd., Gujarat. Surface area of GAC C1 used in the study was 950 m2/g and that of GAC C2 was 600 m2/g. Bulk density of the two was 500 - 550 and 600 - 1000 g/L respectively. The ash content was 6% in C1 and 5% in C2.
A stock solution of the dye with a concentration of 1000ppm was prepared and dilutions were made with distilled water to make different concentrations. Optical density of all the solutions was measured on a spectrophotometer (ELICO make, wavelength range 200 - 900 nm). One gram of activated carbon was placed in each 50 mL solution of 10 to 100 ppm. The solutions were shaken and kept in a thermostat for 24 hrs. The samples were then filtered and analyzed spectrophotometrically.
2.2. Adsorption Dynamics
The experimental data for the dye studied was fitted to simple Polynomial, Langmuir and Freundlich isotherms. Isotherms represent the relationship between the amount adsorbed and the concentration at a constant temperature. They also provide useful information about the adsorpion process and enable determination of useful surface parameters such as surface area, pore size distribution and pore volume of the adsorbant. Each individual type of activated carbon has its own isotherm curve and breaking point characteristics that help to give an estimate of its adsorptive life.
The experimental data was fitted to the following polynomial equation:
 (1)
(1)
qe shows the amount of dye adsorbed per unit weight of adsorbent (mg/L), where C0 is the initial concentration of the dye. A, B1, B2 represent the constants. The experimental data was also fitted to Linear forms of Langmuir isotherm of the type:
 (2)
(2)
qe indicates the amount of dye adsorbed per unit weight of adsorbent (mg/g). Ce is the equilibrium concentration of dye in mg/L. Q and b are the Langmuir constants where Q indicates the adsorption capacity in mg/g and b relates to the energy of adsorption (L/mg) in different experimental conditions. These were calculated from the straight line slope and intercept of linear plot between 1/qe and 1/Ce.
The essential characteristics of Langmuir equation were expressed in terms of a dimensionless separation factor RL:

RL values indicate the shape of the isotherm. Value of RL between 0 and one indicate a favorable adsorption [8]. RL > 1 is unfavorable. RL = 1 is linear. 0 > RL < 1 is favorable. RL = 0 is irreversible Langmuir theory is that sorption takes place at specific homogeneous sites within the adsorbent. It is assumed that once a dye molecule occupies a site no further adsorption can take place at that site and theoretically a saturation value is reached beyond which no further adsorption can take place.
Linear forms of Freundlich isotherms were plotted for all the pH values of the yellow dye and for the two samples of GAC. The data was fitted to the equation:
 (3)
(3)
Freundlich constants KF and n were calculated from the slope and intercept of log qe and log Ce along with R2 and SD [9]. KF (parameter relative to adsorption capacity) and n (process intensity) were calculated. The value of n between 2 and 10 indicates good adsorption. Freundlich isotherm is based on heterogeneous surface of adsorbent. The difference in adsorption capacity comes from different molecular structures of dyes and their different molecular weights.
3. RESULTS AND DISCUSSION
3.1. Effect of Initial Dye Concentration
Table 1; Figure 1 show the amount qe of dye Acid Yellow RR adsorbed by C1 and C2 samples of granulated activated carbon at various pH values and various ppm concentrations. It can be seen that qe on GAC C1 and C2 was higher at lower ppm concentration as compared to the adsorption at higher ppm concentration with the adsorbent dose being kept constant. At lower ppm concentration a substantial amount of dye got adsorbed leaving behind a good number of free adsorption sites on the adsorbent. At higher ppm concentrations the adsorbent was used to its greater capacity and lesser number of active sites remained available on GAC surface for further adsorption to take place.

Table 1. Amount of dye Acid Yellow RR adsorbed by activated carbon samples C1 and C2 at various pH values.

Figure 1. Amount of dye Acid Yellow RR adsorbed by activated carbonsamples C1 and C2 at various pH values. ¨C1 7.06 ■ C2 7.06 ▲C2 3.55 ▪ C2 10.
3.2. Effect of pH
Adsorption of dye Acid Yellow RR on GAC C2 was greatly affected by change in pH of the aqueous solution as can be seen in Figure 1. Amount of dye adsorbed qe on C2 in acidic pH is higher at all ppm concentrations as compared to adsorption in a lesser acidic and an alkaline environment. At 10 ppm concentration C2 adsorbed 47% of Acid Yellow RR at acidic pH. At alkaline pH the adsorption was only 1% at the same ppm concentration. However carbon sample C1 showed better adsorption as compared to carbon sample C2. At 10 ppm concentration at initial pH value 76% of Acid Yellow RR was adsorbed as against 35% on C2 in the same pH environment.
C1 as compared to C2 shows higher adsorption at initial pH. It also shows better adsorption than C2 did in acidic environment.
The linear plots of 1/qe and 1/Ce for Langmuir isotherm are shown in Figure 2. Table 2 gives the values of Langmuir constants (calculated from the slope and intercept) Q and b along with the values of r2, RL and SD for the dye at varied pH values and for the two samples of GAC, C1 and C2. RL values indicate the shape of the isotherm. Value of RL between 0 and one indicate a favorable adsorption Values of Q signify good adsorption of the dye on C1 and C2 samples of carbon. It particularly indicates a better adsorption at acidic pH on C2.

Figure 2. Langmuir Isotherm for dye Acid Yellow RR on C1 & C2 at different pH values. ¨C1 7.06 ■C2 7.06 ▲C2 3.55 ▪C2 10.

Table 2. Values of different constants for Langmuir Isotherm at various pH values.
Table 3 shows the Freundlich constants KF and n calculated from the slope and intercept of log qe and log Ce along with R2 and SD. KF (parameter relative to adsorption capacity) and n (process intensity) were calculated. Values of constant KF indicate higher adsorption capacity on Carbon sample C1 as compared to C2. The linear plots of log qe and log Ce for Freundlich isotherm are shown in Figure 3.
3.3. Adsorption Mechanism Explained
The positively charged surface sites on the adsorbent and the solution thus play a significant role in influencing the capacity of the adsorbent towards dye ions due to electrostatic attraction. Having an excess positive charge on their surface activated carbon shows a greater capacity to adsorb the dye when the solution is made acidic. At acidic pH values the adsorbent tends to form an aqua complex to yield a positively charged surface, so there is an increase in H+ ions in dye solution. The ionic dye releases colored dye: anions/cations in solution, which in turn is influenced by the solution pH agents. The OH– ions on the adsorbent surface tend to be neutralized by protonation which facilitates the diffusion of dye mole-
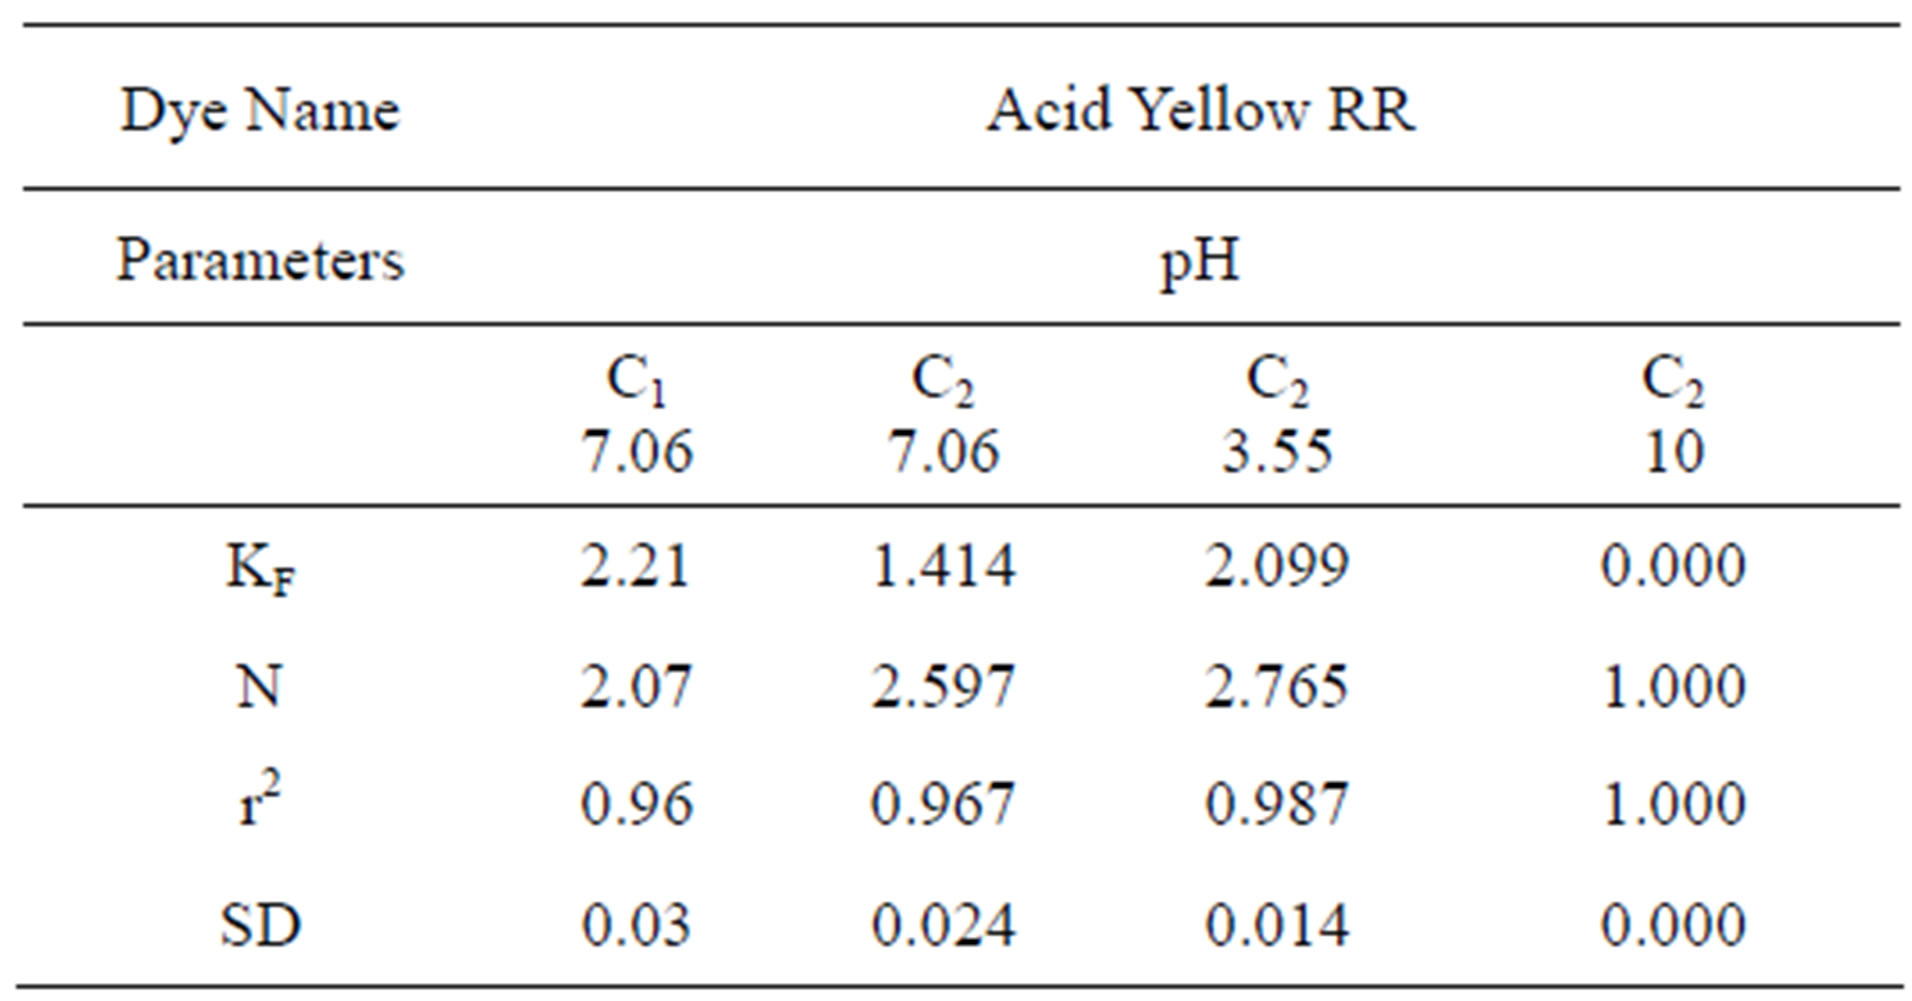
Table 3. Values of different constants for Freundlich Isotherm at various pH values.

Figure 3. Freundlich Isotherm for dye Acid Yellow RR on C1 & C2 at different pH values.¨C1 7.06 ■ C2 7.06 ▲C2 3.55 ▪C2 10.
cules in the vicinity of the adsorbent.
Lower adsorption at alkaline pH is due to the presence of OH– ions competing with the dye ions for adsorption sites. As the pH of the system decreases number of negatively charged surface sites increases.
4. CONCLUSION
As can be seen by the values of r2 and SD, in Tables 2 and 3, the experimental data fit to Langmuir and Freundlich isotherm models demonstrated a good fit showing consistency in the dynamics analysis.
Granulated Activated Carbon sample C1 and C2 can thus be effectively used for the removal of dyes from wastewater by adsorption. The present study shows that there is a decrease in percentage removal of dye per gram with increase in ppm concentration of the dye. Change in pH values showed higher adsorption at acidic pH.
Carbon sample C1 showed high adsorption; above 70%.
REFERENCES
- Whittaker, C.M., DSc, F.T.I. and Wilcock, C.C. (1949) Dyeing and coal-tar dyestuff. 5th Edition, Bailliere Tindall and Cox, London, 1-7.
- Mahajan S.P. (1985) Pollution control in process industries. Summer Report, IIT Bombay, 5.
- Bansal, M. (1997) Removal of pollutants from industrial waste water using activated carbon. PhD Thesis, Department of Chemical Engineering, Panjab University, Chandigarh, 2, 12.
- Anjali, C. (2002) Effects of waste water of dyeing units on human beings. M.Sc. Dissertation, Clothing & Textiles, Home Science College, Chandigarh, 3.
- Geetha, A., Siva Kumar, P., Sujatha, M., Palanisamy, P.N. and Somasundaram, T. (2009) Adsorption of acid blue from an aqueous solution onto activated areca nutshell carbon: Equilibrium, kinetic and thermodynamic studies. Research Journal of Chemistry and Environment, 13, 52.
- Sumathi, K.M.S. and Mahimairaja, S. (2009) Evaluation of adsorption potential of reed bed substrates for chromium (III) removal from tannery effluent: A batch study. Research Journal of Chemistry and Environment, 13, 59- 65.
- Rattan, V.K., Abhit, P., Harminder, S. and Mahboobeh, M. (2008) Adsorption if dyes from aqueous solution by cow dung ash, Carbon Letters, 9, 1.
- Aksu, Z. and Tezer, S. (2000) Equilibrium and kinetics modeling of biosorption of removal black b by rhizopodus arrhizus in a batch system: Effect of temperature, Process Biochemistry, 36, 431-439. doi:10.1016/S0032-9592(00)00233-8
- Ramakrishna, K.R. and Viraraghawan, T. (1997) Dye removal using low cost adsorbents. Water Science and Technology, 36, 189-196. doi:10.1016/S0273-1223(97)00387-9