Journal of Biomaterials and Nanobiotechnology
Vol.5 No.2(2014), Article ID:44394,15 pages DOI:10.4236/jbnb.2014.52011
A Biomimetic Gellan-Based Hydrogel as a Physicochemical Biofilm Model
Jan Hellriegel1, Steffi Günther2, Ingo Kampen2, Antonio Bolea Albero3, Arno Kwade2, Markus Böl3, Rainer Krull1
1Institute of Biochemical Engineering, Technische Universität Braunschweig, Braunschweig, Germany
2Institute for Particle Technology, Technische Universität Braunschweig, Braunschweig, Germany
3Institute of Solid Mechanics, Technische Universität Braunschweig, Braunschweig, Germany
Email: r.krull@tu-braunschweig.de
Copyright © 2014 by authors and Scientific Research Publishing Inc.
This work is licensed under the Creative Commons Attribution International License (CC BY).
http://creativecommons.org/licenses/by/4.0/


Received 17 December 2013; revised 5 March 2014; accepted 18 March 2014
ABSTRACT
Biofilm-forming microorganisms are ubiquitous, but continuous cultivation of these microorganisms with predictable biofilm growth and structural properties remains challenging. The development of a reliable simulated biofilm has been limited by a lack of information about the microorganism subpopulations and fluid-structure interactions involved in biofilm formation and detachment due to mechanical stress. This paper presents a gellan-based hydrogel as an alternative material for a simulated physicochemical biofilm. The mechanical properties of the hydrogel in terms of the storage (G') and loss (G'') moduli can be tuned and adapted to imitate biofilms of different strengths by changing the concentration of gellan and mono- (Na+) or divalent (Mg2+) ions. The storage modulus of the hydrogel ranges from 2 to 20 kPa, and the loss modulus ranges from 0.1 to 2.0 kPa. The material constants of the hydrogels and biofilms of Pseudomonas putida KT2440 were experimentally determined by rheometric analysis. A simplified biofilm imitate based on highly hydrolyzed gellan hydrogels was established by using experimental design techniques that permitted independent analyses regardless of growth. This model system design was compared to real biofilms and was adapted to mimic the mechanical properties of biofilms by changing the hydrogel composition, resulting in biofilm-like viscoelastic behavior. The use of a gellan-based hydrogel enables the imitation of biofilm behavior in the absence of growth effects, thus simplifying the system. Biofilm characterization tools can be tested and verified before their application to the measurement of slow-growing, highly variable biofilms to estimate system errors, which are often smaller than the biological variations. In general, this method permits faster and more reliable testing of biofilm mechanical properties.
Keywords:Biofilm Mechanics; Gellan Based Hydrogel; Viscoelasticity; Design of Experiments (DoE); Surface Response Methodology

1. Introduction
Biofilm-forming microorganisms are ubiquitous and are protected by a matrix of biopolymers, proteins, and other organic substances [1] . These characteristics complicate the removal of unwanted biofilms, thus resulting in reduced plant productivity or poor product quality. However, biofilms are also capable of degrading recalcitrant compounds and are thus essential in the microbial treatment of industrial wastewater. Catalytic biofilms are capable of synthesizing a wide variety of metabolites for potential use in the production of pharmaceuticals [2] [3] or biological toxic bulk chemicals, e.g., styrene oxide in biofilm-based biotransformations [4] [5] . Some of these metabolites are only produced in well-defined mixed biofilm biocoenoses, increasing interest in the controlled production of biofilms [6] . However, the continuous cultivation of biofilms with predictable growth and structural properties is difficult. Limited information about the microorganism subpopulations and the fluid-structure interactions involved in biofilm formation and detachment due to mechanical stress has complicated the development of reliable simulated biofilms. Recent studies have not had sufficient experimental data to validate models [7] -[9] .
Typically, bacterial matrix polysaccharides include the following homo-polymers: cellulose, curdlan, dextran, and hetero-polymers such as alginate, emulsan, gellan, and xanthan [1] . These polysaccharides are the most suitable base for the hydrogel model. Rowley et al. [10] proposed alginate as a synthetic extracellular matrix. However, their study focused on mammalian cells and not on the identification of materials for a physicochemical biofilm model. Shoichet et al. [11] demonstrated that calcium alginate-based hydrogels are unstable with time and therefore do not provide reliable mechanical properties. Although gellan gum was discovered less than three decades ago, its gelation behavior in aqueous solutions has been studied intensively [12] .
The aim of this paper was to simplify the biofilm system by using a physicochemical model based on highly hydrolyzed gellan hydrogels developed using experimental design techniques. The gellan-based hydrogel is an alternative material for synthetic physicochemical biofilms. The model system design was compared to real biofilms and adapted to mimic their mechanical properties. The storage (G') and loss (G'') moduli of the hydrogels could be tuned and adapted to simulate biofilms of different strengths by changing the concentration of the gellan and mono- (Na+) or divalent (Mg2+) ions, resulting in biofilm-like viscoelastic behavior.
2. Experimental
2.1. Biofilms
The sample biofilms were based on Pseudomonas putida KT2440. P. putida is a Gram-negative, rod-shaped (0.5 to 1.0 µm × 1.5 to 5.0 µm), saprotrophic soil bacterium that exhibits optimal planktonic growth at 25 to 30˚C [13] [14] and also grows as a biofilm [15] -[17] . P. putida can metabolize aromatics such as toluene, phenol, and polystyrol and is therefore used in water treatment or soil recovery processes [18] -[20] . The bacteria were grown in a standard lysogeny broth (LB) containing 10 gL−1 Bacto-Tryptone (Becton Dickinson, Franklin Lakes, NJ, USA), 5 gL−1 yeast extract (AppliChem, Darmstadt, Germany), and 10 gL−1 NaCl (Merck, Darmstadt, Germany). All solid media were dissolved in deionized water, and the pH was adjusted to 7. For agar plates, 15 gL−1 agar was added to the broth prior to autoclaving. P. putida KT2440 was cultured in Erlenmeyer flasks with shaking for 24 h at 30˚C. In accordance with Körstgens et al. [21] , biofilms were generated by cultivating P. putida KT2440 overnight in LB at 30˚C in a shaking incubator. The bacterial culture was then diluted to approximately 106 cells, was filtered through a recycled cellulose membrane with an average pore size of 0.2 µm (Sartorius stedim Biotech, Göttingen, Germany). The filter membranes were placed on agar plates and cultured at 30˚C. After 48 h, a mucoid bacterial biofilm lawn developed on the surface of the membrane filters, which were then placed on the stainless steel plate of the rheometer (Gemini II, Malvern Instruments, Worcestershire, UK) for viscoelastic characterization.
2.2. Sample Preparation
Gellan (Gelrite) was obtained from Carl Roth and was produced by Merck (Kelco Division, Rahway, NJ, USA). The gellan was already highly purified, and no further purification was required. Prior to sample preparation, stock solutions of gellan and the chloride and sulfate salts of Na+ and Mg2+ were prepared. The gellan stock solution contained 1.5% (w/v) gellan and deionized water and was heated to 90˚C and maintained at this temperature for 60 min to ensure complete dissolution and hydration of the polysaccharides. The stock solution was stored as a liquid at 60˚C. The chloride and sulfate salts of Na+ (Merck, Darmstadt, Germany) and Mg2+ (Sigma-Aldrich, St. Louis, USA) were separately dissolved in deionized water to prepare 5 M and 2.5 M stock solutions, respectively. To prepare the hydrogel samples, deionized water was preheated to 70˚C. Depending on the desired final concentrations of gellan, Na+, and Mg2+, appropriate amounts of the respective stock solutions were added to a beaker, and the preheated deionized water was added to achieve a final total volume of 30 mL. The solution was then stirred for 10 min at 70˚C. The beaker was covered to prevent evaporation. A 2 mL volume of the liquid solution was poured into a cylindrical mold (ø = 40 mm, height = 2 mm), which was placed on aluminum foil; this process was repeated with additional molds to obtain multiple samples. After 10 min, the gelled hydrogels were placed into Petri dishes, which were sealed to prevent evaporation and stored at 5˚C for 24 h.
2.3. Rheological Parameters
The rheological parameters storage modulus (G') and loss modulus (G'') were measured with a plate-plate Bohlin Gemini II rheometer (Malvern Instruments, Worcestershire, UK) at 25˚C. The frequency was set from 0.1 to 10 s−1. At frequencies lower than 0.1 s−1, the water stored in the hydrogel evaporates rapidly, resulting in false measurements. The tensile stress (σ) was maintained within a range of 0.5 to 500 Pa and controlled by a constant strain of γ0 = 0.005, limited by the linear range of the hydrogels. Data were obtained at 25 logarithmic scaled frequencies with a resolution of 11 bits and averaged over 2 s. The normal force was kept constant within a range of 1 ± 0.3 N.
The applied sinusoidal shear strain (γ) and the resulting stress (σ) response are given in Equation (1) and equation (2), respectively:
 , (1)
, (1)
 (2)
(2)
where ω is the circular frequency and δ is the resulting phase angle. The storage (G'), loss (G''), and complex moduli (G*) and the phase angle (δ) are defined in equations (3) to (6) [22]:
 , (3)
, (3)
 , (4)
, (4)
 (5)
(5)
 (6)
(6)
3. Theory

Table 1. Values for the storage (G') and loss (G'') moduli of gellan-based hydrogels containing different ion concentrations (20˚C to 30˚C and a frequency of 1 s−1 ). The data were collected from figures and tables in the referenced literature.
3.1. Gellan as a Biofilm Matrix
Bacterial biofilms can be described as polymeric porous gels that primarily consist of microorganisms, proteins, nucleic acids, polysaccharides, and water - . Typical components of the EPS-matrix are alginate, gellan, or xanthan. These components form a highly hydrated viscoelastic gel that provides the robust mechanical stability of the biofilm . The EPS matrix also acts as a promoter for the initial attachment of the bacterial cells to solid surfaces, strengthens the biofilm structure, and enhances its resistance due to environmental stress and disinfectants . The biofilm matrix is a dynamic system that can adapt to changes in environmental shear stress and respond to environmental changes . Therefore, the robustness of biofilms can be attributed to the viscoelastic properties of the EPS matrix. As the elastic component absorbs stress energy through reversible deformation, the viscous flow overcomes internal stress by irreversible deformation . The types of EPSs in biofilms grown in vitro can vary depending on the microorganisms present and the nutrient supply; biofilms can also exhibit evidence of aging and heterogeneity .
3.2. Central Composite Design
In order to study the influence of Na+ and Mg2+ on the viscoelastic properties of different gellan-based hydrogels within a frequency range of 0.1 to 10 s−1, a response surface methodology (RSM) was used. The RSM provides a smooth visualization of information for problem optimization when the mechanism that produced the data is either unknown or poorly understood. Thus, the mathematical form of the true response surface is unknown. An empirical linear or polynomial model is fitted to the data . In this case, the concentrations of the gellan and the ions give three independent factors, the frequency is an additional fourth factor, and the storage (G') and loss (G'') moduli provide two responses. Because the complex modulus (G*, compare Equation (5)) and the phase angle δ (compare Equation (6)) can be computed from G' and G'', they are not independent and were not considered further. The goal was to describe the influence of the response variables as a function of the factors. Depending on the system, the RSM uses a mathematical model to predict the response, which can either be linear, quadratic, or cubic - . Equation (7) shows the quadratic model for four factors: the content of gellan (xGellan), the concentrations of Mg2+ (cMg2+) and Na+ (cNa+), and the logarithmic frequency (f):
 (7)
(7)
The response surface of choice is the central composite design (CCD) developed by Box and Wilson for chemical processes . The CCD was set up with the previously mentioned four factors and five levels of variations. To simplify the visualization, the frequency was ignored, and thus the CCD was reduced to three dimensions (three factors). As shown in Figure 1, the CCD can thus be presented as a cube composed of points #1 to #8, a center point (CP), and a star composed of points #9 to #14. The cube, including the CP, includes the first three variations, while the star adds another two levels of variation . The software used was Design-Expert (Stat-Ease, Version 7.1.6), MATLAB (MathWorks, Version 8.1.0.604) and OriginPro (OriginLab Corporation, Version 9.0.0 (64 bit) SR2).
3.3. Defining the Design Space
The gellan manual states that a maximum gel hardness is reached in gels containing 1% (w/v) gellan and 6 to 8 mM Mg2+. At concentrations higher than 8.4 mM, Mg2+ enables gelation at temperatures above 50˚C. The sol-gel transition temperature is below 50˚C when the Na+ or K+ concentration is less than 100 mM. Our own experiments (data not shown) have shown that gels containing less than 0.5% (w/v) gellan, 30 mM Na+, and 5 mM Mg2+ are weak but highly. The CP concentration was defined as 0.75% (w/v) gellan, 40 mM Na+, and 6.7 mM Mg2+. Concentrations which are intermediate between those yield weak and maximally hard gels. The corners of the cube represent the minimum and maximum concentrations stated above and are comparable to the literature data summarized in Table 1. To obtain an adequate model, a fully factorial design including six replicates of the CP was used, resulting in a total of 20 experiments. Table 2 summarizes the concentrations used in each experiment, which ranged from 0.33 to 1.17% (w/v) gellan, 3.9 to 9.5 mM Mg2+, and 23 to 57 mM Na+. The frequency was included and was varied from 0.1 to 10 s−1 due to its influence on G' and G''.

Figure 1. Central composite design with three factors, varying over three levels of variation represented by the cube (#1 to #8, black). The RSM includes a fourth and fifth level of variation by introducing the star (#9 to #14, green). The center point (#15) is marked as CP.
Table 2. Concentrations used in the CCD with three factors (frequency is ignored). Runs #1 to #8 are the corners of the cube, #9 to #14 are the outer points of the star, and run #15 is the CP. The frequency range was set from 0.1 to 10 s−1, with 25 logarithmically scaled measurement points. All runs were performed in triplicate; the CP (#15) was repeated six times.
4. Statistical Methods
In order to ensure the quality of the model and the data, statistical approaches were required to verify the results obtained. A Box-Cox analysis was used for power transformation and to improve the results by adjusting the model. This approach assumes that if the computed model is adequate to fit the data, the residuals should be normally distributed because they are caused by random error; thus, the residuals should have a mean close to zero. Data that are not normally distributed are transformed by the power of λ:
 (8)
(8)
The Box-Cox analysis computes the minimal residual sum of squares as a function of λ and provides a guideline for selecting the correct power law transformation. The optimal value of λ yields the minimal residual sum of squares. The transformed data can improve the quality of the model but might not always result in normally distributed data [45] . To ensure the normal distribution of data, a Gaussian distribution of standard residuals is used to visualize the density of the residuals (compare Figure 2).
Some additional statistical values were provided by the Design of Experiments Software Design Expert. The quality of the fitted model is described by the F-value, R2, and Adequate Precision Ratio. The F-value compares the variance of the model with the variance of the residuals; the larger the F-value, the higher the significance of the model. R2 is a measure of the amount of variation around the mean. Finally, the adequate precision is a ratio of the signal to noise. It compares the predicted values of the design points to the average prediction error. Ratios greater than four are considered adequate for model discrimination [44] [45] [49] .
5. Results and Discussion
The first measurement was performed to define the region where the hydrogel behaves linear-viscoelastic. Figure 3 shows the G' and G'' as well as the phase angle of two hydrogels (#9 and #10) versus the strain. The curve shapes for G' and G'' as well as for the phase angle of both gels are clearly visible. These represent the hydrogels with lowest and highest concentration of gellan, which contained 0.33% (w/v) and 1.17% (w/v) gellan, respectively. The applied strain was increased from 10−4 to 1 at a constant frequency of 1 s−1. Between 10−4 and 10−3, G' and G'' were almost constant. These results are comparable to those of García et al. [40] for a 0.1% (w/v) gellan gel with cNa+ = 220 mM. Te Nijenhus described the straight line at lower strains as plate, which can also

Figure 2. Gaussian distribution of standard residuals for the storage and loss moduli. The normal curve is shown in red, and the density of the models standard residuals are shown as gray bars.
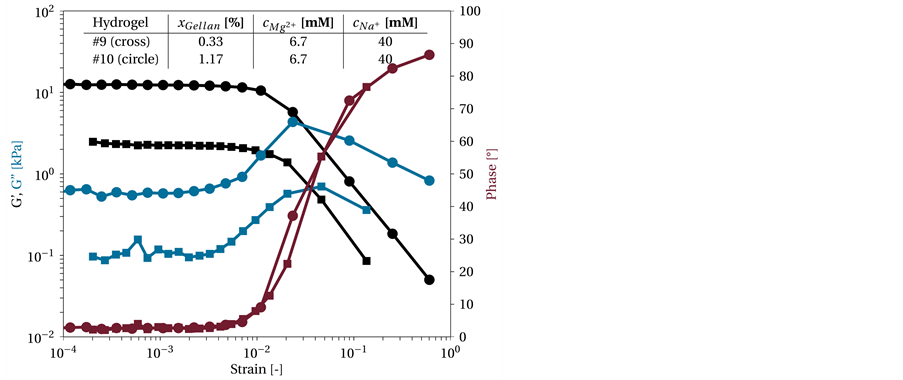
Figure 3. Amplitude sweep of two different gellan-based hydrogels. The hydrogels differ only in the gellan content, xGellan,#9 = 0.33% (w/v) (circle) and xGellan,#10 = 1.17 % (w/v) (square), with a constant ion concentration of cMg2+ = 6.7 mM and cNa+ = 40 mM. The frequency was constant at 1 s−1.
be observed in agarose or kappa carrageenan-based systems containing similar salts [41] .
For strains (γ) between 10−4 and 5∙10−3 the phase angle is small, pointing to a behavior similar to that exhibited by linear-elastic or Hookean material. For larger deformations, the phase angle increases to 90˚, thus changing the behavior of the material from Hookean solid-like behavior (δ = 0˚) to Newtonian liquid-like behavior (δ = 90˚), compare Equation (2).
However, when leaving the constant region, the error increases, reducing the accuracy. The linear range does not change between the two hydrogels, and the tendency toward an increase in the phase angle and a transition from a Hookean solid to a Newtonian liquid is similar. Thus, the CCD experiments were performed with a constant strain of 5∙10−3 to ensure reproducibility.
5.1. Viscoelasticity of Biofilms
For comparison with the synthetic hydrogels, biofilms of P. putida KT2440 were tested in an amplitude sweep, and the storage (G') and loss (G'') moduli and the phase angle are plotted as a function of strain in Figure 4. The rheological behavior of the biofilms was similar to that of the hydrogels. For the biofilms, G' was larger than G'', which is typical of stable elastic gels [35] . In contrast to the hydrogel, the viscoelasticity of the biofilm was approximately linear up to a strain of 5∙10−3. Higher strains cause an irreversible deformation of the biofilm structure, with a tendency toward viscous-like behavior [35] . As a result, the frequency sweeps were performed with a
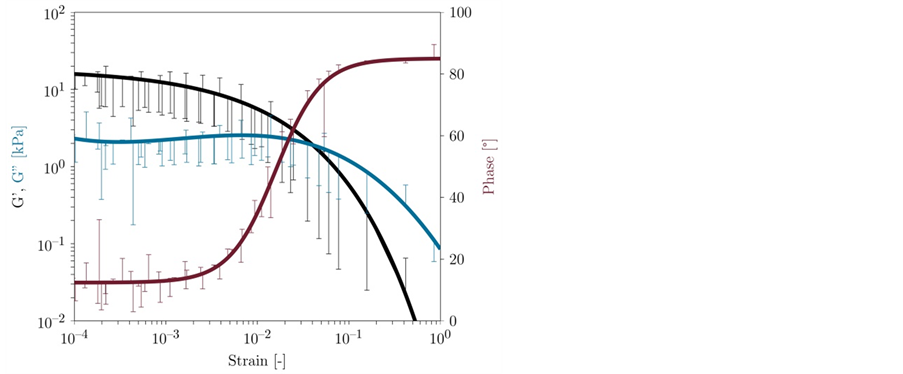
Figure 4. Amplitude sweep of a P. putida KT2440 biofilm cultivated for 48 h on a membrane filter on LB agar at 30˚C. The frequency was constant at 1 s−1. Experiments were performed using triplicate P. putida KT2440 biofilms and approximated (solid lines) to visualize the trend.
constant strain of 5∙10−3 to avoid irreversible deformation and ensure comparability with the hydrogel data.
5.2. Relation to Frequency
The first modeling approaches ignored the influence of frequency on G' and G'', leading to an unsatisfactory model estimate. However, according to te Nijenhuis [41] , a gel has a depicted maximum which is followed by a minimum in G'', while G' yields a straight line when plotted versus the frequency in a double logarithmic graph (compare Figure 5). Due to the general limitations of the measurement techniques, it is difficult to reach the maximum at very low frequencies [41] .
Figure 5 shows G' and G'' versus a frequency ranging from 0.1 to 10 s−1. A constant or slight increase in G' and a minimum for G'' were observed. G'' is always considerably smaller than G' due to the low bonding energies between the molecules [41] . G' can be approximated by linear regression, but a quadratic or cubic polynomial is more appropriate for G". Higher concentrations of salt or polysaccharides result in smaller changes in G' or G'' with increasing frequency. Gels with a high xGellan (e.g., #10) had a smaller slope for G' and a less pronounced curvature in G'' than gels with smaller amounts of xGellan. The slope of G’ varied from 0.015 to 0.13 depending on the hydrogel and was smaller but within the range of the value of 0.20 established by te Nijenhuis [41] . This result is within the same dimension with data from previous studies of similar concentrated gellan systems or comparable gels in an identical frequency range [27] -[31] [39] . Confirming the results reported by te Nijenhuis [41] , Figure 5 shows measurements of the gel-like region of the hydrogel, which is in between the liquid-like and the rubber-like region and is defined by a straight line in a double-logarithmic plot of G' versus frequency. However, the gellan-based hydrogels with high gellan content and added salts displayed only weak gel properties, consistent with the results of Cesàro et al. [50] , te Nijenhuis [41] , and Miyoshi et al. [27] . Despite the small variation, the frequency dependence is important as an additional logarithmic factor f = log (frequency) in the CCD and increases the quality of the estimated response surfaces.
5.3. Storage and Loss Modulus
The response surfaces presented are the result of fitting the data for 15 hydrogels of different compositions to Equation (7) with R being the response and used as the values of G' and G''. Each model term was tested to improve the overall model and was only selected if statically significant. The model residuals were checked for normal distribution; for data that were not normally distributed, the power transformation factor λ was computed and used to transform G' and G''. The new data were again fitted to Equation (7). When λ is close to one, the model is considered to include all effects. The solution is presented below.
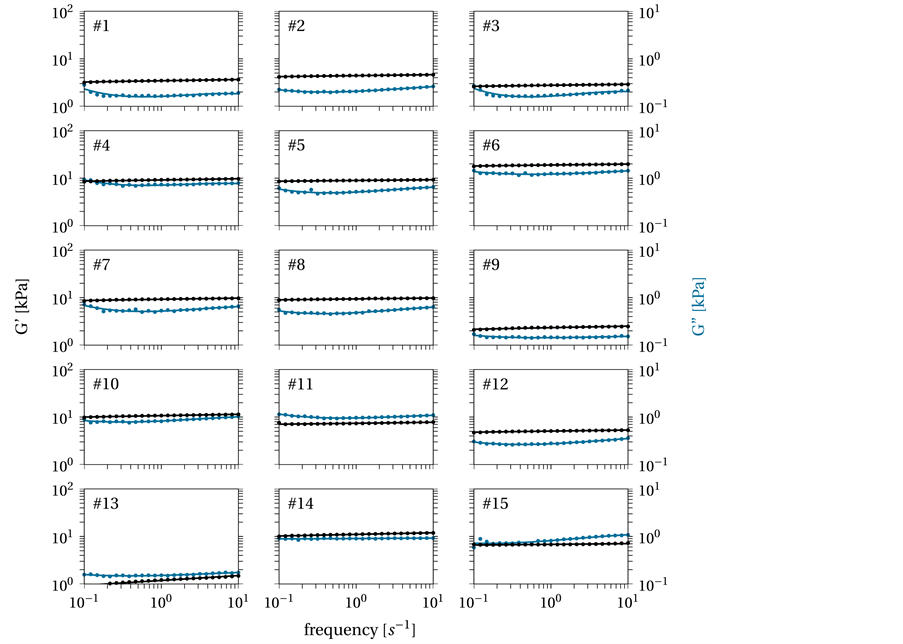
Figure 5. Storage (G', black) and loss (G'', blue) moduli versus the frequency of the CCD data. Experimental mean values are presented as circles, while the lines are the fitted polynomials. All measurements were performed in triplicate. G' shows a linear tendency, while G'' can be described by a quadratic polynomial.
The responses were power transformed with λ = 0.5 à Y' = Y0.5 for G' and λ = 0 à Y' = log(Y) for G''. This resulted in a suggested model for G' with F = 504.60 and R2 = 0.88. The probability that the F-value was that high due to noise is only 0.01%. The adequate precision ratio was 75.19, supporting the results above. This finally leads to the significant model terms for xGellan, cMg2+, cNa+, f and xGellancNa+:
 (9)
(9)
The recommended model function for G'' was given by F = 305.44 and R2 = 0.83. Although these values are lower than those for G', the probability of the F-value being caused solely by noise is again only 0.01%. The adequate precision ratio is 61.99, again yielding an adequate model. A probability above 0.95 proves that the model terms for xGellan, cMg2+, cNa+, f, xGellancNa+,  ,
,  and f2 are significant:
 (10)
(10)
Equation (9) and Equation (10) permit the prediction of G' and G'' for any hydrogel within the design space. The equations also enable the calculation of the gellan content xGellan and the ion concentration cMg2+ and cNa+ at a certain frequency to give a desired G'. The constants are computed as follows:
 (11)
(11)
and
 (12)
(12)
Equations (11) and (12) show the resulting empirical equations for the response surface for G' and G'', respectively. While the influence of gellan and ions on G' appears to be primarily linear, their relationship with G'' is more complex. Interestingly, the influence of frequency in the model corresponds to the observation above and results in a linear (G') or quadratic (G'') relation. This is comparable to the data published by te Nijenhuis [41] and Liu et al. [43] with a frequency interval of 0.1 to 10 s−1.
Figure 6 shows the results of G', the averaged measurement points, and the model results with their 95% confidence intervals. The maximum G', nearly 20 kPa, occurs at a maximum xGellan of 1.17% (w/v) and a high cMg2+ concentration. The minimum G', 2 kPa, occurs at the lowest xGellan and a minimal cMg2+ at just 2 kPa. The maximum and minimum values shown in Table 1 are similar to the values obtained for the CCD. However, the total ion concentration is different, and the xGellan is often higher, compared to the data from Noda et al. [28] and Pèrez-Campos et al. [39] , hampering comparisons. At constant cNa+, the addition of Mg2+ clearly increases G' (compare Figure 6(a)), while at constant cMg2+, the availability of Na+ has a lowering or leveling effect. The higher the cNa+ concentration, the smaller the influence of the total xGellan on G' (compare Figure 6(b)). The influence of xGellan is similar to that of cMg2+. If cNa+ is constant, an increase in xGellan results in an increase in G' (compare Figure 6(c)). However, at a constant cMg2+, a high xGellan, and a low cNa+, G' is high but decreases with a lower xGellan (compare Figure 6(d)). Furthermore, at low xGellan, G' increases with increasing cNa+ but decreases at a high xGellan. Finally, at the maximum added cNa+, a 0.5 % (w/v) gellan-based hydrogel with high cNa+ is stiffer than a 1.0% (w/v) gellan-based hydrogel with a similar cNa+. In summary, an increase in xGellan and cMg2+ will increase G'. A gain in cNa+ tends to weaken high-concentration gellan-based hydrogels but stiffens hydrogels containing low concentrations of gellan.
Figure 7 displays the results for G'', the averaged experimental data, and the model results with their 95% confidence intervals. The primary difference between the results for G' is a clear maximum in G'' when plotted against the xGellan or cMg2+. This maximum was reported previously by Sworn et al. [24] . Again, the effect of the monovalent ion Na+ on G'' differs from that of a divalent ion and is comparable to the effect on G' shown in Figure 6. The maximum G'' is nearly 2 kPa, while the minimum is approximately 0.1 kPa. These values are comparable to those reported in Table 1 and within the range of the values described by Noda et al. [28] and Oliveira et al. [31] . In Figure 7(a), G'' is identical for different cMg2+ due to the quadratic relation. For a small xGellan at constant cMg2+, the differences in G'' are small but tend to increase at higher gellan concentrations (compare Figure 7(b)). The maximum G'' is reached at a cMg2+ of 8.0 to 9.0 mM and xGellan between 0.75% to 1.0% (w/v), in agreement with the data provided by Carl Roth [48] (compare Figure 7(c)). Finally, the influence of cNa+ on G'' is in accordance with that on G'. At low cNa+ and high xGellan, G'' reaches its maximum but decreases rapidly if cNa+ is increased. However, at low xGellan, an increase in cNa+ results in a small increase in G'' (compare Figure 7(d)).
5.4. Quality of Model
The overall quality of the model is shown in Figure 8, which shows how well the model fits the measured data. The x-values represent the number of measured or computed hydrogel (compare Table 2) with frequency intervals from 0.1 to 10 s−1. The black lines are the results of the experiments plotted with the standard error (gray), while the red line shows the predicted or calculated values for G' and G'' based on the computed empirical models. In general, the given model yields a good fit. Except for the G' hydrogels numbered 1, 3, 7, and 13 and the G'' hydrogels numbered 2 and 7, the results (red line) are within the error estimate (95% confidence interval) or close to the measured values. The given R2 = 0.88 and R2 = 0.83 are reasonable for this type of empirical physicochemical model.
Figure 2 shows the Gaussian distribution of the standard residuals (black) corresponding to the models. Based on the assumption that non-systematic errors are random and normally distributed, the deviation from the ideal curve (red) can be used to determine if a model represents the data and includes all effects. If the residuals are not normally distributed, an error in the model or a systematic error in the measurements is indicated. However, the residuals for the loss and storage moduli are approximately normally distributed.
5.5. Proof of Concept
The viscoelastic behavior of the biofilm was determined by oscillation-frequency tests in comparison with the gellan hydrogels. Figure 9 shows the dependency of G' and G'' on the frequency at a strain of 5∙10−3 in the linear
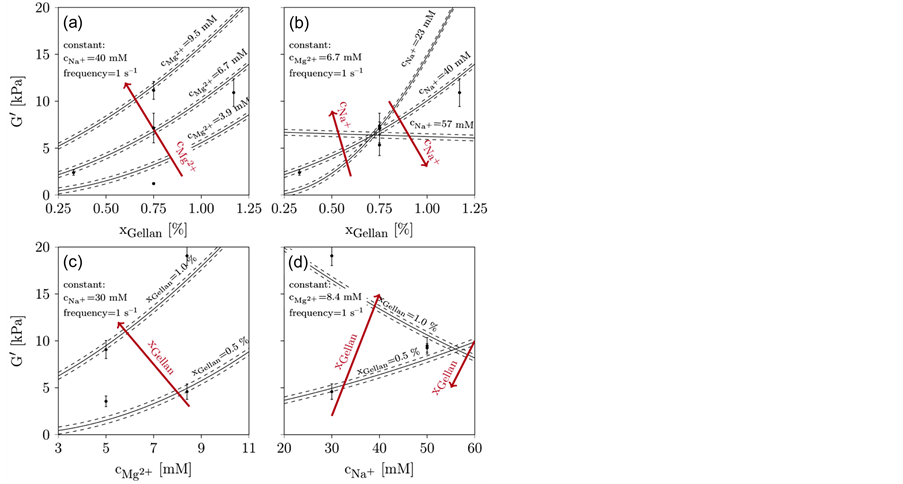
Figure 6. Results of fit for the storage modulus (G'). Design points are marked black including the standard error. The modeled results are represented by the lines and their dashed 95% confidence intervals. (a): xGellan and cMg2+ are varied, cNa+ (40 mM) and the frequency (1 s−1) are kept constant. (b): xGellan and cNa+ are varied, cMg2+ (6.7 mM) and the frequency (1 s−1) are kept constant. (c): cMg2+ and xGellan are varied, cNa+ (30 mM) and the frequency (1 s−1) are kept constant. (d): cNa+ and xGellan are varied and cMg2+ (8.4 mM) and the frequency (1 s−1) are kept constant.

Figure 7. Results of the fit for the loss modulus (G''). Design points are marked black, including the standard error. The modeled results are represented by the lines and their dashed 95% confidence intervals. (a): xGellan and cMg2+ are varied, cNa+ (40 mM) and the frequency (1 s−1) are kept constant. (b): xGellan and cNa+ are varied, cMg2+ (6.7 mM) and the frequency (1 s−1) are kept constant. (c): cMg2+ and xGellan are varied, cNa+ (30 mM) and the frequency (1 s−1) are kept constant. (d): cNa+ and xGellan are varied, cMg2+ (8.4 mM) and the frequency (1 s−1) are kept constant.

Figure 8. Quality of the model data (red) versus experimental data, measured (black) with 95 % confidence interval (gray).
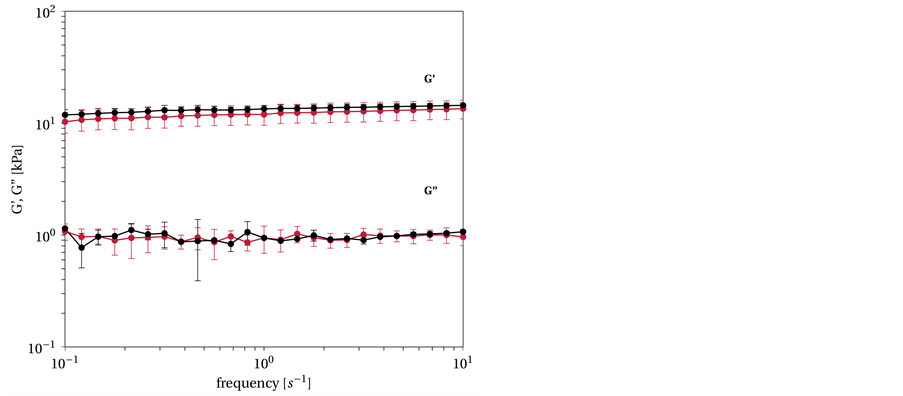
Figure 9. G' and G'' versus frequency. The P. putida KT2240 biofilm (red) is averaged over six runs while the hydrogel (black) is based on G' and G'' of the biofilm and its composition is computed with the empirical model to: xGellan = 0.75% (w/v), cMg2+ = 9.4 mM, cNa+ = 26 mM. Measurement is done as triplicate.
viscoelastic range (compare Figure 2). Variations in the standard error are evident; these variations are due to the higher variability in the density and structure of the biofilms. The viscoelastic behavior of the biofilm corresponds to that of the gellan hydrogel.
The frequency sweep yielded a G' of 11.96 ± 2.41 kPa and a G'' of 0.94 ± 0.26 kPa at 1 s−1, which is within the range of the hydrogels.
In order to validate the prediction quality of the empirical physicochemical model, three random hydrogels and their computed values for G' and G'' were generated, and their compositions were computed.
Table 3 shows the results for the three random hydrogels and a fourth based on the biofilm data. In comparison to the measured data, an error of 6.5% to 12.7% for G' is estimated. This is acceptable considering the error of the rheometer, which is ±10% [51] . The overall error for G'' ranges from 0.2% to 17.0%, which is higher but still reasonable for a biological system. Thus, the designed model is adequate for predicting the general behavior of the gellan hydroTable 3. Predicted versus measured values of G' and G'' for random biomimetic hydrogels. xGellan, cMg2+, and cNa+ at a constant frequency of 1 s−1 were computed based on the provided empirical model for the shown G' and G'' values. The viscoelastic data for a P. putida KT2440 biofilm grown on a membrane filter are provided for comparison.
gels within the design space. Furthermore, the data obtained for the P. putida KT2440 biofilm suggests that this biofilm can be simulated with the concept provided. The viscoelastic parameters G' and G'' are within the range of the measured values for the CCD. For the fourth hydrogel in Table 3 the values for G' and G'' of the biofilm were used and its concentrations computed. The modelled properties and the measured properties only deviate with an error of 12.7% for G' and 0.2% for G'', respectively. Thus, this proofs the concept of a biofilm imitating physicochemical model based on gellan hydrogels.
6. Conclusion
The aim of this study was to simplify the biofilm production system by using a physicochemical model based on highly hydrolyzed gellan hydrogels. The results demonstrated that RSM is a reliable tool for predicting the mechanical properties of gellan-based hydrogels. The resulting empirical physicochemical models for the storage (G') and loss (G'') moduli provide a tool that can be used to adjust and fine tune gel properties to mimic biofilm mechanical behavior. The results indicate a good estimation of the viscoelastic characteristic values of G' and G'' in the frequency interval of 0.1 to 10 s−1. Furthermore, the model was statistically verified and compared to experimental data. The G' and G'' values of the predicted and designed hydrogels differed by less than 17.0% and were similar to those of a biofilm of P. putida KT2440, conclusively demonstrating that this method enables the design of gellan-based hydrogels that mimic biofilm behavior.
References
- Lembre, P., Lorentz, C. and Di Martino, P. (2012) Exopolysaccharides of the Biofilm Matrix: A Complex Biophysical World. In: Karunaratne, D.N., Ed., The Complex World of Polysaccharides, InTech, 371-392. http://dx.doi.org/10.5772/51213
- Characklis, W.G. (1973) Attached Microbial Growths—II. Frictional Resistance Due to Microbial Slimes. Water Research, 7, 1249-1258. http://dx.doi.org/10.1016/0043-1354(73)90002-X
- Flemming, H.-C. and Schaule, G. (1994) Mikrobielle Werkstoffzerstörung-Biofilm und Biofouling: Bekämpfung von Biofouling in wäßrigen Systemen. Materials and Corrosion/Werkstoffe Und Korrosion, 45, 40-53. http://dx.doi.org/10.1002/maco.19940450110
- Gross, R., Lang, K., Bühler, K. and Schmid, A. (2010) Characterization of a Biofilm Membrane Reactor and Its Prospects for Fine Chemical Synthesis. Biotechnology and Bioengineering, 105, 705-717. http://dx.doi.org/10.1002/bit.22584
- Gross, R., Buehler, K. and Schmid, A. (2013) Engineered Catalytic Biofilms for Continuous Large Scale Production of n-Octanol and (S)-Styrene Oxide. Biotechnology and Bioengineering, 110, 424-436. http://dx.doi.org/10.1002/bit.24629
- Nikolaev, Y.A. and Plakunov, V.K. (2007) Biofilm—“City of Microbes” or an Analogue of Multicellular Organisms? Microbiology, 76, 125-138. http://dx.doi.org/10.1134/S0026261707020014
- Böl, M., Möhle, R.B., Haesner, M., Neu, T.R., Horn, H. and Krull, R. (2009) 3D Finite Element Model of Biofilm Detachment Using Real Biofilm Structures from CLSM Data. Biotechnology and Bioengineering, 103, 177-186. http://dx.doi.org/10.1002/bit.22235
- Ehret, A.E. and Böl, M. (2012) Modelling Mechanical Characteristics of Microbial Biofilms by Network Theory. Journal of the Royal Society, Interface/the Royal Society, 2012, 1-27. http://dx.doi.org/10.1098/rsif.2012.0676
- Böl, M., Ehret, A.E., Bolea Albero, A., Hellriegel, J. and Krull, R. (2013) Recent Advances in Mechanical Characterisation of Biofilm and Their Significance for Material Modelling. Critical Reviews in Biotechnology, 33, 145-171. http://dx.doi.org/10.3109/07388551.2012.679250
- Rowley, J.A., Madlambayan, G. and Mooney, D.J. (1999) Alginate Hydrogels as Synthetic Extracellular Matrix Materials. Biomaterials, 20, 45-53. http://dx.doi.org/10.1016/S0142-9612(98)00107-0
- Shoichet, M.S., Li, R.H., White, M.L. and Winn, S.R. (1996) Stability of Hydrogels Used in Cell Encapsulation: An in Vitro Comparison of Alginate and Agarose. Biotechnology and Bioengineering, 50, 374-381. http://dx.doi.org/10.1002/(SICI)1097-0290(19960520)50:4<374::AID-BIT4>3.0.CO;2-I
- Nishinari, K. (1999) Physical Chemistry and Industrial Application of Gellan Gum. Springer Verlag, Berlin, Heidelberg, New York. http://dx.doi.org/10.1007/3-540-48349-7
- Weller, D.M. (1988) Biological Control of Soilborne Plant Pathogens in the Rhizosphere with Bacteria. Annual Review of Phytopathology, 26, 379-407. http://dx.doi.org/10.1146/annurev.py.26.090188.002115
- Liu, L. (1995) Induction of Systemic Resistance in Cucumber Against Fusarium Wilt by Plant Growth-Promoting Rhizobacteria,” Phytopathology, 85, 695. http://dx.doi.org/10.1094/Phyto-85-695
- Tolker-Nielsen, T., Brinch, U.C., Ragas, P.C., Andersen, J.B., Jacobsen, C.S. and Molin, S. (2000) Development and Dynamics of Pseudomonas sp. Biofilms. Journal of Bacteriology, 182, 6482-6489. http://dx.doi.org/10.1128/JB.182.22.6482-6489.2000
- Nancharaiah, Y.V., Venugopalan, V.P., Wuertz, S., Wilderer, P.A. and Hausner, M. (2005) Compatibility of the Green Fluorescent Protein and a General Nucleic Acid Stain for Quantitative Description of a Pseudomonas putida Biofilm. Journal of Microbiological Methods, 60, 179-187. http://dx.doi.org/10.1016/j.mimet.2004.09.016
- Nilsson, M., Chiang, W.-C., Fazli, M., Gjermansen, M., Givskov, M. and Tolker-Nielsen, T. (2011) Influence of Putative Exopolysaccharide Genes on Pseudomonas putida KT2440 Biofilm Stability. Environmental Microbiology, 13, 1357-1369. http://dx.doi.org/10.1111/j.1462-2920.2011.02447.x
- Chung, T.-P., Tseng, H.-Y. and Juang, R.-S. (2003) Mass Transfer Effect and Intermediate Detection for Phenol Degradation in Immobilized Pseudomonas putida Systems. Process Biochemistry, 38, 1497-1507. http://dx.doi.org/10.1016/S0032-9592(03)00038-4
- Ward, P.G., Goff, M., Donner, M., Kaminsky, W. and O’Connor, K.E. (2006) A Two Step Chemo-Biotechnological Conversion of Polystyrene to a Biodegradable Thermoplastic. Environmental Science and Technology, 40, 2433-2437. http://dx.doi.org/10.1021/es0517668
- El-Bassi, L., Iwasaki, H., Oku, H., Shinzato, N. and Matsui, T. (2010) Biotransformation of Benzothiazole Derivatives by the Pseudomonas putida Strain HKT554. Chemosphere, 81, 109-113. http://dx.doi.org/10.1016/j.chemosphere.2010.07.024
- Körstgens, V., Flemming, H.C., Wingender, J. and Borchard, W. (2001) Influence of Calcium Ions on the Mechanical Properties of a Model Biofilm of Mucoid Pseudomonas aeruginosa. Water Science and Technology, 43, 49-57.
- Tropea, C., Yarin, A.L. and Foss, J.F. (2007) Springer Handbook of Experimental Fluid Mechanics. Springer-Verlag, Berlin Heidelberg. http://dx.doi.org/10.1007/978-3-540-30299-5
- Takahashi, R., Akutu, M., Kubota, K. and Nakamura, K. (1999) Characterization of Gellan Gum in Aqueous NaCl Solution. In: Nishinari, K., Ed., Physical Chemistry and Industrial Application of Gellan Gum, Springer-Verlag, Berlin Heidelberg, 1-7. http://dx.doi.org/10.1007/3-540-48349-7_1
- Sworn, G., Sanderson, G.R. and Gibson, W. (1995) Gellan Gum Fluid Gels. Food Hydrocolloids, 9, 265-271. http://dx.doi.org/10.1016/S0268-005X(09)80257-9
- Laaman, T.R. (2011) Hydrocolloids in Food Processing Hydrocolloids. John Wiley & Sons, Hoboken.
- Crescenzi, V. and Dentini, M. (1987) The Influence of Side-Chains on the Dilute-Solution Properties of Three Structurally Related, Bacterial Anionic Polysaccharides. Carbohydrate Research, 160, 283-302. http://dx.doi.org/10.1016/0008-6215(87)80318-X
- Miyoshi, E. and Nishinari, K. (1999) Rheological and Thermal Properties near the Sol-Gel Transition of Gellan Gum Aqueous Solutions. Progress in Colloid and Polymer Science, 114, 68-82. http://dx.doi.org/10.1007/3-540-48349-7_11
- Noda, S., Funami, T., Nakauma, M., Asai, I., Takahashi, R., Al-Assaf, S., et al. (2008) Molecular Structures of Gellan Gum Imaged with Atomic Force Microscopy in Relation to the Rheological Behavior in Aqueous Systems. 1. Gellan Gum with Various Acyl Contents in the Presence and Absence of Potassium. Food Hydrocolloids, 22, 1148-1159. http://dx.doi.org/10.1016/j.foodhyd.2007.06.007
- Nitta, Y., Takahashi, R. and Nishinari, K. (2010) Viscoelasticity and Phase Separation of Aqueous Na-Type Gellan Solution. Biomacromolecules, 11, 187-191. http://dx.doi.org/10.1021/bm901063k
- Miyoshi, E. (1996) Rheological and Thermal Studies of Gel-Sol Transition in Gellan Gum Aqueous Solutions. Carbohydrate Polymers, 30, 109-119. http://dx.doi.org/10.1016/S0144-8617(96)00093-8
- Oliveira, J.T., Martins, L., Picciochi, R., Malafaya, P.B., Sousa, R.A., Neves, N.M., et al. (2010) Gellan Gum: A New Biomaterial for Cartilage Tissue Engineering Applications. Journal of Biomedical Materials Research Part A, 93, 852-863. http://dx.doi.org/10.1002/jbm.a.32574
- Sutherland, I. (2001) Biofilm Exopolysaccharides: A Strong and Sticky Framework. Microbiology, 147, 3-9.
- Wloka, M., Rehage, H., Flemming, H.-C. and Wingender, J. (2004) Rheological Properties of Viscoelastic Biofilm Extracellular Polymeric Substances and Comparison to the Behavior of Calcium Alginate Gels. Colloid and Polymer Science, 282, 1067-1076. http://dx.doi.org/10.1007/s00396-003-1033-8
- Flemming, H.-C. and Wingender, J. (2010) The Biofilm Matrix. Nature Reviews. Microbiology, 8, 623-633. http://dx.doi.org/10.1038/nrmicro2415
- Di Stefano, A., D’Aurizio, E., Trubiani, O., Grande, R., Di Campli, E., Di Giulio, M., et al. (2009) Viscoelastic Properties of Staphylococcus aureus and Staphylococcus epidermidis Mono-Microbial Biofilms. Microbial Biotechnology, 2, 634-641. http://dx.doi.org/10.1111/j.1751-7915.2009.00120.x
- Czaczyk, K. and Myszka, K. (2007) Biosynthesis of Extracellular Polymeric Substances (EPS) and Its Role in Microbial Biofilm Formation. Polish Journal of Environmental Studies, 16, 799-806.
- Stoodley, P., Lewandowski, Z., Boyle, J.D. and Lappin-Scott, H.M. (1999) Structural Deformation of Bacterial Biofilms Caused by Short-Term Fluctuations in Fluid Shear: An in Situ Investigation of Biofilm Rheology. Biotechnology and Bioengineering, 65, 83-92. http://dx.doi.org/10.1002/(SICI)1097-0290(19991005)65:1<83::AID-BIT10>3.0.CO;2-B
- Flemming, H.C. and Wingender, J. (2001) Relevance of Microbial Extracellular Polymeric Substances (EPSs)—Part I: Structural and Ecological Aspects. Water Science and Technology, 43, 1-8.
- Pérez-Campos, S.J., Chavarría-Hernández, N., Tecante, A., Ramírez-Gilly, M. and Rodríguez-Hernández, A.I. (2012) Gelation and Microstructure of Dilute Gellan Solutions with Calcium Ions. Food Hydrocolloids, 28, 291-300. http://dx.doi.org/10.1016/j.foodhyd.2012.01.008
- García, M.C., Alfaro, M.C., Calero, N. and Muñoz, J. (2011) Influence of Gellan Gum Concentration on the Dynamic Viscoelasticity and Transient Flow of Fluid Gels. Biochemical Engineering Journal, 55, 73-81. http://dx.doi.org/10.1016/j.bej.2011.02.017
- Nijenhuis, K. (1997) Thermoreversible Networks Viscoelastic Properties and Structure of Gels. Springer-Verlag, Berlin Heidelberg.
- Nishinari, K. (1996) Rheological and DSC Studies on the Interaction between Gellan Gum and Konjac Glucomannan. Carbohydrate Polymers, 30, 193-207. http://dx.doi.org/10.1016/S0144-8617(96)00092-6
- Liu, L., Wang, B., Gao, Y. and Bai, T.-C. (2013) Chitosan Fibers Enhanced Gellan Gum Hydrogels with Superior Mechanical Properties and Water-Holding Capacity. Carbohydrate Polymers, 97, 152-158. http://dx.doi.org/10.1016/j.carbpol.2013.04.043
- Khuri, A. (2006) Response Surface Methodology and Related Topics. World Scientific Publishing Co. Pte. Ltd., Singapore.
- Siebertz, K., van Bebber, D. and Hochkirchen, T. (2010) Statistische Versuchsplanung. Springer-Verlag, Berlin Heidelberg. http://dx.doi.org/10.1007/978-3-642-05493-8
- Box, G. and Wilson, K. (1951) On the Experimental Attainment of Optimum Conditions. Journal of the Royal Statistical Society. Series B (Methodological), 13, 1-45.
- Montgomery, D. (1997) Design and Analysis of Experiments. 5th Edition, John Wiley & Sons, Inc., New York.
- Carl Roth (2006) GELRITE—Gellan Gum for Microbiological Applications. Carl Roth, Karlsruhe.
- Beucher, O. (2005) Wahrscheinlichkeitsrechnung und Statistik mit MATLAB. 2nd Edition., Springer-Verlag, Berlin Heidelberg.
- Cesàro, A., Gamini, A. and Navarini, L. (1992) Supramolecular Structure of Microbial Polysaccharides in Solution: From Chain Conformation to Rheological Properties. Polymer, 33, 4001-4008. http://dx.doi.org/10.1016/0032-3861(92)90596-O
- Malvern Service (2013) Malvern, Personal Notification.