Open Journal of Modern Hydrology
Vol.3 No.1(2013), Article ID:27229,8 pages DOI:10.4236/ojmh.2013.31004
Evaluation of Morphometric Parameters—A Remote Sensing and GIS Based Approach
![]()
Department of Geology, Aligarh Muslim University, Aligarh, India.
Email: nazego.khan@gmail.com
Received November 12th, 2012; revised December 25th, 2012; accepted January 8th, 2013
Keywords: Morphometric Characteristics; SRTM; Drainage Density; GIS
ABSTRACT
Land and water resources are generally depleting due to rapid increase in population, urbanization and industrialization. The demand has increased tremendously for these resources; hence optimal utilization of them is essential for sustainable development. In the present study, detailed morphometric parameters of the Banas river basin has been carried out. The river Banas originating from the Khamnor hills of the Aravalli ranges (about 5 kms from Kumbalgarh) is one of the major rivers of the state which, in its entire course, flows through Rajasthan. It flows from Kumbalgarh towards the south upto Gogunda plateau and after cutting the Aravalli ranges at right angles, it flows through Nathdwara, Rajsamand and Railmagra. The total area of the Banas river basin is 702.55 km2. Detailed drainage map was prepared from SOI (Survey of India) toposheets (45h/5 and 45h/9) and was updated using IRS-P6, LISS-III (Precision geocoded) data of 7th May, 2010 using ARC GIS software. For detailed study, Shuttle Radar Topographic Mission (SRTM) was used for delineating watershed boundary using SAGA GIS software. GIS techniques has been used for assessing various morphometric characteristics of the drainage basin, as they provide a flexible environment and a powerful tool for the manipulation and analysis of spatial information particularly for the feature identification and extraction of information for better understanding. In the present study, the GIS analysis techniques were used to evaluate linear and areal morphometric parameters of the basin. Drainage patterns are mainly dendritic to sub-dendritic with fifth order drainage. Banas river basin possess high drainage density which is indicative of less permeable material, sparse vegetative cover and moderate to high relief.
1. Introduction
Groundwater is the main source of water that meets the agricultural, industrial and household requirements. The morphometric analysis is important for any hydrological investigations like assessment of groundwater potential, groundwater management, pedology and environmental assessment [1].
Morphometry is the measurement and mathematical analysis of the configuration of the earth’s surface, shape and dimension of its landforms [2]. This analysis can be achieved through measurement of linear, aerial and relief aspects of the basin and slope contribution Nag and Chakraborty [3], Ali [4].
Morphometric analysis provides quantitative description of the basin geometry to understand initial slope or inequalities in the rock hardness, structural controls, recent diastrophism, geological and geomorphic history of drainage basin [5]. The morphometric study involves the evaluation of stream parameters through the measurements of various stream properties Kumar et al. [6], Ali et al. [7], Ali et al. [8], Pirasteh et al. [9].
Remote sensing techniques using satellite images are convienient tools for morphometric analysis. The satellite remote sensing has the ability to provide synoptic view of large area and is very useful in analyzing drainage morphometry. The image interpretation techniques are less time consuming than the ground surveys, which coupled with limited field checks yield valuable results.
2. Study Area
Banas river basin falls in Udaipur and Rajsamand district of Rajasthan. The total area of the Banas river basin is 702.55 sq·km. The study area is located lies between latitude 25˚00' - 24˚45'N and longitude 73˚25' - 73˚45'E falling in Survey of India toposheets No. 45H/5 and 45H/9 on 1:50,000 scale (Figure 1). The study area falls under tropical climate. It has high temperatures in summer and is very cold in winters. The summers have a mean maximum of 40˚C and a mean minimum of 25.8˚C, while the winter mean maximum is 22˚C and the mean


Figure 1. Location map of the study area.
minimum is 8.3˚C. Monsoon arrives in the month of July heralded by dust and thunderstorms. It annually receives around 637 mm of rainfall. This scanty amount of rainfall makes more humid. The humidity reaches to the extent of 90 percent during the month of monsoons.
The river Banas originating from the Khamnor hills of the Aravalli ranges (about 5 kms from Kumbalgarh) is one of the major rivers of the state which, in its entire course, flows through Rajasthan. It flows from Kumbalgarh towards the south upto Gogunda plateau and after cutting the Aravalli ranges at right angles, it flows through Nathdwara, Rajsamand and Railmagra. The river collects the major run-off of Udaipur, Chittorgarh and Bhilwara district by the tributary Berach. This river usually dries up during the summer season. The total length of this river is about 480 kms and its main tributaries are Berach, Khari Dai, Mashi, Dundh and Morel. The river Banas as well as tributaries are ephemeral and flow only in response to heavy precipitation.
3. Geology of the Area
The ultramafic rocks in the Aravalli Supergroup occur only in the belt south of Nathdwara. The ultramafic rocks also occur as thin conformable bands within quartzite, phyllite and mica-schists in the Jharol belt between Gogunda (24˚46':73˚32') and Jharol (24˚24':73˚29'). Lithologically, the ultramafic rocks are represented by talcchlorite (antigorite) schist and serpentinite with variable proportions of actinolite-tremolite, talc-tremolite, asbestos and dolomite. Magnetite (as well as chrome spinel) is a common accessory mineral.
4. Materials and Methods
Survey of India (SOI) topographic map on 1:50,000 scale bearing No. 45H/5 and 45H/9 was obtained from Survey of India, Dehradun has been used for drainage map and was updated using IRS P6, LISS III (Precision geocoded) data of 7th May, 2010. The important information on elevation, watershed boundary, contour lines, major roads, villages or towns and railway networks were extracted from the toposheet and a base map was generated.
The present study utilized digital data of Indian Remote Sensing (IRS P6) LISS III (Path-93 and Row-54) of 7th May, 2010 having a spatial resolution of 23.5 metre was procured from National Remote Sensing Centre, Hyderabad and a standard FCC was generated. For detailed study, Shuttle Radar Topographic Mission (SRTM) was used for delineating watershed boundary using SAGA GIS software.
Drainage map was prepared by on screen digitization using ARC GIS software. Quantitative Morphometric parameters such as stream length, bifurcation ratio and basin area have been calculated through the use of a Geographical Information System using Arc GIS environment.
5. Morphometric Analysis
Morphometric parameters have been classified into 1) Linear aspect 2) Areal aspect Linear aspect include Stream order (U), Stream number (Nu), Stream length (Lu), Mean stream length (Lsm), Stream length ratio (RL) and Bifurcation ratio (Rb). Areal aspects include drainage density (D), Stream frequency (Fs), Drainage texture (Rt), Circularity ratio (Rc), Elongation ratio (Re), Length of overland flow (Lg), Constant of channel maintenance (C) and infilteration number.
5.1. Linear Aspects
Linear aspects include stream order, stream number stream length, mean stream length, stream length ratio, and bifurcation ratio and are discussed below:
5.1.1. Stream Order (U)
Stream Order (U) expresses the hierarchal relationship between the individual stream segments that make up a drainage network. The first step in drainage basin analysis is the designation of stream orders, following a system introduced by [10]. The streams have been ranked following [5] stream ordering system based on hierarchic ranking of streams. In the [11], a stream segment with no tributaries is a first-order stream, a second-order stream is formed by joining of two first-order streams, where two second-order streams join, the stream is designated as third-order, and so forth.
Stream order of the whole Banas river basin is of fifth order (Figure 2(a)).
5.1.2. Stream Number (Nu)
The details of stream characteristics conform to [12] “law of stream numbers” which states that the number of streams of different orders in a given drainage basin tends closely to approximate an inverse geometric ratio. According to Horton’s principle the number of streams is negatively correlated with the order, i.e. stream number decreases with increase in stream order (Figure 2(a)).
Stream number (Nu) here supports Horton’s law i.e. stream number decrease with increase in stream order in this basin (Figure 3).
5.1.3. Stream Length (Lu)
The stream length characteristics of the basin conform [10] second “law of stream length”, which states that the average length of streams of each order in a drainage basin tends closely to approximate a direct geometric ratio. The numbers of streams of various orders in the basin are counted and their lengths are measured. In general, the total length of stream segments decreases with increasing stream order (Figure 2(b)).
 (a)
(a) (b)
(b) (c)
(c)
Figure 2. (a) Stream order, stream number; (b) Stream length; (c) Mean stream length.

Figure 3. Plots of stream order vs stream number.
5.1.4. Mean Stream Length (Lsm)
The mean stream length (Lsm) of a channel is a dimensional property revealing the characteristic size of components of a drainage network and its contributing basin surfaces [5]. In general, mean length of channel segments of a given order is greater than that of the next lower order but less than the next higher order (Figure 2(c)).
Mean stream length of Banas river basin reveals an increasing trend with the increase in stream order (Figure 4).
The whole Banas river basin is of fifth order. The drainage pattern of the study area is predominantly dendritic to sub-dendritic in nature (Figure 5).
5.1.5. Stream Length Ratio (RL)
Stream length ratio (RL) may be defined as the ratio of the mean length of an order to the next lower order of stream segment.

Figure 4. Plots of stream order vs mean stream length.

Figure 5. Drainage network of the study area derived from SOI toposheets and digital IRS P6 LISS III.
The stream length ratio of the Banas river basin ranges from 0.32 - 0.51. The stream length ratio (RL) between streams of different orders reveals variation in Banas river basin. This may be attributed to variation in slope and topography.
5.1.6. Bifurcation Ratio (Rb)
This is a dimensionless parameter that expresses the ratio of the number of streams of any given order (Nu) to the number in the next lower order [10,13]. [10] considered bifurcation ratio as an index of relief and dissections. [14] demonstrated that bifurcation ratio shows a small range of variation for different regions or for different environment except where the powerful geological control dominates. If bifurcation ratio is not same from one order to its next order, then these irregularities are attributed to geological and lithological development of a drainage basin [5]. Bifurcation ratio is an important parameter that expresses the degree of ramification of drainage network [15].
Since bifurcation ratio is a dimensionless property, and drainage systems in homogeneous materials tend to display geometrical similarity, it shows a small variation from region to region [16]. The lower values of bifurcation ratio are characteristics of the watersheds which have suffered less structural disturbances [17]. Whereas higher bifurcation ratio is the result of large variation in frequencies between successive orders and indicates a mature topography [18].
The bifurcation ratio of the Banas river basin ranges from 1.93 to 3.04 and its mean bifurcation ratio is 2.54 which falls under normal basin category (Table 1).
5.2. Areal Aspects
Areal aspects include drainage parameters such as drainage density, stream frequency, drainage texture, circularity ratio, length of overland flow and constant of channel maintenance which is discussed below.
5.2.1 Drainage Density (D)
Drainage density is defined as the cummulative length of all streams in a basin divided by the area of the basin [19]. It is a measure of average length of streams per unit drainage area, and describes the spacing of drainage channels. Drainage density has been interpreted to reflect the interaction between climate and geology [20]. [12] introduced drainage density as an expression to indicate the closeness of spacing of channels. Thus, drainage density is the ratio of total channel segment lengths cumulated for all orders within a basin to the basin area [16]. It is considered as an important indicator of the linear scale of land form elements in stream eroded topography. Density factor is related to climate, lithology, relief, infiltration capacity, vegetative cover, surface roughness
Table 1. Results of parameters of morphometric analysis of Banas river basin.
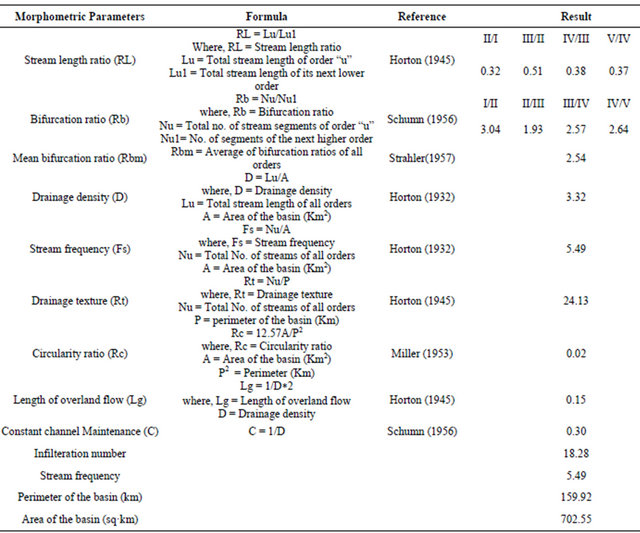
and run-off index. Out of which only surface roughness has no significant correlation with drainage density.
The amount and type of precipitation influences directly the quantity and character of surface run-off. An area with high precipitation such as thundershowers loses greater percentage of rainfall as run-off, resulting in more surface drainage channels. Density of vegetation and rainfall absorption capacity of soils, influence the rate of surface run-off and affects the drainage texture of an area. [21] recognized significance of drainage density as a factor determining the time of travel by water and stated that drainage density values between 0.55 and 2.09 km/km2 correspond to humid regions. [17] found that low drainage density generally results in areas of highly resistant rocks or permeable subsoil material, dense vegetation and low relief. High drainage density results due to weak or impermeable subsurface material, sparse vegetation and mountainous relief. Low drainage density leads to coarse drainage texture whereas high drainage density leads to fine drainage texture.
Banas river basin possess high drainage density i.e. 3.32 km/km2 which is indicative of less permeable material, sparse vegetative cover and moderate to high relief (Table 1).
5.2.2. Stream Frequency (Fs)
[12] introduced stream frequency (Fs) or channel frequency as the ratio of total number of stream segments of all orders to the basin area. [22] found that lower Fs values indicate permeable sub-surface material and low relief, whereas higher values are the characteristic of resistant sub-surface material, sparse vegetation and high relief.
The stream frequency of the Banas river basin is 5.49 (Table 1).
5.2.3. Drainage Texture (Rt)
Drainage texture (Rt) is one of the important drainage parameters in morphometric analysis, which indicates relative spacing of drainage lines, which are more prominent in impermeable material compared to the permeable ones. [10] defined drainage texture as the total number of stream segments of all orders divided by the perimeter of the watershed. He also recognized infiltration capacity as the dominant factor influencing drainage texture which includes drainage density and stream frequency as well. Drainage texture (Rt) depends upon a number of natural factors such as climate, rainfall, vegetation, lithology, soil type, infiltration capacity, relief and stage of development [23]. [23] classified drainage density into five different classes of drainage texture, i.e. less than 2, indicates very coarse, between 2 and 4 is coarse, between 4 and 6 is moderate, between 6 and 8 is fine and greater than 8 is very fine drainage texture. The soft or weak rocks devoid of vegetation generally exhibit a fine texture, whereas in massive and resistant rocks coarse drainage texture is developed.
The Banas river basin has a value of 24.137 which falls under very fine drainage texture (Table 1). Sparse vegetation in arid climate causes finer texture than in humid climate.
5.2.4. Circularity Ratio (Rc)
[24] and [5], defined circularity ratio (Rc), as the ratio of the area of the basin (A) to the area of a circle having the same circumference as the perimeter (P) of the basin. Circularity ratio (Rc) is influenced by the length and frequency of streams, geological structures, land use/land cover, climate, relief and slope of the basin [25].
The circularity ratio of the Banas river basin is 0.02 (Table 1). This value is an indicative of the lack of circularity.
5.2.5. Length of Overland Flow (Lg)
[10], defined length of overland flow (Lg) as the length of water over the ground before it gets concentrated into definite stream channels. He considered it as one of the most important independent variables affecting hydrologic and physiographic development of drainage basins. The average length of overland flow is approximately half the average distance between stream channels and is therefore approximately equals to half of reciprocal of drainage density [10].
The value of Length of Overland Flow of the basin is 0.15 (Table 1). The value is equals to the half of the constant of channel maintenance.
5.2.6. Infilteration Number
Infilteration number is the product of the drainage density and stream frequency of the basin. The infilteration number of the basin is 18.28 (Table 1) indicating low infilteration and high run-off.
5.2.7. Constant of Channel Maintenance (C)
[13] has used inverse of drainage density as another parameter called constant of channel maintenance (C), defined in units of square feet per foot. It has dimensions of length and therefore increases in magnitude as the scale of the landform units increases. In short, it measures the number of square feet of watershed surface area required to sustain one linear foot of channel.
The Constant of Channel Maintenance of the basin is 0.30 (Table 1). This low value indicates high structural disturbances, low permeability, steep to very steep slopes and high surface run off.
6. Result and Discussion
The whole Banas river basin is of fifth order. The drainage pattern of the study area is predominantly dendritic to sub-dendritic in nature. Stream number of the basin decreases with increase in stream order i.e. first order has 2928 number of streams whereas fifth order has 1, supports Horton’s Law. The total length of stream segments decreases with increase in stream order. First order has stream length of 1470.48 kms whereas fifth order has stream length of 36.69 kms. Mean stream length of Banas watershed reveals an increasing trend with the increase in stream order i.e. first order has mean stream length of 0.50 kms whereas fifth order has mean stream length of 4.58 kms. The stream length ratio of the Banas river basin ranges from 0.32 - 0.51. The stream length ratio (RL) between streams of different orders reveals variation in Banas river basin. This may be attributed to variation in slope and topography. The bifurcation ratio of the Banas river basin ranges from 1.93 to 3.04 and its mean bifurcation ratio is 2.54 which falls under normal basin category. High drainage density (3.32 km/km2) indicates less permeable material, sparse vegetative cover and moderate to high relief in the basin. The Banas river basin has a value of 24.137 which falls under very fine drainage texture (Table 1).
7. Conclusion
Remote sensing and GIS techniques are convienient tools for morphometric analysis. Detailed morphometric study of the Banas river basin represents dendritic to sub-dendritic drainage pattern with 5th order drainage. The larger number of first order streams indicate uniform lithology and gentle slope gradient. Banas river basin shows very fine drainage texture. The bifurcation ratio of the Banas river basin is 2.54 which indicate that the basin is normal and the control of drainage network is mainly pronounced by geomorphology. Lower value of bifurcation ratio indicates that the drainage basin is underlined by uniform materials and the streams are usually branched systematically. A plot of logarithm of number of stream vs. stream order shows deviation from straight line indicating regional upliftment. Banas river basin possess high drainage density which is indicative of less permeable material, sparse vegetative cover and moderate to high relief. Circularity and elongation ratio shows that the basin has elongated shaped.
8. Acknowledgements
The financial support from UGC in the form of Maulana Azad National Fellowship for minority (2011-2012) is thankfully acknowledged by one of the author (Ms. Nazia Khan). Thanks are also due to Heena Parveen and Bhuvnesh Kumar Gupta for their help and co-operation during the field work.
REFERENCES
- G. Mahadevaswamy, D. Nagaraju, S. Lakshmamma, M. S. Lone, P. C. Nagesh and R. Krishna, “Morphometric Analysis of Nanjangud Taluk, Mysore District, Karnataka, India, Using GIS Techniques,” International Journal of Geomatics and Geosciences, Vol. 1, No. 4, 2011, pp. 721- 734.
- J. I. Clarke, “Morphometry from Maps. Eassys in Geomorphology,” Elsevier Publishing Company, New York, 1966, pp. 235-274.
- S. K. Nag and S. Chakraborty, “Influences of Rock Types and Structures in the Development of Drainage Network in Hard Rock Area,” Journal of Indian Society Remote Sensing, Vol. 31, No. 1, 2003, pp. 25-35. doi:10.1007/BF03030749
- S. A. Ali, “Morphometric Analysis of the Hiyunl River Basin at Rishikesh, Garhwal Himalayas, India,” Proceedings of the IX Asian Conference on Remote Sensing, Bangkok, 23-29 November 1988, pp. B-9-1-B-9-8.
- A. N. Strahler, “Quantitative Geomorphology of Drainage Basins and Channel Networks,” In: V. T. Chow, Ed., Handbook of Applied Hydrology, McGraw-Hill Book Company, New York, 1964, Section 4-11.
- R. Kumar, S. Kumar, A. K. Lohni, R. K. Neema and A. D. Singh, “Evaluation of Geomorphological Characteristics of a Catchment Using GIS,” GIS India, Vol. 9, No. 3, 2000, pp. 13-17.
- S. A. Ali, K. Rangzen and S. Pirasteh, “Use of Digital Elevation Model for Study of Drainage Morphometry and Identification of Stability and Saturation Zones in Relations to Landslide Assessments in Parts of Shahbazan Area, Zagros Belt, SW Iran,” Cartography, Vol. 32, No. 2, 2003, pp. 162-169.
- S. A. Ali and S. Pirasteh, “Evaluation of Ground Water Potential Zones in Parts of Pabdeh Anticline, Zagros Fold Belt, SW Iran,” Water, Ethiopian Journal of Water Science and Technology, Vol. 9, No. 1, 2005, pp. 92-97.
- S. Pirasteh, S. A. Ali and H. S. Hussaini, “Morphmetric and Structural Analysis in Zagros Mountains, Southwest Iran—An Application of Geo-Information Technology,” Journal of Geomatics, Vol. 1, No. 2, 2007, pp. 39-44.
- R. E. Horton, “Erosional Development of Streams and Their Drainage Basins: Hydrophysical Approach to Quantitative Morphology,” The Geological Society of America, Vol. 56, No. 3, 1945, pp. 275-370. doi:10.1130/0016-7606(1945)56[275:EDOSAT]2.0.CO;2
- A. N. Strahler, “Hypsometric Analysis of Erosional Topography,” Bulletin of the Geological Society of America, Vol. 63, No. 11, 1952, pp. 1117-1142. doi:10.1130/0016-7606(1952)63[1117:HAAOET]2.0.CO;2
- R. E. Horton, “Drainage Basin Characteristics,” Transactions of American Geophysical Union, Vol. 13, 1932, pp. 350-361. doi:10.1029/TR013i001p00350
- S. A. Schumn, “Evolution of Drainage Systems and Slopes in Badlands at Perth Amboy, New Jersey,” Bulletin of the Geological Society of America, Vol. 67, No. 5, 1956, pp. 597-646. doi:10.1130/0016-7606(1956)67[597:EODSAS]2.0.CO;2
- A. N. Strahler, “Quantitative Analysis of Watershed Geomorphology,” Transactions of American Geophysical Union, Vol. 38, 1957, pp. 913-920. doi:10.1029/TR038i006p00913
- L. M. Mesa, “Morphometric Analysis of a Subtropical Andean Basin (Tucuman, Argentina),” Environmental Geology, Vol. 50, No. 8, 2006, pp. 1235-1242. doi:10.1007/s00254-006-0297-y
- “Handbook of Applied Hydrology,” In: V. T. Chow, Ed., McGraw-Hill Book Company, New York, 1964.
- S. K. Nag, “ Morphometric Analysis Using Remote Sensing Techniques in the Chaka Sub Basin, Purulia District, West Bengal,” Journal of the Indian Society of Remote Sensing, Vol. 26, No. 1-2, 1998, pp. 69-76. doi:10.1007/BF03007341
- P. D. Sreedevi, K. Subrahmanyam and S. Ahmed, “The Significance of Morphometric Analysis for Obtaining Groundwater Potential Zones in a Structurally Controlled Terrain,” Environmental Geology, Vol. 47, No. 3, 2004, pp. 412-420. doi:10.1007/s00254-004-1166-1
- A. N. Strahler, “Dimensional Analysis Applied to Fluvially Eroded Landforms,” Geological Society of America Bulletin, Vol. 69, No. 3, 1958, pp. 279-300. doi:10.1130/0016-7606(1958)69[279:DAATFE]2.0.CO;2
- F. E. Ritter and N. P. Major, “Useful Mechanisms for Developing Simulations for Cognitive Models,” AISB Quarterly, Vol. 91, 1995, pp. 7-18.
- W. B. Langbein, “Topographic Characteristics of Drainage Basins,” U.S. Geological Survey, Water-Supply Paper, No. 956-C, 1947, pp. 125-157.
- G. P. Obi Reddy, A. K. Mji, G. R. Chary, C. V. Srinivas, P. Tiwary and K. S. Gajbhiye, “GIS and Remote Sensing Applications in Prioritization of River Sub Basins Using Morphometric and USLE Parameters—A Case Study,” Asian Journal of Geoinformatics, Vol. 4, No. 4, pp. 35- 50.
- K. G. Smith, “Standards for Grading Texture of Erosional Topography,” American Journal of Science, Vol. 248, 1954, pp. 655-668. doi:10.2475/ajs.248.9.655
- V. C. Miller, “A Quantitavie Geomorphic Study of Drainage Basin Characteristics in the Clinch Mountain Area, Virgina and Tennessee,” Department of Geology, Columbia University, New York, 1953.
- R. Chopra, R. D. Diman and P. K. Sharma, “Morphometric Analysis of Sub-Watershed in Gurdaspur District, Punjab Using Remote Sensing and GIS Techniques,” Journal of the Indian Society of Remote Sensing, Vol. 33, No. 4, 2005, pp. 531-539. doi:10.1007/BF02990738