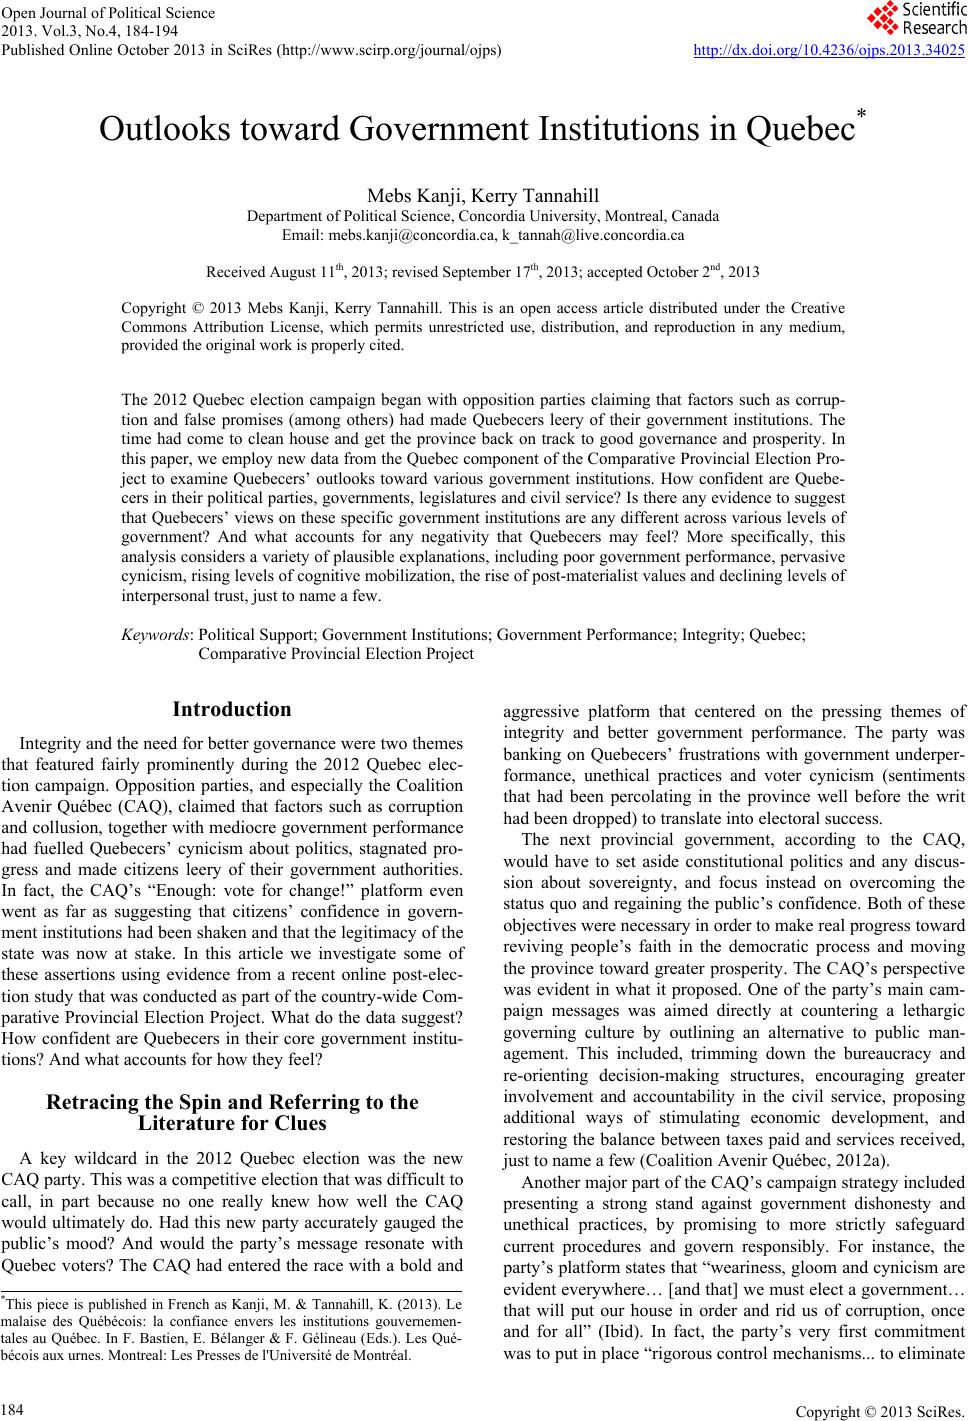
 Open Journal of Political Science 2013. Vol.3, No.4, 184-194 Published Online October 2013 in SciRes (http://www.scirp.org/journal/ojps) http://dx.doi.org/10.4236/ojps.2013.34025 Copyright © 2013 SciRes. 184 Outlooks toward Government Institutions in Quebec* Mebs Kanji, Kerry Tannahill Department of Political Science, Concordia University, Montreal, Canada Email: mebs.kanji@concordia.ca, k_tannah@live.concordia.ca Received August 11th, 2013; revised September 17th, 2013; accepted October 2nd, 2013 Copyright © 2013 Mebs Kanji, Kerry Tannahill. This is an open access article distributed under the Creative Commons Attribution License, which permits unrestricted use, distribution, and reproduction in any medium, provided the original work is properly cited. The 2012 Quebec election campaign began with opposition parties claiming that factors such as corrup- tion and false promises (among others) had made Quebecers leery of their government institutions. The time had come to clean house and get the province back on track to good governance and prosperity. In this paper, we employ new data from the Quebec component of the Comparative Provincial Election Pro- ject to examine Quebecers’ outlooks toward various government institutions. How confident are Quebe- cers in their political parties, governments, legislatures and civil service? Is there any evidence to suggest that Quebecers’ views on these specific government institutions are any different across various levels of government? And what accounts for any negativity that Quebecers may feel? More specifically, this analysis considers a variety of plausible explanations, including poor government performance, pervasive cynicism, rising levels of cognitive mobilization, the rise of post-materialist values and declining levels of interpersonal trust, just to name a few. Keywords: Political Support; Government Institutions; Government Performance; Integrity; Quebec; Comparative Provincial Election Project Introduction Integrity and the need for better governance were two themes that featured fairly prominently during the 2012 Quebec elec- tion campaign. Opposition parties, and especially the Coalition Avenir Québec (CAQ), claimed that factors such as corruption and collusion, together with mediocre government performance had fuelled Quebecers’ cynicism about politics, stagnated pro- gress and made citizens leery of their government authorities. In fact, the CAQ’s “Enough: vote for change!” platform even went as far as suggesting that citizens’ confidence in govern- ment institutions had been shaken and that the legitimacy of the state was now at stake. In this article we investigate some of these assertions using evidence from a recent online post-elec- tion study that was conducted as part of the country-wide Com- parative Provincial Election Project. What do the data suggest? How confident are Quebecers in their core government institu- tions? And what accounts for how they feel? Retracing the Spin and Referring to the Literature for Clues A key wildcard in the 2012 Quebec election was the new CAQ party. This was a competitive election that was difficult to call, in part because no one really knew how well the CAQ would ultimately do. Had this new party accurately gauged the public’s mood? And would the party’s message resonate with Quebec voters? The CAQ had entered the race with a bold and aggressive platform that centered on the pressing themes of integrity and better government performance. The party was banking on Quebecers’ frustrations with government underper- formance, unethical practices and voter cynicism (sentiments that had been percolating in the province well before the writ had been dropped) to translate into electoral success. The next provincial government, according to the CAQ, would have to set aside constitutional politics and any discus- sion about sovereignty, and focus instead on overcoming the status quo and regaining the public’s confidence. Both of these objectives were necessary in order to make real progress toward reviving people’s faith in the democratic process and moving the province toward greater prosperity. The CAQ’s perspective was evident in what it proposed. One of the party’s main cam- paign messages was aimed directly at countering a lethargic governing culture by outlining an alternative to public man- agement. This included, trimming down the bureaucracy and re-orienting decision-making structures, encouraging greater involvement and accountability in the civil service, proposing additional ways of stimulating economic development, and restoring the balance between taxes paid and services received, just to name a few (Coalition Avenir Québec, 2012a). Another major part of the CAQ’s campaign strategy included presenting a strong stand against government dishonesty and unethical practices, by promising to more strictly safeguard current procedures and govern responsibly. For instance, the party’s platform states that “weariness, gloom and cynicism are evident everywhere… [and that] we must elect a government… that will put our house in order and rid us of corruption, once and for all” (Ibid). In fact, the party’s very first commitment was to put in place “rigorous control mechanisms... to eliminate *This piece is published in French as Kanji, M. & Tannahill, K. (2013). Le malaise des Québécois: la confiance envers les institutions gouvernemen- tales au Québec. In F. Bastien, E. Bélanger & F. Gélineau (Eds.). Les Qué- écois aux urnes. Montreal: Les P esses de l'Université de Montréal. 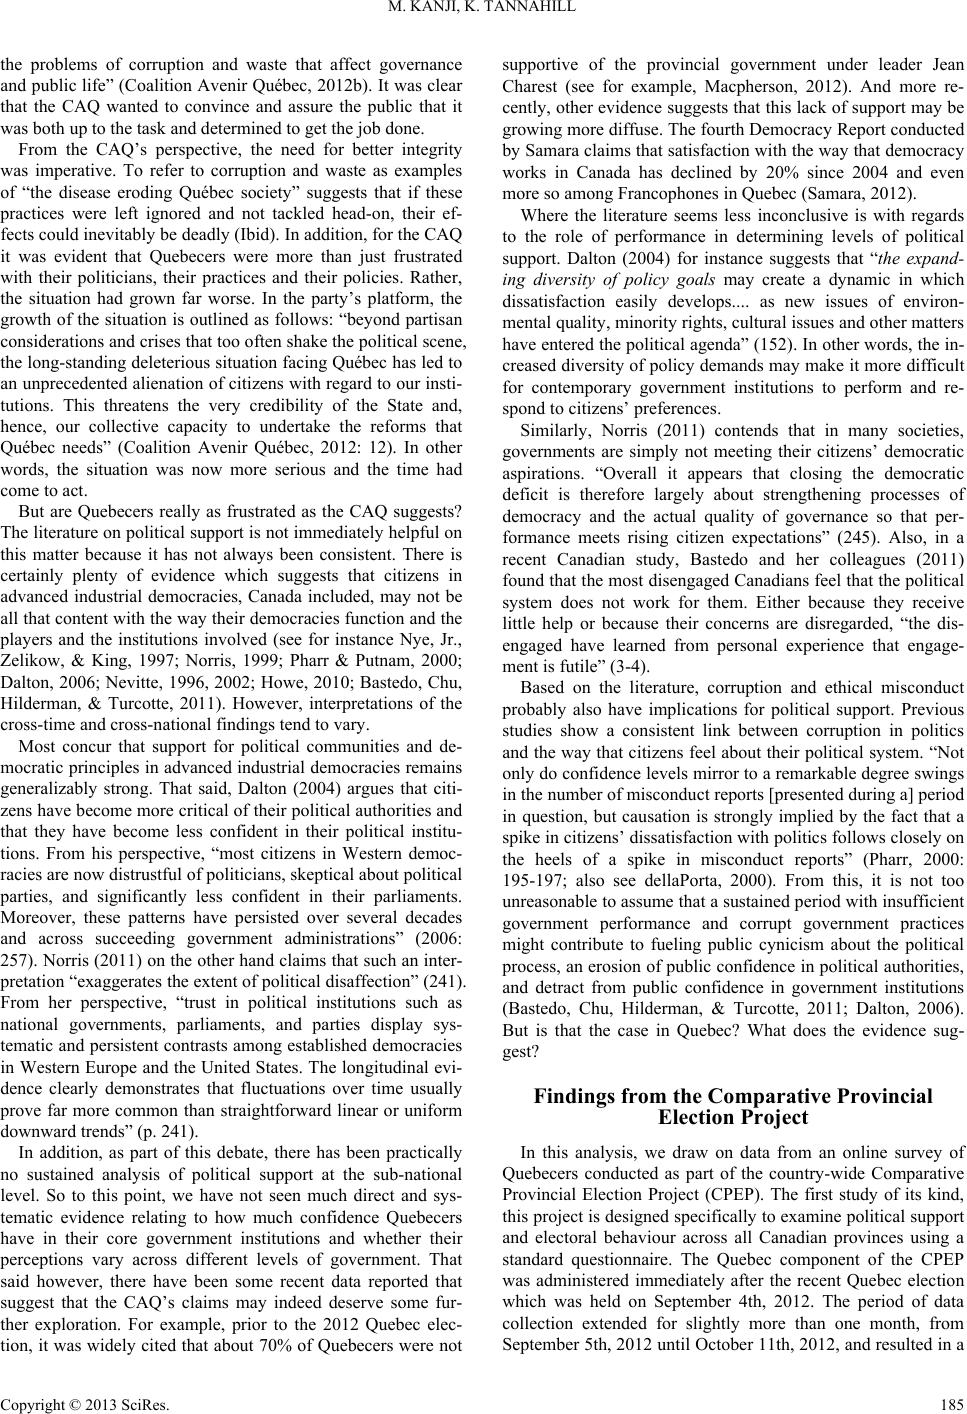 M. KANJI, K. TANNAHILL the problems of corruption and waste that affect governance and public life” (Coalition Avenir Québec, 2012b). It was clear that the CAQ wanted to convince and assure the public that it was both up to the task and determined to get the job done. From the CAQ’s perspective, the need for better integrity was imperative. To refer to corruption and waste as examples of “the disease eroding Québec society” suggests that if these practices were left ignored and not tackled head-on, their ef- fects could inevitably be deadly (Ibid). In addition, for the CAQ it was evident that Quebecers were more than just frustrated with their politicians, their practices and their policies. Rather, the situation had grown far worse. In the party’s platform, the growth of the situation is outlined as follows: “beyond partisan considerations and crises that too often shake the political scene, the long-standing deleterious situation facing Québec has led to an unprecedented alienation of citizens with regard to our insti- tutions. This threatens the very credibility of the State and, hence, our collective capacity to undertake the reforms that Québec needs” (Coalition Avenir Québec, 2012: 12). In other words, the situation was now more serious and the time had come to act. But are Quebecers really as frustrated as the CAQ suggests? The literature on political support is not immediately helpful on this matter because it has not always been consistent. There is certainly plenty of evidence which suggests that citizens in advanced industrial democracies, Canada included, may not be all that content with the way their democracies function and the players and the institutions involved (see for instance Nye, Jr., Zelikow, & King, 1997; Norris, 1999; Pharr & Putnam, 2000; Dalton, 2006; Nevitte, 1996, 2002; Howe, 2010; Bastedo, Chu, Hilderman, & Turcotte, 2011). However, interpretations of the cross-time and cross-national findings tend to vary. Most concur that support for political communities and de- mocratic principles in advanced industrial democracies remains generalizably strong. That said, Dalton (2004) argues that citi- zens have become more critical of their political authorities and that they have become less confident in their political institu- tions. From his perspective, “most citizens in Western democ- racies are now distrustful of politicians, skeptical about political parties, and significantly less confident in their parliaments. Moreover, these patterns have persisted over several decades and across succeeding government administrations” (2006: 257). Norris (2011) on the other hand claims that such an inter- pretation “exaggerates the extent of political disaffection” (241). From her perspective, “trust in political institutions such as national governments, parliaments, and parties display sys- tematic and persistent contrasts among established democracies in Western Europe and the United States. The longitudinal evi- dence clearly demonstrates that fluctuations over time usually prove far more common than straightforward linear or uniform downward trends” (p. 241). In addition, as part of this debate, there has been practically no sustained analysis of political support at the sub-national level. So to this point, we have not seen much direct and sys- tematic evidence relating to how much confidence Quebecers have in their core government institutions and whether their perceptions vary across different levels of government. That said however, there have been some recent data reported that suggest that the CAQ’s claims may indeed deserve some fur- ther exploration. For example, prior to the 2012 Quebec elec- tion, it was widely cited that about 70% of Quebecers were not supportive of the provincial government under leader Jean Charest (see for example, Macpherson, 2012). And more re- cently, other evidence suggests that this lack of support may be growing more diffuse. The fourth Democracy Report conducted by Samara claims that satisfaction with the way that democracy works in Canada has declined by 20% since 2004 and even more so among Francophones in Quebec (Samara, 2012). Where the literature seems less inconclusive is with regards to the role of performance in determining levels of political support. Dalton (2004) for instance suggests that “the expand- ing diversity of policy goals may create a dynamic in which dissatisfaction easily develops.... as new issues of environ- mental quality, minority rights, cultural issues and other matters have entered the political agenda” (152). In other words, the in- creased diversity of policy demands may make it more difficult for contemporary government institutions to perform and re- spond to citizens’ preferences. Similarly, Norris (2011) contends that in many societies, governments are simply not meeting their citizens’ democratic aspirations. “Overall it appears that closing the democratic deficit is therefore largely about strengthening processes of democracy and the actual quality of governance so that per- formance meets rising citizen expectations” (245). Also, in a recent Canadian study, Bastedo and her colleagues (2011) found that the most disengaged Canadians feel that the political system does not work for them. Either because they receive little help or because their concerns are disregarded, “the dis- engaged have learned from personal experience that engage- ment is futile” (3-4). Based on the literature, corruption and ethical misconduct probably also have implications for political support. Previous studies show a consistent link between corruption in politics and the way that citizens feel about their political system. “Not only do confidence levels mirror to a remarkable degree swings in the number of misconduct reports [presented during a] period in question, but causation is strongly implied by the fact that a spike in citizens’ dissatisfaction with politics follows closely on the heels of a spike in misconduct reports” (Pharr, 2000: 195-197; also see dellaPorta, 2000). From this, it is not too unreasonable to assume that a sustained period with insufficient government performance and corrupt government practices might contribute to fueling public cynicism about the political process, an erosion of public confidence in political authorities, and detract from public confidence in government institutions (Bastedo, Chu, Hilderman, & Turcotte, 2011; Dalton, 2006). But is that the case in Quebec? What does the evidence sug- gest? Findings from the Comparative Provincial Election Project In this analysis, we draw on data from an online survey of Quebecers conducted as part of the country-wide Comparative Provincial Election Project (CPEP). The first study of its kind, this project is designed specifically to examine political support and electoral behaviour across all Canadian provinces using a standard questionnaire. The Quebec component of the CPEP was administered immediately after the recent Quebec election which was held on September 4th, 2012. The period of data collection extended for slightly more than one month, from September 5th, 2012 until October 11th, 2012, and resulted in a Copyright © 2013 SciRes. 185  M. KANJI, K. TANNAHILL random sample of 1010 respondents. The survey was made available in both French and English and the data were col- lected through an internet survey platform licensed by Abacus Data. Most participants (728) were drawn from a larger online panel of Canadians which was recruited randomly by phone invitation. The remainder of the sample was randomly invited to participate through the use of Interactive Voice Response technology. Data from the Quebec component of the CPEP are unique in that they allow us to look in detail at the degree of confidence that Quebecers express in a variety of government institutions across different levels of government1. For instance, the find- ings in Figure 1 report the proportion of Quebecers who ex- press at least some confidence in four core government institu- tions across three different levels of government2. Governments, political parties, legislatures and the civil ser- vice constitute some of the major political and non-political bodies in our democratic process. In a well-functioning democ- racy we would expect that most citizens would have at least some confidence in each of these core institutions, regardless of whether it is at the municipal, provincial or federal levels. Yet, these data suggest that only about two in five Quebecers ex- press any degree of confidence in these major government in- stitutions at either the municipal (43%) or provincial (41%) levels. Moreover, even fewer Quebecers (less than 30%) ex- press any confidence in these core government institutions at the federal level3. These findings lend some support to the CAQ’s claims in that they demonstrate that a sizable majority of Quebecers have either “not a lot of confidence” or “no confidence at all” in four core provincial government institutions. Also, this preliminary evidence suggests that Quebecers can and do distinguish be- tween the amount of confidence that they place in government institutions at different levels of government. Despite the on- going televised investigation of the Charbonneau Commission into allegations of collusion and corruption in Quebec’s con- struction industry, the awarding of government contracts and party financing, during which several witnesses have offered damaging testimony, the evidence from late 2012 suggests that Quebecers still maintain more confidence in their municipal and provincial governmental institutions than they have in their federal government institutions. Keep in mind however that this survey was not in the field when key evidence began to surface about collusion and cor- ruption in the city of Montreal and it is certainly possible that Quebecers’ confidence levels may sink even lower as the Commission carries out its mandate over the course of 2013. Then again, it is also possible that lower levels of confidence in federal governmental institutions in Quebec may actually re- flect a distinct lack of faith that has resulted due to a long and bitter struggle over constitutional politics and Quebec inde- pendence. Alternatively, it may even be that Quebecers have never really warmed up to the Harper government or its style of governance and this too might be partly to blame for their lower 43% 41% 28% 0% 5% 10% 15% 20% 25% 30% 35% 40% 45% 50% Municipal levelProvincial levelFederal level Percentage of Quebecers who express at least some confidence in governments, political parties, legislatures and the civil service Level of government Municipal level Provincial level Federal level Figure 1. Percentage of Quebecers who express at least some confi- dence in all four of the following government institutions— governments, political parties, legislatures and the civil ser- vice—at various levels of government n = 1010; Source: CPEP, Quebec Election Survey, 2012. level of confidence in federal governmental institutions4. Lastly, there is also the possibility that regardless of the provinces in which they reside, citizens may typically express less confidence in their federal government institutions than they do in their municipal and provincial counterparts because they see the latter as being more proximate and having a more direct and positive relevance and influence in their daily lives. In fact, the CPEP does provide some evidence that is consistent with this argument. For instance, confidence in the federal gov- ernment tends generally, across most provinces for which we have already collected data, to be consistently lower than con- fidence in either the provincial or municipal governments (see Figure 2). This might also suggest that Canadians are more critical of their federal government institutions than they are of either the municipal or provincial governments. Further inves- tigation is required before we can be more certain as to the authenticity of this discrepancy and why it exists. In this paper, however, our primary objectives are to examine what Quebe- cers think about their provincial government institutions and to better understand why. Turning next to look more closely at how Quebecers’ feel about each of their four core provincial government institu- tions, Figure 3 illustrates that very few citizens (never more than 15%) express “a lot of confidence” in either their National Assembly (15%), the provincial civil service (13%), the pro- vincial government (11%) or their provincial political parties (3%). In fact, the reality is that even when we examine support for each of these institutions on an independent basis, the bulk of the evidence indicates that most Quebecers express only “some”, “not a lot” or “no confidence at all” in their core pro- vincial government institutions. In terms of potential explanations, the descriptive findings put into play several plausibilities. For instance, with respect to the CAQ’s suggestion that poor institutional performance may be partly to blame, the data indicate that Quebecers evaluate non-political governmental institutions more positively than 4Preliminary evidence from the Quebec component of the CPEP suggests that satisfaction with the Harper government’s performance in Quebec (29% is extraordinarily low, more so than in any other province for which we currently have data (Alberta: 58%, Manitoba: 57%, Saskatchewan: 76%, Ontario: 48%, PEI: 52% and Newfoundland and Labrador: 36%). These results are based on responses to the following question: “How satisfied are you with the performance of the federal government under Stephen Har- per?” The findings reported indicate the proportion of respondents who are “very satisfied” and “fairly satisfied”. 1Extensive comparisons of citizens’ confidence across different levels o government are not possible for all provinces included in the CPEP. The standardized root questionnaire employed in the CPEP was expanded con- siderably in Quebec. 2See Appendix for more details about the operationalization of the variables employed in this analysis. 3All of the findings presented in this analysis are consistent when examined using both the weighted and unweighted data. Copyright © 2013 SciRes. 186 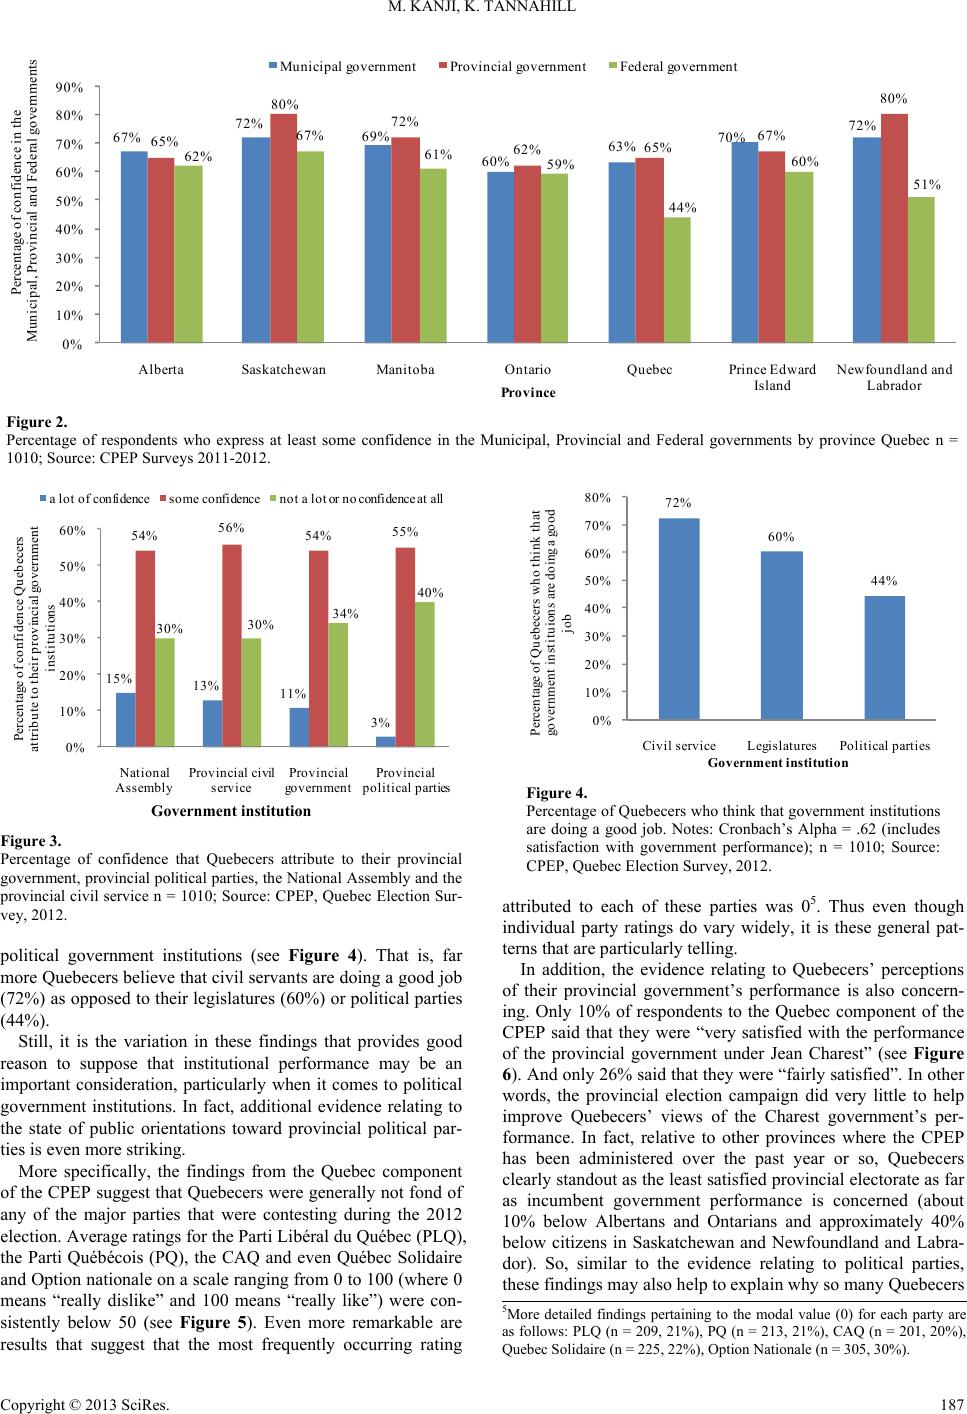 M. KANJI, K. TANNAHILL Copyright © 2013 SciRes. 187 67% 72% 69% 60% 63% 70% 72% 65% 80% 72% 62% 65% 67% 80% 62% 67% 61% 59% 44% 60% 51% 0% 10% 20% 30% 40% 50% 60% 70% 80% 90% AlbertaSaskatchewanManitobaOntarioQuebecPrince Edward Island Newfoundland and Labrador Percentage of confidence in the Municipal, Provincial and Federal governments Pro v i n ce Municipal governmentProvincial governmentFederal government Figure 2. Percentage of respondents who express at least some confidence in the Municipal, Provincial and Federal governments by province Quebec n = 1010; Source: CPEP Surveys 2011-2012. 72% 60% 44% 0% 10% 20% 30% 40% 50% 60% 70% 80% Civil serviceLegislaturesPolitical parties Percentage of Quebecers who think that government instituions are doing a good job Government institution 15% 13% 11% 3% 54% 56% 54% 55% 30% 30% 34% 40% 0% 10% 20% 30% 40% 50% 60% National Assembl Provincial civil service Provincial o vern men t Provincial olitical art ies Percentage of confidence Quebecers attribute to their provincial government institutions a lot of confidencesome confidencenot a lot or no confidence at all Figure 4. Percentage of Quebecers who think that government institutions are doing a good job. Notes: Cronbach’s Alpha = .62 (includes satisfaction with government performance); n = 1010; Source: CPEP, Quebec Election Survey, 2012. Government institution Figure 3. Percentage of confidence that Quebecers attribute to their provincial government, provincial political parties, the National Assembly and the provincial civil service n = 1010; Source: CPEP, Quebec Election Sur- vey, 2012. attributed to each of these parties was 05. Thus even though individual party ratings do vary widely, it is these general pat- terns that are particularly telling. political government institutions (see Figure 4). That is, far more Quebecers believe that civil servants are doing a good job (72%) as opposed to their legislatures (60%) or political parties (44%). In addition, the evidence relating to Quebecers’ perceptions of their provincial government’s performance is also concern- ing. Only 10% of respondents to the Quebec component of the CPEP said that they were “very satisfied with the performance of the provincial government under Jean Charest” (see Figure 6). And only 26% said that they were “fairly satisfied”. In other words, the provincial election campaign did very little to help improve Quebecers’ views of the Charest government’s per- formance. In fact, relative to other provinces where the CPEP has been administered over the past year or so, Quebecers clearly standout as the least satisfied provincial electorate as far as incumbent government performance is concerned (about 10% below Albertans and Ontarians and approximately 40% below citizens in Saskatchewan and Newfoundland and Labra- dor). So, similar to the evidence relating to political parties, these findings may also help to explain why so many Quebecers Still, it is the variation in these findings that provides good reason to suppose that institutional performance may be an important consideration, particularly when it comes to political government institutions. In fact, additional evidence relating to the state of public orientations toward provincial political par- ties is even more striking. More specifically, the findings from the Quebec component of the CPEP suggest that Quebecers were generally not fond of any of the major parties that were contesting during the 2012 election. Average ratings for the Parti Libéral du Québec (PLQ), the Parti Québécois (PQ), the CAQ and even Québec Solidaire and Option nationale on a scale ranging from 0 to 100 (where 0 means “really dislike” and 100 means “really like”) were con- sistently below 50 (see Figure 5). Even more remarkable are results that suggest that the most frequently occurring rating 5More detailed findings pertaining to the modal value (0) for each party are as follows: PLQ (n = 209, 21%), PQ (n = 213, 21%), CAQ (n = 201, 20%), Quebec Solidaire (n = 225, 22%), Option Nationale (n = 305, 30%).  M. KANJI, K. TANNAHILL 40 47 38 42 32 0 10 20 30 40 50 PLQPQCAQQuebec Solidaire Option Nationale Quebecers' average ratings of their major provincial political parties Provincial political party Figure 5. Quebecers’ average ratings of their major political parties. Notes: The average results reported above are based on the Quebecers’ responses to the following question: “Using a 100-point scale, where zero means that you really dislike it and 100 means that you really like it, how do you feel about the following?” Stan- dard deviation: PLQ (31), PQ (35), CAQ (29), Quebec Solidaire (33) and Option Nationale (31); n = 1010; Source: CPEP, Que- bec Election Survey, 2012. 76% 74% 61% 58% 48% 47% 36% 0% 10% 20% 30% 40% 50% 60% 70% 80% Percentage satisfied with the performance of the provincial government Provincial government Figure 6. Satisfaction with provincial government performance. Notes: The average results reported above are based on the Quebecers’ responses to the following question: “How satisfied are you with the performance of the provincial government under Jean Charest?”; Quebec n = 1010; Source: CPEP Surveys, 2011-2012. lack a consistent and strong sense of confidence in provincial government institutions. Alternatively, there is also the possibility that Quebecers may be reacting to concerns relating to unethical behaviour and the lack of integrity that they perceive on the part of government and political authorities. With the Charbonneau Commission uncovering evidence of shady conduct on the part of govern- ment officials and political parties in the handling of public finances and these damning proceedings being televised and discussed on a day to day basis, it would be highly surprising indeed if concerns about ethics and honesty did not weigh at least somewhat on many Quebecers’ minds. The evidence to this point (see Figure 7) suggests that at the provincial level, the government as a whole may have paid a heavier price than individual Members of the National Assembly (MNAs). On a scale ranging from 0 to 10, where 0 means “completely dis- honest and unethical” and 10 means “completely honest and ethical”, the findings indicate that more than a majority of 55% 46% 32% 0% 10% 20% 30% 40% 50% 60% Provincial government The PremierYour MNA Percentage indicating that government authorities are 5 or less Government authority Figure 7. Quebecers’ perceptions of the honesty and ethics of their various gov- ernment authorities. Notes: The results reported above are based on the Quebecers’ responses to the following question: “On a scale of 0 to 10, where zero is completely dishonest and unethical and 10 is completely honest and ethical, how would you rate the honesty and ethical stan- dards of the following these days?” Cronbach’s Alpha = .79; n = 1010; Source: CPEP, Quebec Election Survey, 2012. Quebecers (55%) gave the provincial government a rating of 5 or less. By comparison, 46% of Quebecers gave the Premier a rating of 5 or less and 32% of the electorate gave their respec- tive MNAs a rating of 5 or less. Thus there is evidence to sup- port that for many Quebecers concerns of this sort may have some bearing on their institutional confidence. It is also not difficult to conceive of how times such as these might fuel public cynicism and possibly even detract from the public’s support for political authorities, both of which may have further implications for Quebecers’ confidence in their provincial government institutions. The findings from our post- election survey provide varying degrees of support for each of these propositions. For instance, with regards to the prevalence of cynical view- points, the data suggest that four in five Quebecers (82%) be- lieve that “rich people and big business have too much influ- ence in politics” (see Figure 8). Moreover, nearly half of Que- becers (46%) agree that “parties buy elections and votes” and 44% feel that “we would probably solve most of our big prob- lems if decisions could be brought back to the people at the grass roots”. Lastly, 39% of citizens in Quebec concur that “most politicians are corrupt”. Also, in terms of confidence in political authorities, the findings at the provincial level indicate that only 13% of Quebecers have “a lot” of confidence in either their Premier or their MNA. Most have only “some confidence” in either of these political authorities (48% in the Premier and 55% in their respective MNAs). In order to test which of these alternative explanations are systematically linked to low levels of public confidence in pro- vincial government institutions, and whether certain explana- tions are more relevant than others, we examined each of these possibilities against the combined weight of the others using multivariate regression analysis6. In addition, in order to make the test as rigorous as possible, we also took into account a variety of other cultural and demographic factors that might be partly responsible for the public’s current outlooks toward their provincial government institutions. For instance, Dalton’s (2006) cognitive mobilization thesis claims that citizens today differ from their predecessors in that they are better educated, more interested and more engaged in politics, and because they have better access to information than generations past (see also 6Specifically, we employed Ordinary Least Squares regression analysis. Copyright © 2013 SciRes. 188  M. KANJI, K. TANNAHILL 82% 46% 44% 39% 0% 10% 20% 30% 40% 50% 60% 70% 80% 90% Rich people and big business have too much influence in politics Parties buy elections and votes We would probably solve most of our big problems if decisions could be brought back to the people at the grassroots Most politicians are corrupt Percentage that agree Figure 8. Quebecers’ cynical views toward democracy. Notes: Cronbach’s Alpha = .74; n = 1010; Source: CPEP, Quebec Election Survey, 2012. Norris, 1999, 2011). By itself, this transformation may contrib- ute to creating better citizens who have a greater conviction for the democratic process. However, Nevitte (2002) suggests that cognitive mobilization and the information explosion may also contribute to a growing efficacy gap in politics, in which “peo- ple’s sense of their own subjective political competence has been sustained, [while] their evaluations of the responsiveness of their own political system have been declining” (22). The media malaise argument forwarded by Patterson (1996) and others (see, for instance, Norris 2000) provides another poten- tially generalizable explanation by suggesting that greater pub- lic exposure to negative news may also be partly to blame for people’s declining levels of political support across various societies. Thus, it is possible that this particular development might also be at least partly responsible for how many Quebe- cers feel about their government institutions7. In addition, Inglehart and others (1990, 1997, Inglehart & Welzel, 2005; Nevitte, 1996) claim that post-materialist value change has meant that younger generations, particularly in ad- vanced industrial societies such as Canada, have become less deferential and more inclined to challenge institutional author- ity. This too could be partly to blame for lower levels of confi- dence in provincial government institutions. Similarly, Put- nam’s theory (2000) of declining social capital suggests that less interaction between citizens, due to factors such as more time spent watching TV and commuting (just to name a few), reduces inter-personal trust and creates a climate in which citi- zens are not as likely to feel as invested in or confident in their government institutions. Thus, some measure of inter-personal trust also needs to be taken into account. Furthermore, besides such cultural influences, there is also the possibility that Quebecers’ less positive attitudes toward their provincial government institutions may be directly tied to various demographic and background characteristics. For in- stance, Quebec society is well known for the healthy tension that exists between federalists, nationalists and those who fa- vour independence (namely sovereignists and separatists). Due to the province’s historical struggle for distinct status and its past experiences with the independence movement, it is not unreasonable to assume that federalists and nationalists may have somewhat less confidence in their provincial government institutions than sovereignists and separatists. Likewise, given the strong role that the provincial govern- ment has historically played in preserving and favouring the French culture in Quebec, it is also plausible that Francophones may place greater confidence in their provincial government institutions than Anglophones. Similarly, other unequal effects engendered by various provincial level policy outcomes may also make factors such as sex, place of birth, income and espe- cially age relevant. Recall for instance, that prior to the 2012 Quebec election, significant numbers of young people in Que- bec were embroiled in an extended student protest over the raising of tuition fees for post-secondary education. This even- tually resulted in the implementation of emergency legislation (Bill 78), which many in the province characterized as oppres- sive and restrictive of democratic rights. It would not be unrea- sonable therefore to expect that policy outcomes such as this may have had negative consequences for young people’s con- fidence in provincial government institutions (Patriquin, 2012). Not surprisingly, the data presented in Table 1 suggest that Quebecers’ confidence in their government institutions is driven by a variety of factors8. Among demographic and background characteristics for in- stance, the evidence shows that younger generations and Eng- lish-speaking Quebecers express less confidence in their pro- vincial government institutions than do older generations or Francophones. Also, the evidence indicates that federalists place less confidence in their provincial government institutions than do sovereignists and separatists. Neither of these findings is particularly surprising or contrary to what we would expect. When it comes to cultural influences however, only cognitive mobilization has a significant positive effect. On average, more educated, interested and engaged citizens tend to be more con- fident in their provincial government institutions than those who are less educated, interested and disengaged. Conversely, neither the frequency of media exposure, the efficacy gap, post- materialist value change, authority orientations, nor inter-per- sonal trust have any significant direct effects. This does not mean however, that these factors are entirely irrelevant. It is still possible that they may contribute indirectly in other ways and this is something that needs to be further investigated in future investigations. Note too that the evidence in Table 1 also shows that factors such as institutional performance, integrity, cynicism, and spe- cific support for political authorities all turn out to be statisti- cally significant even after we control for various demographic, background, and cultural influences. Some of these determinants, however, are notably more im- portant than others. For instance, institutional performance is by far the most important explanatory factor overall. The better that Quebecers feel about how their government institutions perform, the more confident they become. In addition, support for the Premier is also distinctly relevant. The more confidence 8Although our preliminary background analysis suggests that a few groups, such as young Quebecers and Anglophones, may be more consistently dis- gruntled than older Quebecers and Francophones, there is no evidence to suggest that any of the determinants in this multivariate regression analysis are concerningly inter-connected. Moreover, this analysis simultaneously controls for both age, language and a variety of demographic and back- ground factors. 7Note however, that more recent evidence seems to contradict the media- malaise proposition in particular. Norris (2011), for instance finds that: “...users of television and radio news proved more satisfied with democracy, not less. Moreover, regular use of all these media reduced the democratic deficit, or the gap between expectations and perceived performance” (244). Copyright © 2013 SciRes. 189 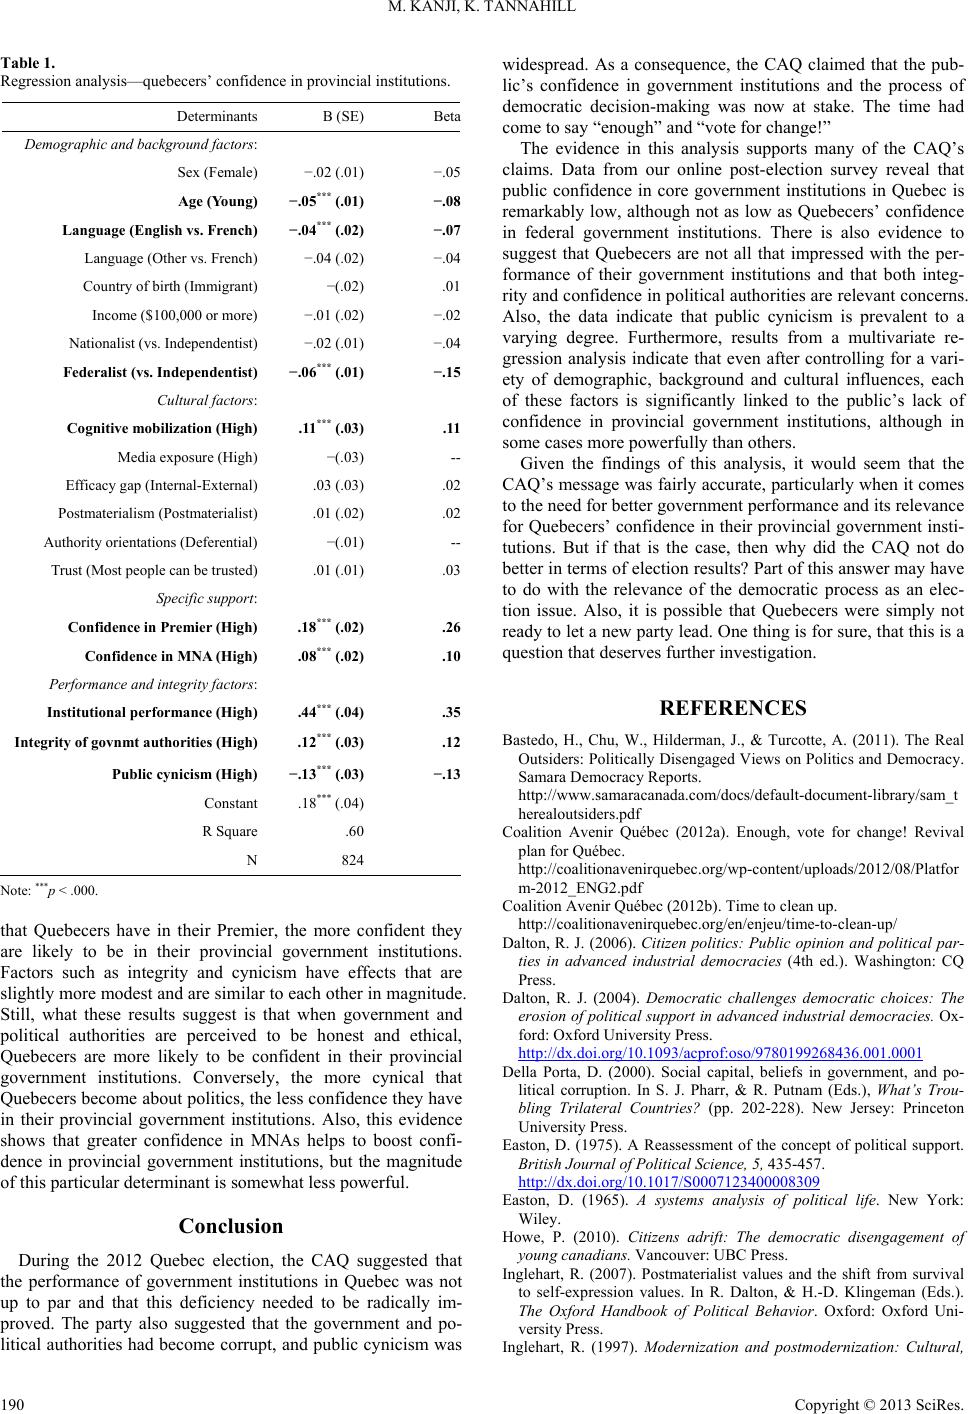 M. KANJI, K. TANNAHILL Table 1. Regression analysis—quebecers’ confidence in provincial institutions. DeterminantsB (SE)Bet Demographic and background factors: Sex (Female)−.02 (.01)−.05 Age (Young)−.05*** (.01)−.08 Language (English vs. French)−.04*** (.02)−.07 Language (Other vs. French)−.04 (.02)−.04 Country of birth (Immigrant)−(.02) .01 Income ($100,000 or more)−.01 (.02)−.02 Nationalist (vs. Independentist)−.02 (.01)−.04 Federalist (vs. Independentist)−.06*** (.01)−.15 Cultural factors: Cognitive mobilization (High).11*** (.03).11 Media exposure (High)−(.03) -- Efficacy gap (Internal-External).03 (.03).02 Postmaterialism (Postmaterialist).01 (.02).02 Authority orientations (Deferential)−(.01) -- Trust (Most people can be trusted).01 (.01).03 Specific support: Confidence in Premier (High).18*** (.02).26 Confidence in MNA (High).08*** (.02).10 Performance and integrity factors: Institutional performance (High).44*** (.04).35 Integrity of govnmt authorities (High).12*** (.03).12 Public cynicism (High)−.13*** (.03)−.13 Constant .18*** (.04) R Square.60 N824 Note: ***p < .000. that Quebecers have in their Premier, the more confident they are likely to be in their provincial government institutions. Factors such as integrity and cynicism have effects that are slightly more modest and are similar to each other in magnitude. Still, what these results suggest is that when government and political authorities are perceived to be honest and ethical, Quebecers are more likely to be confident in their provincial government institutions. Conversely, the more cynical that Quebecers become about politics, the less confidence they have in their provincial government institutions. Also, this evidence shows that greater confidence in MNAs helps to boost confi- dence in provincial government institutions, but the magnitude of this particular determinant is somewhat less powerful. Conclusion During the 2012 Quebec election, the CAQ suggested that the performance of government institutions in Quebec was not up to par and that this deficiency needed to be radically im- proved. The party also suggested that the government and po- litical authorities had become corrupt, and public cynicism was widespread. As a consequence, the CAQ claimed that the pub- lic’s confidence in government institutions and the process of democratic decision-making was now at stake. The time had come to say “enough” and “vote for change!” The evidence in this analysis supports many of the CAQ’s claims. Data from our online post-election survey reveal that public confidence in core government institutions in Quebec is remarkably low, although not as low as Quebecers’ confidence in federal government institutions. There is also evidence to suggest that Quebecers are not all that impressed with the per- formance of their government institutions and that both integ- rity and confidence in political authorities are relevant concerns. Also, the data indicate that public cynicism is prevalent to a varying degree. Furthermore, results from a multivariate re- gression analysis indicate that even after controlling for a vari- ety of demographic, background and cultural influences, each of these factors is significantly linked to the public’s lack of confidence in provincial government institutions, although in some cases more powerfully than others. Given the findings of this analysis, it would seem that the CAQ’s message was fairly accurate, particularly when it comes to the need for better government performance and its relevance for Quebecers’ confidence in their provincial government insti- tutions. But if that is the case, then why did the CAQ not do better in terms of election results? Part of this answer may have to do with the relevance of the democratic process as an elec- tion issue. Also, it is possible that Quebecers were simply not ready to let a new party lead. One thing is for sure, that this is a question that deserves further investigation. REFERENCES Bastedo, H., Chu, W., Hilderman, J., & Turcotte, A. (2011). The Real Outsiders: Politically Disengaged Views on Politics and Democracy. Samara Democracy Reports. http://www.samaracanada.com/docs/default-document-library/sam_t herealoutsiders.pdf Coalition Avenir Québec (2012a). Enough, vote for change! Revival plan for Québec. http://coalitionavenirquebec.org/wp-content/uploads/2012/08/Platfor m-2012_ENG2.pdf Coalition Avenir Québec (2012b). Time to clean up. http://coalitionavenirquebec.org/en/enjeu/time-to-clean-up/ Dalton, R. J. (2006). Citizen politics: Public opinion and political par- ties in advanced industrial democracies (4th ed.). Washington: CQ Press. Dalton, R. J. (2004). Democratic challenges democratic choices: The erosion of political support in advanced industrial democracies. Ox- ford: Oxford University Press. http://dx.doi.org/10.1093/acprof:oso/9780199268436.001.0001 Della Porta, D. (2000). Social capital, beliefs in government, and po- litical corruption. In S. J. Pharr, & R. Putnam (Eds.), What’s Trou- bling Trilateral Countries? (pp. 202-228). New Jersey: Princeton University Press. Easton, D. (1975). A Reassessment of the concept of political support. British Journal of Political Science, 5, 435-457. http://dx.doi.org/10.1017/S0007123400008309 Easton, D. (1965). A systems analysis of political life. New York: Wiley. Howe, P. (2010). Citizens adrift: The democratic disengagement of young canadians. Vancouver: UBC Press. Inglehart, R. (2007). Postmaterialist values and the shift from survival to self-expression values. In R. Dalton, & H.-D. Klingeman (Eds.). The Oxford Handbook of Political Behavior. Oxford: Oxford Uni- versity Press. Inglehart, R. (1997). Modernization and postmodernization: Cultural, Copyright © 2013 SciRes. 190  M. KANJI, K. TANNAHILL Copyright © 2013 SciRes. 191 economic and political change in 43 societies. Princeton: Princeton University Press. Inglehart, R., & Welzel, C. (2005). Modernization, cultural change, and democracy: The human development sequence. Cambridge: Cambridge University Press. Macpherson, D. (2012). Weak Government, Weak Opposition. Mont- real Gazette, 5 September 2012. http://www2.canada.com/montrealgazette/news/editorial/story.html?i d=17b6fc3a-2a88-433a-913f-978180f80a3c&p=1 Nevitte, N. (2002). Value change and governance in Canada. Toronto: University of Toronto Press. Nevitte, N. (1996). The decline of deference: canadian value change in cross-national perspective. Peterborough: Broadview Press. Norris, P. (2011). Democratic deficit: Critical citizens revisited. New York: Cambridge University Press. http://dx.doi.org/10.1017/CBO9780511973383 Norris, P. (2000). A virtuous circle? The impact of political communi- cations in post-industrial democracies. Cambridge, UK: Cambridge University Press. http://dx.doi.org/10.1017/CBO9780511609343 Norris, P. (1999). Critical citizens: Global support for democratic go- vernance. Oxford: Oxford University Press. Nye, J., Jr., Zelikow, P. D., & King, D. C. (1997). Why people don’t trust government. Cambridge: Harvard University Press. Patriquin, M. (2012). Quebec’s new ruling class: An attempt to end demonstrations against tuition hikes has only managed to escalate into a political and social stalemate. Maclean's. http://www2.macleans.ca/2012/05/30/quebecs-new-ruling-class/ Patterson, T. E. (1994). Out of order: An incisive and boldly original critique of the news media’s domination of America’s political proc- ess. New York: Vintage Books. Pharr, S. J. (2000). Officials’ misconduct and public distrust: Japan and the Trilateral democracies. In S. J. Pharr, & R. Putnam (Eds.). What’s Troubling Trilateral Countries? New Jersey: Princeton Uni- versity Press. Pharr, S. J., & Putnam, R. (2000). What’s troubling trilateral countries? New Jersey: Princeton University Press. Putnam, R. (2000). Bowling alone: The collapse and revival of Ameri- can Community. New York: Simon & Schuster. Samara (2012). Who’s the boss? Canadians’ views on their democracy. Samara Democracy Report n. 4. http://www.samaracanada.com/what-we-do/current-research/who%2 7s-the-boss-  M. KANJI, K. TANNAHILL Appendix—Operationalization of Variables Confidence in Provincial Government Institutions (Questions and Coding) Question: Please indicate how much confidence you have in the following institutions. a) The provincial government (“no confidence at all” = 0, “not a lot of confidence” = .33, “some confidence” = .66, “a lot of confidence” = 1). b) Provincial political parties (“no confidence at all” = 0, “not a lot of confidence” = .33, “some confidence” = .66, “a lot of confidence” = 1). c) Provincial civil service (“no confidence at all” = 0, “not a lot of confidence” = .33, “some confidence” = .66, “a lot of confidence” = 1). d) National Assembly (“no confidence at all” = 0, “not a lot of confidence” = .33, “some confidence” = .66, “a lot of confidence” = 1). Confidence in Federal Government Institutions (Questions and Coding) Question: Please indicate how much confidence you have in the following institutions. a) The federal government (“no confidence at all” = 0, “not a lot of confidence” = .33, “some confidence” = .66, “a lot of confidence” = 1). b) Federal political parties (“no confidence at all” = 0, “not a lot of confidence” = .33, “some confidence” = .66, “a lot of confidence” = 1). c) Federal civil service (“no confidence at all” = 0, “not a lot of confidence” = .33, “some confidence” = .66, “a lot of confidence” = 1). d) Parliament (“no confidence at all” = 0, “not a lot of con- fidence” = .33, “some confidence” = .66, “a lot of confi- dence” = 1). Confidence in Municipal Government Institutions (Questions and Coding) Question: Please indicate how much confidence you have in the following institutions. a) The municipal government (“no confidence at all” = 0, “not a lot of confidence” = .33, “some confidence” = .66, “a lot of confidence” = 1). b) Municipal parties (“no confidence at all” = 0, “not a lot of confidence” = .33, “some confidence” = .66, “a lot of con- fidence” = 1). c) Municipal civil service (“no confidence at all” = 0, “not a lot of confidence” = .33, “some confidence” = .66, “a lot of confidence” = 1). d) Municipal councils (“no confidence at all” = 0, “not a lot of confidence” = .33, “some confidence” = .66, “a lot of confidence” = 1). Evaluations of Government Institutions (Questions and Coding) Question: How good of a job are the following institutions doing overall? a) Civil service (“not good at all” = 0, “not very good” = .33, “quite good” = .66, “very good” = 1). b) Political parties (“not good at all” = 0, “not very good” = .33, “quite good” = .66, “very good” = 1). c) Legislatures (“not good at all” = 0, “not very good” = .33, “quite good” = .66, “very good” = 1). Average Ratings of Political Parties (Questions and Coding) Question: Using a 100-point scale, where zero means that you really dislike it and 100 means that you really like it, how do you feel about the following? a) Québec Liberal Party (“really dislike it” = 0, “really like it” = 100). b) Parti Québécois (“really dislike it” = 0, “really like it” = 100). c) Coalition Avenir Québec (“really dislike it” = 0, “really like it” = 100). d) Québec Solidaire (“really dislike it” = 0, “really like it” = 100). e) Option Nationale (“really dislike it” = 0, “really like it” = 100). Satisfaction with Provincial Government Performance (Questions and Coding) Question (in Saskatchewan): How satisfied were/are you with the performance of the PROVINCIAL government under Brad Wall? Would you say very satisfied, fairly satisfied, not very satisfied, or not satisfied at all? (“not satisfied at all” = 0, “not very satisfied” = .33, “fairly satisfied” = .66, “very satis- fied” = 1). Question (in Newfoundland and Labrador): How satisfied were/are you with the performance of the PROVINCIAL gov- ernment under Kathy Dunderdale? Would you say very satis- fied, fairly satisfied, not very satisfied, or not satisfied at all? (“not satisfied at all” = 0, “not very satisfied” = .33, “fairly satisfied” = .66, “very satisfied” = 1). Question (in Manitoba): How satisfied were/are you with the performance of the PROVINCIAL government under Greg Selinger? Would you say very satisfied, fairly satisfied, not very satisfied, or not satisfied at all? (“not satisfied at all” = 0, “not very satisfied” = .33, “fairly satisfied” = .66, “very satis- fied” = 1). Question (in Prince Edward Island): How satisfied were/are you with the performance of the PROVINCIAL government under Robert Ghiz? Would you say very satisfied, fairly satis- fied, not very satisfied, or not satisfied at all? (“not satisfied at all” = 0, “not very satisfied” = .33, “fairly satisfied” = .66, “very satisfied” = 1). Question (in Ontario): How satisfied were/are you with the performance of the PROVINCIAL government under Dalton McGuinty? Would you say very satisfied, fairly satisfied, not very satisfied, or not satisfied at all? (“not satisfied at all” = 0, “not very satisfied” = .33, “fairly satisfied” = .66, “very satis- fied” = 1). Question (in Alberta): How satisfied were/are you with the performance of the PROVINCIAL government under Alison Redford? Would you say very satisfied, fairly satisfied, not very satisfied, or not satisfied at all? (“not satisfied at all” = 0, “not very satisfied” = .33, “fairly satisfied” = .66, “very satis- fied” = 1). Question (in Quebec): How satisfied are you with the per- Copyright © 2013 SciRes. 192  M. KANJI, K. TANNAHILL formance of the PROVINCIAL government under Jean Charest? Would you say very satisfied, fairly satisfied, not very satisfied, or not satisfied at all? (“not satisfied at all” = 0, “not very satis- fied” = .33, “fairly satisfied” = .66, “very satisfied” = 1). Perceptions of the Honesty and Integrity of Various Government Authorities (Questions and Coding) Question: On a scale of 0 to 10, where zero is completely dishonest and unethical and 10 is completely honest and ethical, how would you rate the honesty and ethical standards of the following these days? a) Provincial government (“0” = 0, “1” = .1, “2” = .2, “3” = .3, “4” = .4, “5” = .5, “6” = .6, “7” = .7, “8” = .8, “9” = .9, “10” = 1). b) The Premier (“0” = 0, “1” = .1, “2” = .2, “3” = .3, “4” = .4, “5” = .5, “6” = .6, “7” = .7, “8” = .8, “9” = .9, “10” = 1). c) Your MNA (“0” = 0, “1” = .1, “2” = .2, “3” = .3, “4” = .4, “5” = .5, “6” = .6, “7” = .7, “8” = .8, “9” = .9, “10” = 1). Cynical Views of Democracy (Questions and Coding) Question: For each statement below, please indicate if you strongly agree, agree, disagree, or strongly disagree. a) Rich people and big business have too much influence in politics (“strongly disagree” = 0, “disagree” = .33, “agree” = .66, “strongly agree” = 1). b) Parties buy elections and votes (“strongly disagree” = 0, “disagree” = .33, “agree” = .66, “strongly agree” = 1). c) We would probably solve most of our big problems if de- cisions could be brought back to the people at the grassroots (“strongly disagree” = 0, “disagree” = .33, “agree” = .66, “strongly agree” = 1). d) Most politicians are corrupt (“strongly disagree” = 0, “disagree” = .33, “agree” = .66, “strongly agree” = 1). Confidence in Political Authorities (Questions and Coding) Question: Please indicate how much confidence you have in the following political authorities. a) The Premier (“no confidence at all” = 0, “not a lot of con- fidence” = .33, “some confidence” = .66, “a lot of confi- dence” = 1). b) Your MNA (“no confidence at all” = 0, “not a lot of con- fidence” = .33, “some confidence” = .66, “a lot of confi- dence” = 1). Confidence in Provincial Government Institutions (Standardized Additive Index) This variable adds responses to the four single indicators (see above) measuring confidence in the provincial government, provincial political parties, the provincial civil service and the National Assembly (lowest value = 0, highest value = 1; Cron- bach’s alpha = .83). Institutional Performance (Standardized Additive Index) This variable adds responses to the four single indicators (see above) measuring evaluations of the civil service, political par- ties, legislatures and satisfaction with the provincial government (lowest value = 0, highest value = 1; Cronbach’s alpha = .62). Integrity of Government Authorities (Standardized Additive Index) This variable adds responses to the three single indicators (see above) measuring perceptions toward the honesty and ethics of the provincial government, the Premier and one’s MNA (lowest value = 0, highest value = 1; Cronbach’s alpha = .79). Public Cynicism (Standardized Additive Index) This variable adds responses to the four single indicators (see above) measuring cynical views toward rich people and big business, parties, decision-making and politicians (lowest value = 0, highest value = 1; Cronbach’s alpha = .74). Efficacy Gap (This Standardized Index Is Computed in Three Steps) Step one adds responses to two single indicators measuring external efficacy (Cronbach’s alpha = .71). Question: Thinking about ALL TYPES of government, please indicate if you strongly agree, somewhat agree, somewhat dis- agree, or strongly disagree with each of the following state- ments. a) I don’t think they care much what people like me think (“strongly agree” = 1, “somewhat agree” = 2, “somewhat disagree” = 3, “strongly disagree” = 4). b) Generally, those elected to office soon lose touch with the people (“strongly agree” = 1, “somewhat agree” = 2, “somewhat disagree” = 3, “strongly disagree” = 4). Step two adds responses to two single indicators measuring internal efficacy (Cronbach’s alpha = .50). Question: Thinking about ALL TYPES of government, please indicate if you strongly agree, somewhat agree, somewhat dis- agree, or strongly disagree with each of the following state- ments. a) Sometimes politics and government seem so complicated that a person like me can’t really understand what’s going on (“strongly agree” = 1, “somewhat agree” = 2, “some- what disagree” = 3, “strongly disagree” = 4). b) People like me don’t have any say about what government does (“strongly agree” = 1, “somewhat agree” = 2, “somewhat disagree” = 3, “strongly disagree” = 4). Step three subtracts each respondent’s aggregate value on the additive index for external efficacy from their aggregate value on the additive index for internal efficacy (lowest value = 0, highest value = 1). Authority Orientations (Question and Coding) Question: Is greater respect for authority in the future a: good thing, bad thing, don’t mind either way? (“bad thing” = 0, “don’t mind either way” = .5, “good thing” = 1). Trust (Question and Coding) Question: Generally speaking, would you say that most peo- ple can be trusted or that you need to be very careful in dealing with people? (“we need to be very careful” = 0, “most people can be trusted” = 1). Cognitive Mobilization (Standardized Additive Index) This variable adds together responses to four single indicators Copyright © 2013 SciRes. 193  M. KANJI, K. TANNAHILL Copyright © 2013 SciRes. 194 measuring education levels, interest in the provincial election, interest in provincial politics and discussion of provincial poli- tics (lowest value = 0, highest value = 1; Cronbach’s alpha = .66). 1) Question (education): What is the highest level of educa- tion you have completed? (“some elementary/secondary/ high school, completed secondary/high school” = 0, “some CEGEP, completed CEGEP, some technical, community college, completed technical, community college” = .33, “some university, Bachelor’s degree” = .66, “Master’s degree, Professional degree or doctorate = 1). 2) Question (interest in provincial election): Using a scale from 0 to 10, where 0 means no interest at all and 10 means a great deal of interest, how interested were you in the provincial election? (“0, 1, 2” = 0, “3, 4, 5” = .33, “6, 7, 8” = .66, “9, 10” = 1). 3) Question (interest in provincial politics): Using the same scale (from 0 to 10), how interested are you in provincial politics generally? (“0, 1, 2” = 0, “3, 4, 5” = .33, “6, 7, 8” = .66, “9, 10” = 1). 4) Question (discussion of provincial politics): How often do you discuss provincial politics with others? (“never” = 0, “sometimes” = .33, “often” = .66, “all the time” = 1). Media Exposure (Standardized Additive Index) This variable adds together responses to seventeen single in- dicators measuring exposure to different types of news media (lowest value = 0, highest value = 1; Cronbach’s alpha = .58). Question (media exposure): People get their political infor- mation from a variety of sources. How often do you turn to the following sources to gain in- formation about politics and elections? 1) CTV television (“all the time, often” = 1, “seldom, never” = 0). 2) Global television (“all the time, often” = 1, “seldom, never” = 0). 3) CBC television (“all the time, often” = 1, “seldom, never” = 0). 4) TVA (“all the time, often” = 1, “seldom, never” = 0). 5) LCN (“all the time, often” = 1, “seldom, never” = 0). 6) CBC radio (“all the time, often” = 1, “seldom, never” = 0). 7) Radio Canada (“all the time, often” = 1, “seldom, never” = 0). 8) Le Devoir (“all the time, often” = 1, “seldom, never” = 0). 9) Metro Montreal (“all the time, often” = 1, “seldom, never” = 0). 10) The Globe and Mail (“all the time, often” = 1, “seldom, never” = 0). 11) The National Post (“all the time, often” = 1, “seldom, never” = 0). 12) The Gazette (“all the time, often” = 1, “seldom, never” = 0). 13) Le Journal de Montreal (“all the time, often” = 1, “seldom, never” = 0). 14) La Presse (“all the time, often” = 1, “seldom, never” = 0). 15) 24Heures (“all the time, often” = 1, “seldom, never” = 0). 16) Other websites or blogs (“all the time, often” = 1, “seldom, never” = 0). 17) Print magazines (“all the time, often” = 1, “seldom, never” = 0). Postmaterialism (Questions and Coding) Question: People sometimes talk about what the aims of this country should be for the next ten years. Below are listed some of the goals which different people would give top priority. Would you please say which one of these you, yourself, consider the most important? And which would be the next most impor- tant? (Materialists are coded as those who give top priority to “maintaining order in the nation” and “fighting rising prices” = 0, Postmaterialists are coded as those who give top priority to “giving people more say in important government decisions” and “protecting freedom of speech” = 1, and people who have other combinations of priorities are identified as “mixed” = .5). a) Maintaining order in the nation (“most important” = 1, “next most important” = 0). b) Giving people more say in important government deci- sions (“most important” = 1, “next most important” = 0). c) Fighting rising prices (“most important” = 1, “next most important” = 0). d) Protecting freedom of speech (“most important” = 1, “next most important” = 0). Sex (Question and Coding) Question: Are you…? (“female” = 1, “male” = 0). Age (Question and Coding) Question: Which age group do you fall into? (“61 and over” = 0, “45 to 60” = .33, “30 to 44” = .66, “18 to 29” = 1). Language (Question and Coding) Question: What is your mother tongue? (“English” = 1, “French” = 0) and (“other” = 1, “French” = 0). Country of Birth (Question and Coding) Question: In which country were you born? (“immigrant” = 1, “Canadian” = 0). INCOME (Question and Coding) Question: And now your last year’s total household income before taxes. That includes income from all sources such as savings, pensions, rent, as well as wages. Was it…? (“less than $20,000” = 0, “between $20,001 and $30,000” = .11, “between $30,001 and $40,000” = .22, “between $40,001 and $50,000” = .33, “between $50,001 and $60,000” = .44, “between $60,001 and $70,000” = .55, “between $70,001 and $80,000” = .66, “between $80,001 and $90,000” = .77, “between $90,001 and $100,000” = .88,“more than $100,000” = 1). Nationalist, Federalist or Independents (Question and Coding) Question: In general, do you usually consider yourself a Québec nationalist, separatist, sovereignist, federalist, some- thing else, or none of these? (“nationalist” = 1, “independent” = 0) and (“federalist” = 1, “independent” = 0).
|