A Journal of Software Engineering and Applications, 2013, 6, 43-48
doi:10.4236/jsea.2013.65B009 Published Online May 2013 (http://www.scirp.org/journal/jsea) 43
Salient Region Detection and Analysis Based on the
Weighted Band-Pass Features
Nevrez İmamoğlu, Jose Gomez-Tames, Wenwei Yu
Department of Medical System Engineering, Chiba University, Chiba, Japan.
Email: nevrez.imamoglu@chiba-u.jp, dagothames@chiba-u.jp , yuwill@faculty.chiba-u.jp
Received 2013
ABSTRACT
Researches on visual attention mechanism have revealed that the human visual system (HVS) is sensitive to the higher
frequency components where they are distinctive from their surroundings by popping out. These attentive components
of the scene can be in any form such as edge to texture differences based on the focus of attention of HVS. There are
several visual attention computational models that can yield saliency values of attentive regions on the image. Some of
these models take advantage of band-pass filter regions on spatial domain by computing center-surround differences
with difference of low pass filters. They use either down-sampling that may cause lo ss of information or constant scale
of the filters that may not contain all the necessary saliency information from the image. Therefore, we proposed an
efficient and simple saliency detection model with full resolution and high perceptual quality, which outputs several
band-pass region s by utilizing Fourier transform to obtain attentive reg ions edges to textures from the color image. All
these detected important information with different bandwidth, then, were fused in a weighted manner by giving more
priority to the texture compared to edge based salient regions. Experimental analysis was made for different color
spaces and the model was compared with some relevant state of the art algorithms. As a result, the proposed saliency
detecti on model has promising results based on the a r e a under curve (AUC) perfo rmance evaluatio n metric .
Keywords: Saliency Detection; Low-Level Feature Extraction; Fourier Transform
1. Introduction
The human visual system (HVS) tends to focus its atten-
tion on the regions that pop-ou t significan tly co mpared to
their surroundings on the scene [1,2]. There are bot-
tom-up and top-down mechanisms to aid the selective
attention process of the visual attention (VA) mechanism
on HVS. Bottom-up VA mechanism is a fast process,
which is task independent and generally based on low-
level features, such as intensity, color, orientation, size,
depth, etc. [1,2]. On the other hand, top-down approach
is relatively slower and task-dependent mechanism with
prior knowledge that may require both low-level and
high-level features [2]. These attentive regions can bene-
fit to fast scene analysis, such as detection of proto-ob-
jects [3] or segmentation [4], so several computational
models have been developed [3-8] since the first pro-
posed model of Itti, Koch, and Niebur [5].
Itti, Koch, and Niebur [5] propo sed the first bottom-up
computational model by fusing salient information from
intensity, color and orientation features. Regarding the
intensity and color features, they stated that the salient
regions could be obtained by the center-surround differ-
ences of Gaussian pyramids as band-pass regions in
multi-scale analysis [5]. This biologically plausible
model has become inspiration for several studies of the
saliency computational models in spatial or transform
domains [1-4,6-8], where spatial domain models also
take advantage of center-surround differences or contrast
for the salient region detection.
One of the most computationally time efficient model
was developed by Hou and Zhang’s work [7] in which
they introduced the notion of spectral residual (SR) ap-
proach to find the irregularities in frequency domain.
Compared to the study in [5], SR does not have biologi-
cal plausibility since the salien cy computation disregards
the use of center-surround differences and attention shifts
as in [5]. Instead of using the concept of center-surround
differences, SR utilizes intensity and color chromatic
channels by removing the redundant content on the spec-
tral data to obtain the saliency map [7].
The studies in [5,7] require down-sampling that can
lead loss of information on the image. Also, the resolu-
tion of the saliency maps obtained from [5,7] are less
than the original image size, and the perceptu al quality of
the saliency maps are low. Therefore, Achanta, Hemami,
Estrada and Susstrunk [4] proposed a saliency computa-
tion approach based on the difference of Gaussian to ob-
Copyright © 2013 SciRes. JSEA
Salient Region Detection and Analysis Based on the Weighted Band-Pass Features
44
tain band-pass salient regions. Their algorithm yielded
full resolution salien cy maps with high p erceptual qu ality.
They showed that high perceptual quality could improve
the saliency detection performance when integrated with
external modules such as mean-shift segmentation [4].
However, they didn’t apply any channel normalization or
scaling on the input channels or saliency feature maps,
also the model did not include all possible salient regions
from edge to textures. Hence, we propose a frequency
based model to obtain edge to texture salient regions by
creating band-pass regions with several bandwidths in
Fourier domain. Then, these band-pass salient regions are
weighted and fused to obtain saliency maps for each in-
put channel.
The proposed algorithm demonstrated that use of band-
pass regions in frequency domain by providing attentive
regions from edges to textures is also efficient without
the necessity of downsampling compared to the spectral
residual model. Also, the proposed model provides full
resolution saliency map as the input image with high
perceptual quality. Moreover, the model was tested with
various color space inputs. In addition, proposed algo-
rithm was evaluated quantitatively based on commonly
used area under curve (AUC) metric [9,10]. Experimen-
tal results have promising results by yielding better per-
formance than the compared state of the art algorithms.
2. Methodology of the Proposed Model
A new framework for saliency computation based on
spectral domain is proposed in this paper. The algorithm
uses the band-pass filtering in Fourier transform (FT)
domain with several bandwidths that can represent atten-
tive regions on the image. The higher the bandwidth the
more texture level saliency can be found, and with the
smaller bandwidths at higher frequency edges or corners
can be detected on the image. In this paper, texture rep-
resentations are given higher weights to create uniformity
on the detected salient regions.
2.1. Color Space Transformation
The proposed model, first, converts RGB color image to
the desired color space since the RGB color space does
not represent intensity and color information. In this paper,
saliency performance of proposed algorithm was tested
with four different color spaces that are HSV, YCbCr,
CIE Lab, NTSC where the details of these color spaces
and conversions can be seen in [11,12]. Then, Gaussian
filter is applied to converted color space to remove noise,
and each channel of the transformed image is scaled to
the range {0-25 5} to prevent suppression of any possib le
dominant channel. In Figure 1, three scaled channels of
each color space for a sample image are given.
(a) HSV (b) YCbCr (c) CIE Lb (d) NTSC
Figure 1. (top) sample RGB color image, (a) 1st, 2nd, and 3rd rows are hue, saturation and value, (b) 1st, 2nd, and 3rd rows are
intensity and two color chromatic channels, (c) 1st, 2nd, and 3rd rows are luminance and two color chromatic channels, (d) 1st,
2nd, and 3rd rows are intensity and two color chromatic channels respectively.
Copyright © 2013 SciRes. JSEA
Salient Region Detection and Analysis Based on the Weighted Band-Pass Features 45
2.2. Saliency Map Computation
After the color transformation, similar to the SR in [7],
Fourier transform is applied to each channel of the input
data to obtain amplitude and phase spectrum as in Equa-
tion (1) and (2) below [7]:
 
log
c
Af FIx



c
(1)
 
cc
Pf FIx

(2)
where c is the color channels the input color space data,
Ac(f) and Pc(f) are the log-amplitude and phase spectra of
each channel from image Ic(x) by performing FT opera-
tion F[.],
. is the magnitude calculation of the
Fourier transform obtained from Ic(x), yields the
phase spectrum from angle between the real and imagi-
nary val u e s of spectral dat a.

.
We can use high frequency components by defining
low frequency components as zero with different bandwidth
since low-pass filter was already applied. By changing
the bandwidth of the high-pass filter on high frequency
regions and removing more low frequency components,
we can obtain several salient feature maps that represent
attentive regions on the scene at various scale and per-
spective such as texture or edges. Then, the salient fea-
ture maps representing the attentive regions can be cal-
culated as in Equation (3) with IFT similar to the SR [7].
So, we can have attentive band-pass regions as below:

 

2
1exp cc
r
c
rr
F TfAfiPf
Mx




(3)
where F-1[.] is the inverse FT (IFT), i = 1, Mr(x) is
the salient feature map obtained by applying high-pass
filter Tr(f) (Figure 2) on Ac(f), r is the feature map as
{0-N} that also defines the radius of the low frequency
components to be assigned zero on Tr(f) as in the range
of 2r, N is the maximum possible number of feature map
Mr(x), and ήr is the weighting parameter for each feature
map calculation.
In Figure 3, a sample color image and its salient fea-
ture maps based on CIE Lab color space data and Equa-
tion (3) are given respectively. As can be seen, more
texture information can be obtained in the saliency fea-
ture maps when the frequency content of band-pass re-
gion increases. On the other hand, when the bandwidth is
getting narrower in higher frequency regions (i.e. white
regions on Figure 2 example), salient regions leads to
edges rather than the texture differences.
The saliency feature map examples in Figure 3 are the
results of filtering in frequency domain Tr(f) in Equation
(3) where Figure 2 shows the various Tr(f) with changing
r values. As can be seen, the bandwidth of the high-pass
region is decreasing with the change of radius r of the
low frequency region to be avoided (black regions of the
frequency components in Figure 2). So, as mentioned,
different saliency features can be created which can rep-
resent the image from various attention viewpoints re-
garding the texture and edge based information.
Then, all these weighted feature maps obtained in
Equation (3) are fused by addition to result in the final
saliency as in Equation (4).
r
r
SxM x

(4)
Figure 2. Filter templates Tr(f) of Equation (3) with differ-
ent bandwidths in frequency domain.
Figure 3. Sample color images and their respective texture to edge based some salient feature maps.
Copyright © 2013 SciRes. JSEA
Salient Region Detection and Analysis Based on the Weighted Band-Pass Features
46
where S(x) is the final saliency that is post-processed by
median and Gaussian filter for smoothing in which the
effect of textural differences is higher than the edge
based band-pass regions.
In Figure 4, the final saliency maps were given for the
sample color images that were calculated by using CIE
Lab color space as an example of the resulting saliency
of the proposed model. The proposed model provides full
resolution saliency maps with high perceptual quality
without the necessity of down sampling due to the salient
feature maps selection from several band-pass regions of
different bandwidths. Evaluation of the model with many
color spaces and comparison with existing algorithms
can be found in experimental results in the following
section.
3. Experimental Results
First, performance of the proposed model was examined
with four different color space and three different
weighting parameter (ήr) conditions in this paper. Then,
the model was compared to existing state of the art algo-
rithms. Evaluation process was done by using a dataset
which consists of 100 0 images and their ground-truths of
segmented object regions [4]. Ground truth data was cre-
ated by the several human subjects’ responses to the im-
ages where the subjects were asked to define the bounda-
ries of the object of interest on the image [4]. As for the
evaluation metric, widely used area under curve (AUC)
was applied to test data in which higher value of the
AUC refers to the better performance for the evaluated
algorithms [9-10].
Proposed saliency model was tested in four different
color spaces in which HSV, YCbCr, CIE Lab and NTSC
were selected. They have perceptu al reliability or usabil-
ity from the perspective of VA and HVS since all of
them includes channels to define intensity/lumin ance and
color/color chromatic values for the input image data.
Therefore, using these color space models, we can obtain
intensity and color saliency information from separate
channels to represent the information on the input image.
To be able to have use these color space models, the im-
plementation code was achieved in Matlab® that includ es
built-in functions to convert RGB color space to selected
color space [11-12].
In addition, each saliency feature map has weight, ήr,
as in Equation (3). We have set three different cases for
the weighting parameters for each salient feature maps
Mr(x) in Equation (3); i) all weights set equal, in another
way, they are all assigned as ήr = 1 in the first test case, ii)
the second test case assigns weights as ήr = 2r to give
higher priority to salient feature maps with large band-
width contents, iii) the third scenario is similar to second
case but aiming even higher impact for texture based
attentive regions by using ήr = er as the weights for each
saliency feature maps. The first condition was selected as
equal to demonstrate that suitable weight selections on
feature maps as in the other two weighting condition can
have performance improvement regarding the AUC evalua-
tion metric. Table 1 presents AUC results obtained from
the experiments on 1000 image dataset for selected color
space models and weighting conditions.
The AUC performances of the experiments revealed
that weighting the salient feature maps for the propose
model was more efficient than using equ al weights. Both
2r and er weight assignment on feature map fusion im-
proved the saliency result compared to the addition of
feature maps with equal weights.
Among the tested color spaces, NTSC color space
yielded superior performance compared to other color
spaces in all weighting conditions while CIE Lab has the
second AUC performance over all. In addition, YCbCr
color space had the least variation on performance while
the weighing conditions were changing. HSV had the
worst performance in all test conditions of the proposed
model among the tested color spaces and weighting con-
ditions, and also it had the highest change of perform-
ance depe nding on t he we ighting parameter sel e c tion.
Figure 4. Sample color images and their respective saliency map based on the proposed model.
Copyright © 2013 SciRes. JSEA
Salient Region Detection and Analysis Based on the Weighted Band-Pass Features 47
In addition to the color space and weighting parameter
analysis, the proposed model was also compare to several
state of the art algorithms to demonstrate the effective-
ness of salient regions obtained from frequency domain
selected band-pass regions. For the comparison saliency
models IT [5], MZ [6], SR [7], and FT [4] models se-
lected. These models were selected due to the fact that
they include either center-surround difference, contrast,
or frequency domain based approaches which were
compatible with the propo s ed model.
In Figure 5, saliency maps are given for the compared
models and proposed algorithm with CIE Lab color
space and weighting case two of Table 1 since CIE Lab
color space is a widely used color conversion algorithm
to demonstrate the experimental results of the saliency
outputs. Table 2 gives the AUC performance of the state
of the art models from 1000 image dataset.
It can be seen that proposed model in all ca ses outper-
form the existing algorithms regarding the AUC values.
Proposed algorithm has the best saliency performance
regarding the AUC values with all color space and
weighting conditions with respect to compared state of
the art algorithms. Saliency model FT [4] proposed by
Achanta, Hemami, Estrada and Susstr unk has the second
best AUC performance, which also have high perceptual
quality and uses CIE Lab co lor space conv ersion. On the
other hand, AUC performances of IT [5] (i.e. spatial do-
main model with multi-scale center-surround analysis)
and ST [7] (i.e. based on frequency domain analysis to
find irregularities) have very close AUC values in aver-
age performance. The model MZ in [6] has the lowest
saliency performance among the compared models.
4. Conclusions
In this paper, a simple and efficient saliency detection
model was introduced which generates salient feature
Figure 5. Sample color images, and saliency maps of IT [5], MZ [6], SR [7], FT [4], and proposed model respectively.
Copyright © 2013 SciRes. JSEA
Salient Region Detection and Analysis Based on the Weighted Band-Pass Features
48
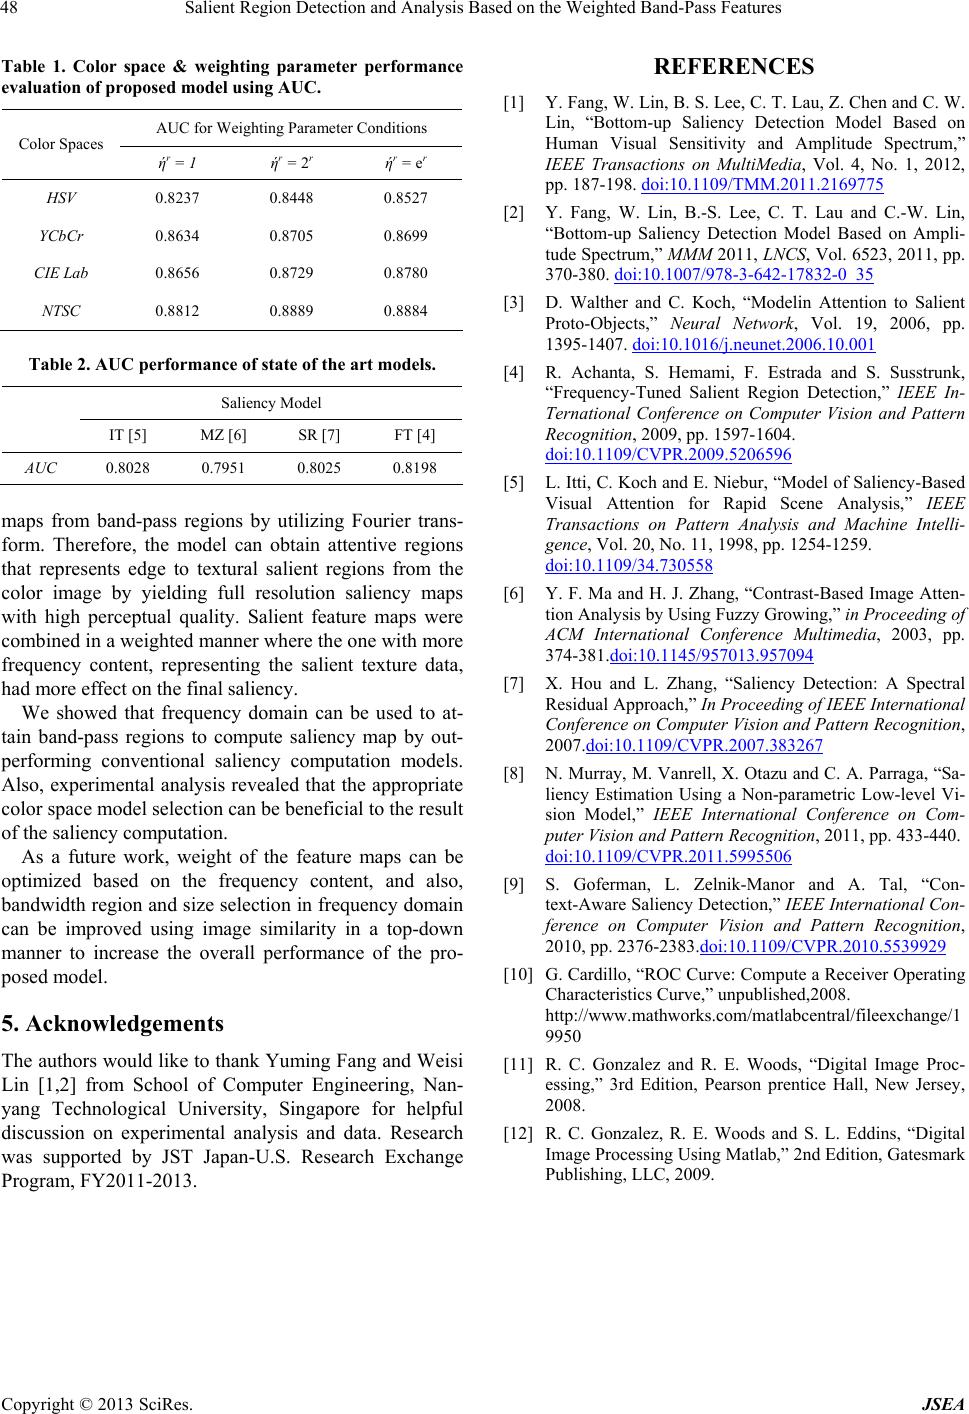
Table 1. Color space & weighting parameter performance
evaluation of proposed model using AUC.
AUC for Weighting Parameter Conditions
Color Spaces
ήr = 1 ήr = 2r ήr = er
HSV 0.8237 0.8448 0.8527
YCbCr 0.8634 0.8705 0.8699
CIE Lab 0.8656 0.8729 0.8780
NTSC 0.8812 0.8889 0.8884
Table 2. AUC performance of state of the art models.
Saliency Model
IT [5] MZ [6] SR [7] FT [4]
AUC 0.8028 0.7951 0.8025 0.8198
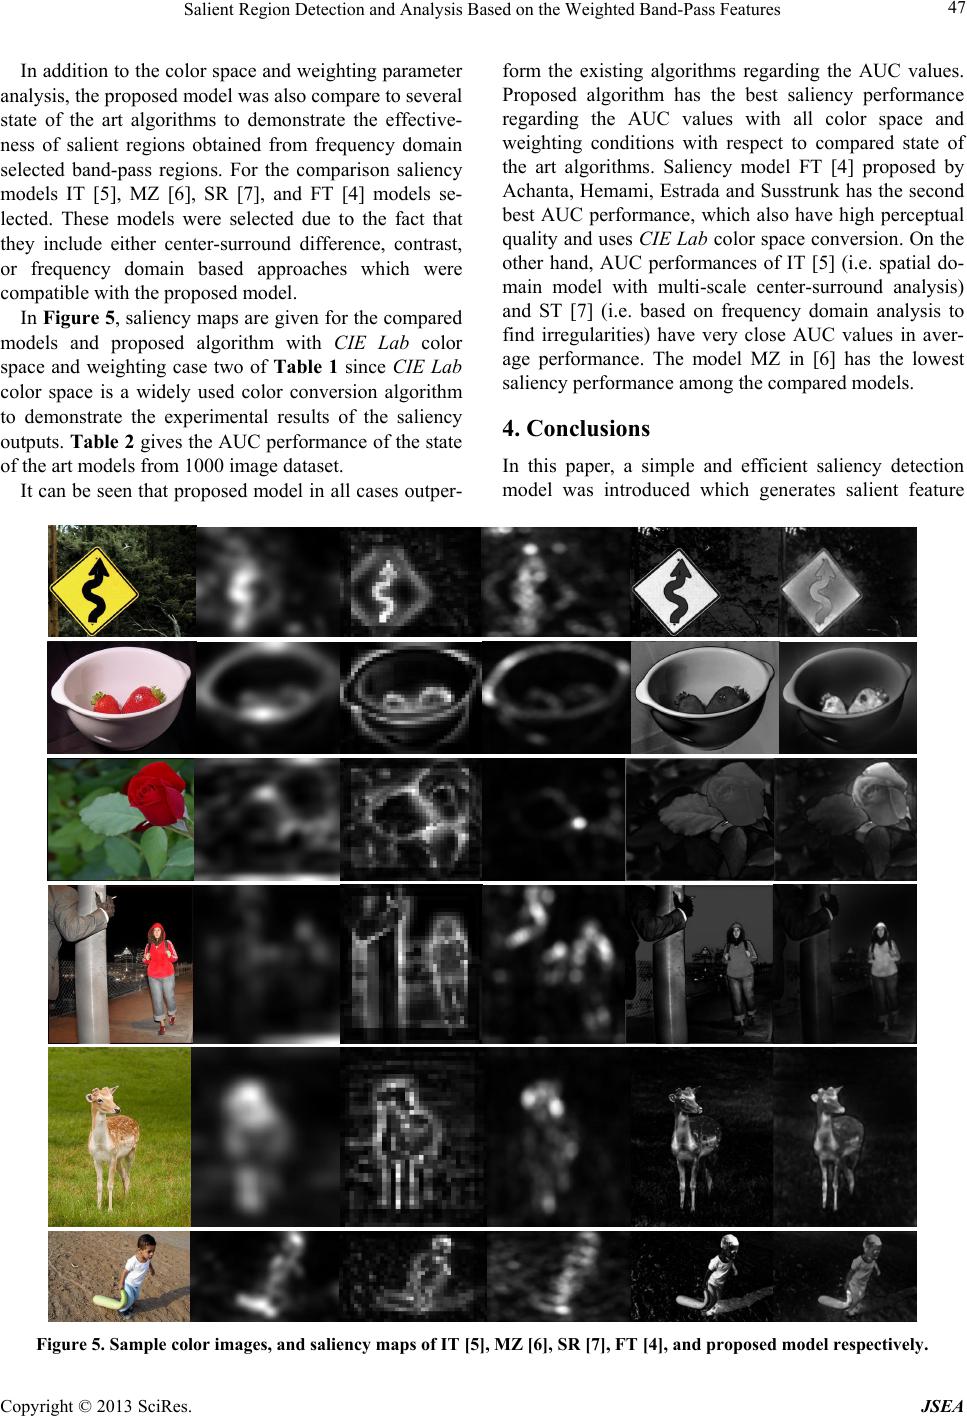
maps from band-pass regions by utilizing Fourier trans-
form. Therefore, the model can obtain attentive regions
that represents edge to textural salient regions from the
color image by yielding full resolution saliency maps
with high perceptual quality. Salient feature maps were
combined in a weighted manner where the one with more
frequency content, representing the salient texture data,
had more effect on the final saliency.
We showed that frequency domain can be used to at-
tain band-pass regions to compute saliency map by out-
performing conventional saliency computation models.
Also, experimental analysis revealed that the appropriate
color space model selection can be beneficial to the result
of the saliency computation.
As a future work, weight of the feature maps can be
optimized based on the frequency content, and also,
bandwidth region and size selection in frequency domain
can be improved using image similarity in a top-down
manner to increase the overall performance of the pro-
posed model.
5. Acknowledgements
The authors would like to thank Yuming Fang and Weisi
Lin [1,2] from School of Computer Engineering, Nan-
yang Technological University, Singapore for helpful
discussion on experimental analysis and data. Research
was supported by JST Japan-U.S. Research Exchange
Program, FY2011-2013.
REFERENCES
[1] Y. Fang, W. Lin, B. S. Lee, C. T. Lau, Z. Chen and C. W.
Lin, “Bottom-up Saliency Detection Model Based on
Human Visual Sensitivity and Amplitude Spectrum,”
IEEE Transactions on MultiMedia, Vol. 4, No. 1, 2012,
pp. 187-198. doi:10.1109/TMM.2011.2169775
[2] Y. Fang, W. Lin, B.-S. Lee, C. T. Lau and C.-W. Lin,
“Bottom-up Saliency Detection Model Based on Ampli-
tude Spectrum,” MMM 2011, LNCS, Vol. 6523, 2011, pp.
370-380. doi:10.1007/978-3-642-17832-0_35
[3] D. Walther and C. Koch, “Modelin Attention to Salient
Proto-Objects,” Neural Network, Vol. 19, 2006, pp.
1395-1407. doi:10.1016/j.neunet.2006.10.001
[4] R. Achanta, S. Hemami, F. Estrada and S. Susstrunk,
“Frequency-Tuned Salient Region Detection,” IEEE In-
Ternational Conference on Computer Vision and Pattern
Recognition, 2009, pp. 1597-1604.
doi:10.1109/CVPR.2009.5206596
[5] L. Itti, C. Koch and E. Niebur, “Model of Saliency-Based
Visual Attention for Rapid Scene Analysis,” IEEE
Transactions on Pattern Analysis and Machine Intelli-
gence, Vol. 20, No. 11, 1998, pp. 1254-1259.
doi:10.1109/34.730558
[6] Y. F. Ma and H. J. Zhang, “Contrast-Based Image Atten-
tion Analysis by Using Fuzzy Growing,” in Proceeding of
ACM International Conference Multimedia, 2003, pp.
374-381.doi:10.1145/957013.957094
[7] X. Hou and L. Zhang, “Saliency Detection: A Spectral
Residual Approach,” In Proceeding of IEEE International
Conference on Computer Vision and Pattern Recognition,
2007.doi:10.1109/CVPR.2007.383267
[8] N. Murray, M. Vanrell, X. Otazu and C. A. Parraga, “Sa-
liency Estimation Using a Non-parametric Low-level Vi-
sion Model,” IEEE International Conference on Com-
puter Vision and Pattern Recognition, 2011, pp. 433-440.
doi:10.1109/CVPR.2011.5995506
[9] S. Goferman, L. Zelnik-Manor and A. Tal, “Con-
text-Aware Saliency Detection,” IEEE International Con-
ference on Computer Vision and Pattern Recognition,
2010, pp. 2376-2383.doi:10.1109/CVPR.2010.5539929
[10] G. Cardillo, “ROC Curve: Compute a Receiver Operating
Characteristics Curve,” unpublished,2008.
http://www.mathworks.com/matlabcentral/fileexchange/1
9950
[11] R. C. Gonzalez and R. E. Woods, “Digital Image Proc-
essing,” 3rd Edition, Pearson prentice Hall, New Jersey,
2008.
[12] R. C. Gonzalez, R. E. Woods and S. L. Eddins, “Digital
Image Processing Using Matlab,” 2nd Edition, Gatesmark
Publishing, LLC, 2009.
Copyright © 2013 SciRes. JSEA