 Journal of Environmental Protection, 2013, 4, 83-98 http://dx.doi.org/10.4236/jep.2013.48A1011 Published Online August 2013 (http://www.scirp.org/journal/jep) 83 Air Quality Impacts of Smallholder Oil Palm Processing in Nigeria Elijah I. Ohimain1*, Sylvester C. Izah1, Stephen O. Abah2 1Bioenergy and Environmental Biotechnology Research Unit, Department of Biological Sciences, Faculty of Science, Niger Delta University, Wilberforce Island, Nigeria; 2Department of Community Health, Faculty of Clinical Sciences, College of Medicine, Ambrose Alli University, Ekpoma, Nigeria. Email: *eohimain@yahoo.com Received May 18th, 2013; revised June 26th, 2013; accepted August 2nd, 2013 Copyright © 2013 Elijah I. Ohimain et al. This is an open access article distributed under the Creative Commons Attribution License, which permits unrestricted use, distribution, and reproduction in any medium, provided the original work is properly cited. ABSTRACT Air emissions during palm oil processing by smallholders are issues of public health concern demanding urgent inter- vention by environmentalist. In this study, six smallholder oil palm processing mills were studied in Elele, Nigeria. Air emission parameters (NO2, NH3, CO, H2S, SO2, VOC), noise and meteorology (wind speed, temperature, relative hu- midity and pressure) were determined at three distances (10 ft, 25 ft and 50 ft) in both wind ward and lee ward direc- tions from the mills covering boiling and digestion activities. The emissions from biomass were found to be signifi- cantly higher than that from fossil diesel, while noise was higher during digestion. The health implications of air emis- sions were discussed. The study concluded by directing attentions of regulatory agencies to monitor the activities of smallholder oil palm processing to ensure the environmental sustainability of their operations. In summary, evidence during boiling activity revealed that: H2S ranged from <0.01 - 2.400 ppm at 10 ft, <0.01 - 2.067 ppm at 25 ft and <0.01 - 0.833 ppm at 50 ft from the mills in the wind ward direction, and <0.01 - 1.167 ppm at 10 ft, <0.01 - 0.567 ppm at 25 ft and <0.01 - 0.367 ppm at 50ft distance from the mills in lee ward direction and was significantly lower during digestion. SPM ranged from 1634 - 7853 µg/m3 at 10 ft, 657 - 1110 µg/m3 at 25 ft and 81 - 854 µg/m3 at 50 ft from the mills in the wind ward direction, and 46 - 236 µg/m3 at 10 ft, 44 - 120 µg/m3 at 25 ft and 30 - 58 µg/m3 at 50 ft from the mills in lee ward direction. SPM was significantly lower during digestion. VOC ranged from 67 - 13.933 ppm at 10 ft, 1.033 - 13.133 ppm at 25ft and 0.500 - 9.467 ppm at 50 ft from the mills in the wind ward direction, and 0.300 - 3.200 ppm at 10 ft, 0.133 - 6.733 ppm at 25 ft and 0.100 - 4.773 ppm at 50 ft from the mills in the lee ward direction, but was significantly lower during digestion.. Keywords: Air Emissions; Noise; Oil Palm Processing; Pollutant Gases 1. Introduction Within the last few years, environmental issues are in- creasingly becoming relevant in economic activities and public health [1,2] in Nigeria and the rest of the world. Of particular concern is the atmospheric environmental problems, which had previously received scanty attention in Nigeria but have become a subject of increasing Na- tional significance, particularly over the last two years [3]. Air pollution is a major threat to human life and most people inhale pollutants while at home or commuting to work irrespective of the mode of transportation [4]. De- pending on the dose and the exposure time, these pollut- ant gases have the potential to cause far reaching adverse health effects in man, but principally affect the respira- tory and cardiovascular systems. The World Health Or- ganization (WHO) estimates that about 2.4 million peo- ple worldwide (including about 93,700 Nigerians) die each year from causes directly attributable to air pollu- tion [5]. Oil palm (Elaeis guineensis) is an indigenous plant to West Africa [6]. It is the most productive oil crop in the world [7-15], accounting for 33% of global vegetable oil production [16]. In Nigeria, over 80% of oil palm culti- vation and production are controlled by smallholders [17, 18], who typically harvest semi wild plants and use *Corresponding author. Copyright © 2013 SciRes. JEP 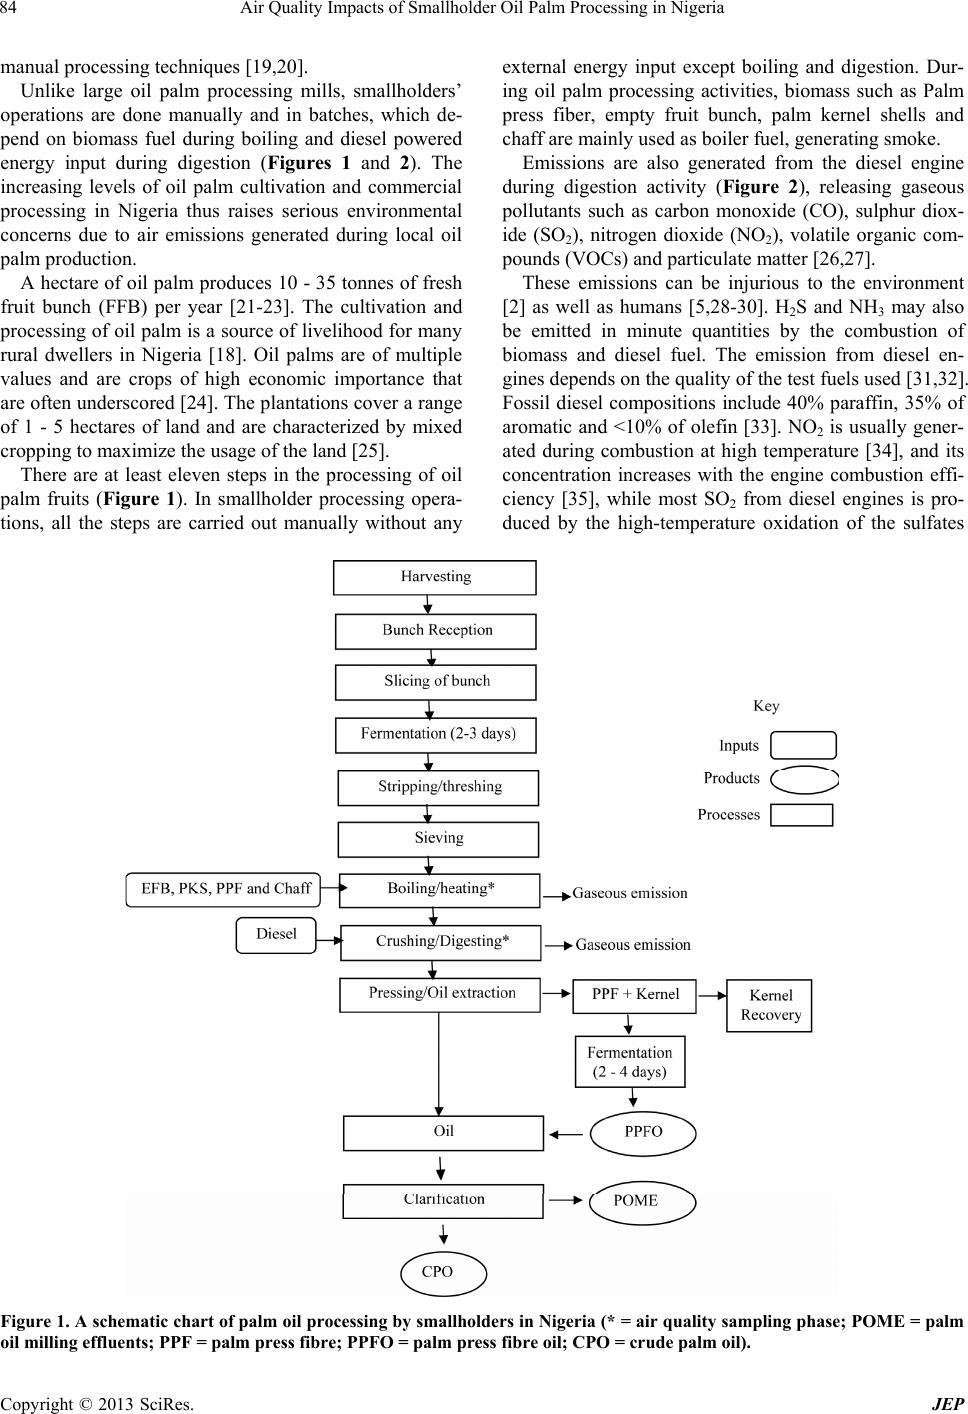 Air Quality Impacts of Smallholder Oil Palm Processing in Nigeria 84 manual processing techniques [19,20]. Unlike large oil palm processing mills, smallholders’ operations are done manually and in batches, which de- pend on biomass fuel during boiling and diesel powered energy input during digestion (Figures 1 and 2). The increasing levels of oil palm cultivation and commercial processing in Nigeria thus raises serious environmental concerns due to air emissions generated during local oil palm production. A hectare of oil palm produces 10 - 35 tonnes of fresh fruit bunch (FFB) per year [21-23]. The cultivation and processing of oil palm is a source of livelihood for many rural dwellers in Nigeria [18]. Oil palms are of multiple values and are crops of high economic importance that are often underscored [24]. The plantations cover a range of 1 - 5 hectares of land and are characterized by mixed cropping to maximize the usage of the land [25]. There are at least eleven steps in the processing of oil palm fruits (Figure 1). In smallholder processing opera- tions, all the steps are carried out manually without any external energy input except boiling and digestion. Dur- ing oil palm processing activities, biomass such as Palm press fiber, empty fruit bunch, palm kernel shells and chaff are mainly used as boiler fuel, generating smoke. Emissions are also generated from the diesel engine during digestion activity (Figure 2), releasing gaseous pollutants such as carbon monoxide (CO), sulphur diox- ide (SO2), nitrogen dioxide (NO2), volatile organic com- pounds (VOCs) and particulate matter [26,27]. These emissions can be injurious to the environment [2] as well as humans [5,28-30]. H2S and NH3 may also be emitted in minute quantities by the combustion of biomass and diesel fuel. The emission from diesel en- gines depends on the quality of the test fuels used [31,32]. Fossil diesel compositions include 40% paraffin, 35% of aromatic and <10% of olefin [33]. NO2 is usually gener- ated during combustion at high temperature [34], and its concentration increases with the engine combustion effi- ciency [35], while most SO2 from diesel engines is pro- duced by the high-temperature oxidation of the sulfates Figure 1. A schematic chart of palm oil processing by smallholders in Nigeria (* = air quality sampling phas e; POME = palm oil milling effluents; PPF = palm press fibre; PPFO = palm press fibre oil; CPO = crude palm oil). Copyright © 2013 SciRes. JEP 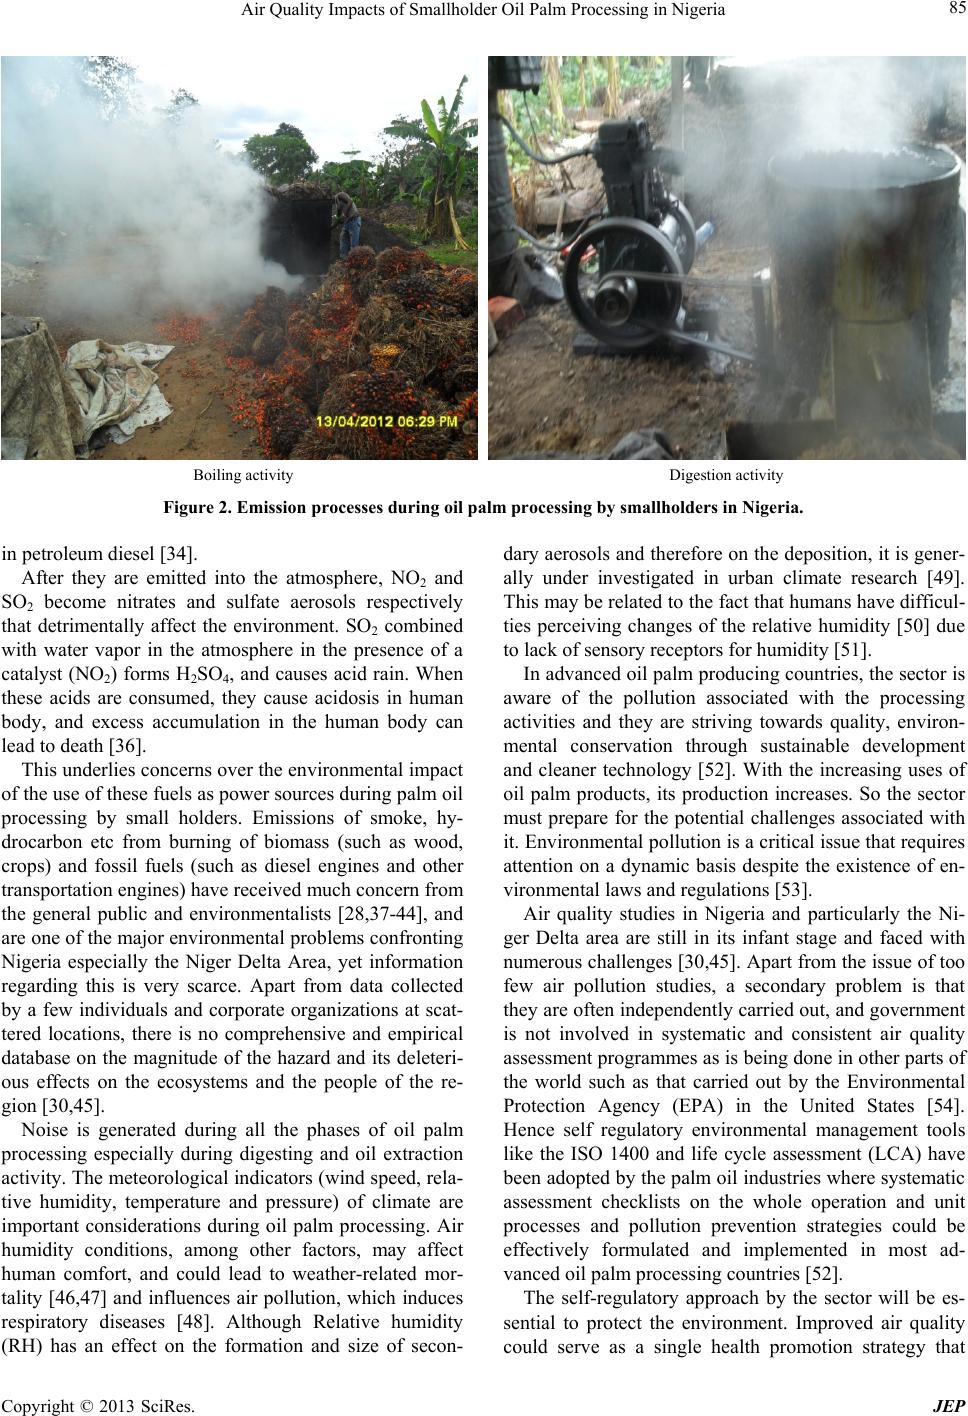 Air Quality Impacts of Smallholder Oil Palm Processing in Nigeria 85 Boiling activity Digestion activity Figure 2. Emission processes during oil palm processing by smallholders in N i ge r i a. in petroleum diesel [34]. After they are emitted into the atmosphere, NO2 and SO2 become nitrates and sulfate aerosols respectively that detrimentally affect the environment. SO2 combined with water vapor in the atmosphere in the presence of a catalyst (NO2) forms H2SO4, and causes acid rain. When these acids are consumed, they cause acidosis in human body, and excess accumulation in the human body can lead to death [36]. This underlies concerns over the environmental impact of the use of these fuels as power sources during palm oil processing by small holders. Emissions of smoke, hy- drocarbon etc from burning of biomass (such as wood, crops) and fossil fuels (such as diesel engines and other transportation engines) have received much concern from the general public and environmentalists [28,37-44], and are one of the major environmental problems confronting Nigeria especially the Niger Delta Area, yet information regarding this is very scarce. Apart from data collected by a few individuals and corporate organizations at scat- tered locations, there is no comprehensive and empirical database on the magnitude of the hazard and its deleteri- ous effects on the ecosystems and the people of the re- gion [30,45]. Noise is generated during all the phases of oil palm processing especially during digesting and oil extraction activity. The meteorological indicators (wind speed, rela- tive humidity, temperature and pressure) of climate are important considerations during oil palm processing. Air humidity conditions, among other factors, may affect human comfort, and could lead to weather-related mor- tality [46,47] and influences air pollution, which induces respiratory diseases [48]. Although Relative humidity (RH) has an effect on the formation and size of secon- dary aerosols and therefore on the deposition, it is gener- ally under investigated in urban climate research [49]. This may be related to the fact that humans have difficul- ties perceiving changes of the relative humidity [50] due to lack of sensory receptors for humidity [51]. In advanced oil palm producing countries, the sector is aware of the pollution associated with the processing activities and they are striving towards quality, environ- mental conservation through sustainable development and cleaner technology [52]. With the increasing uses of oil palm products, its production increases. So the sector must prepare for the potential challenges associated with it. Environmental pollution is a critical issue that requires attention on a dynamic basis despite the existence of en- vironmental laws and regulations [53]. Air quality studies in Nigeria and particularly the Ni- ger Delta area are still in its infant stage and faced with numerous challenges [30,45]. Apart from the issue of too few air pollution studies, a secondary problem is that they are often independently carried out, and government is not involved in systematic and consistent air quality assessment programmes as is being done in other parts of the world such as that carried out by the Environmental Protection Agency (EPA) in the United States [54]. Hence self regulatory environmental management tools like the ISO 1400 and life cycle assessment (LCA) have been adopted by the palm oil industries where systematic assessment checklists on the whole operation and unit processes and pollution prevention strategies could be effectively formulated and implemented in most ad- vanced oil palm processing countries [52]. The self-regulatory approach by the sector will be es- sential to protect the environment. Improved air quality could serve as a single health promotion strategy that Copyright © 2013 SciRes. JEP 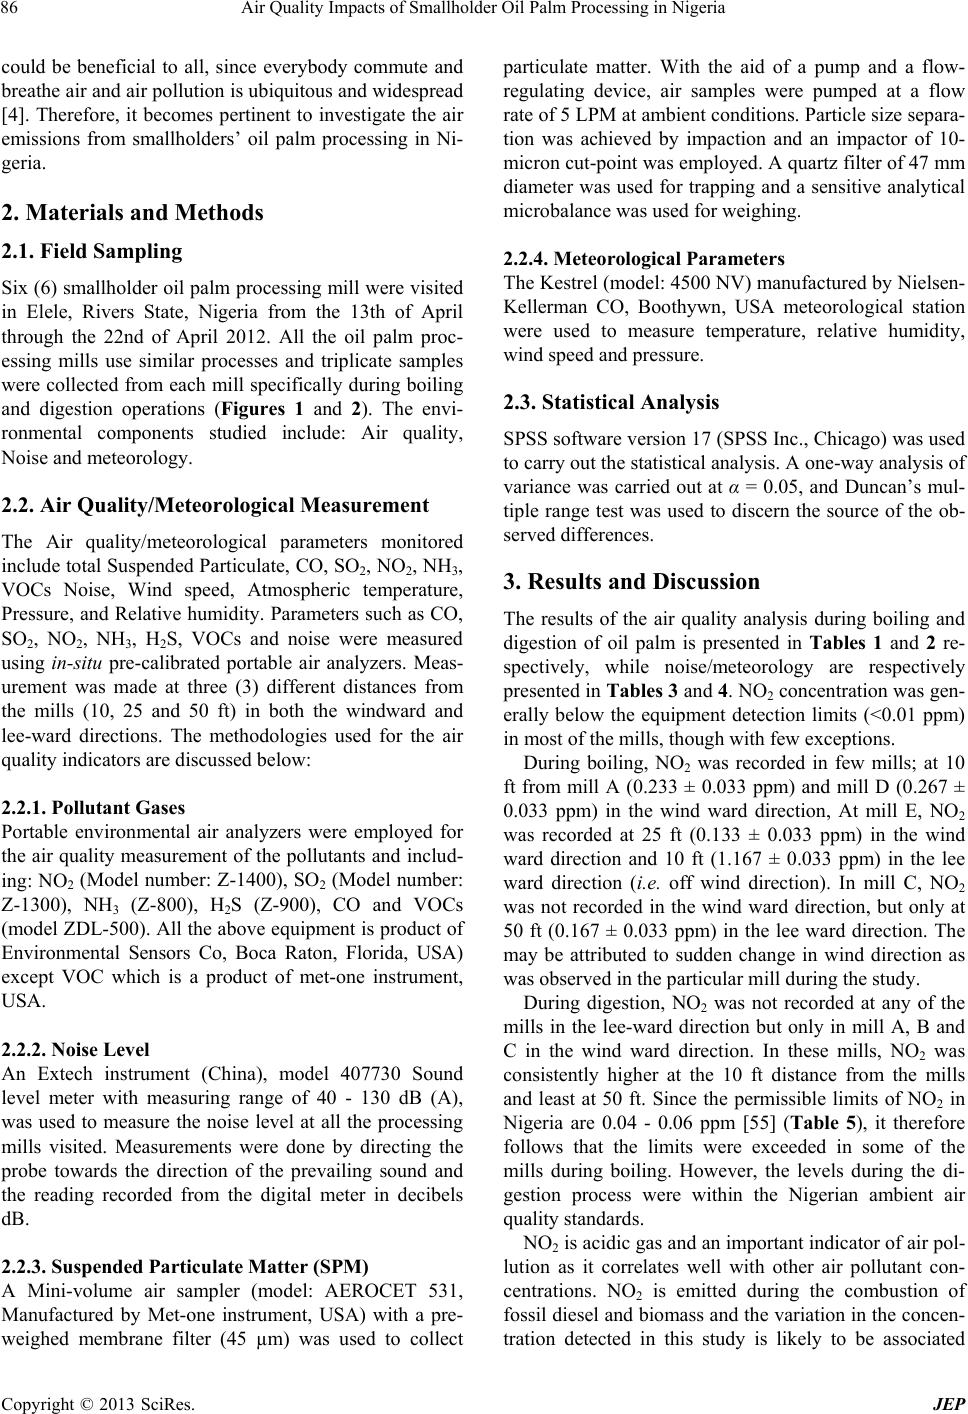 Air Quality Impacts of Smallholder Oil Palm Processing in Nigeria 86 could be beneficial to all, since everybody commute and breathe air and air pollution is ubiquitous and widespread [4]. Therefore, it becomes pertinent to investigate the air emissions from smallholders’ oil palm processing in Ni- geria. 2. Materials and Methods 2.1. Field Sampling Six (6) smallholder oil palm processing mill were visited in Elele, Rivers State, Nigeria from the 13th of April through the 22nd of April 2012. All the oil palm proc- essing mills use similar processes and triplicate samples were collected from each mill specifically during boiling and digestion operations (Figures 1 and 2). The envi- ronmental components studied include: Air quality, Noise and meteorology. 2.2. Air Quality/Meteorological Measurement The Air quality/meteorological parameters monitored include total Suspended Particulate, CO, SO2, NO2, NH3, VOCs Noise, Wind speed, Atmospheric temperature, Pressure, and Relative humidity. Parameters such as CO, SO2, NO2, NH3, H2S, VOCs and noise were measured using in-situ pre-calibrated portable air analyzers. Meas- urement was made at three (3) different distances from the mills (10, 25 and 50 ft) in both the windward and lee-ward directions. The methodologies used for the air quality indicators are discussed below: 2.2.1. Pollut an t Gases Portable environmental air analyzers were employed for the air quality measurement of the pollutants and includ- ing: NO2 (Model number: Z-1400), SO2 (Model number: Z-1300), NH3 (Z-800), H2S (Z-900), CO and VOCs (model ZDL-500). All the above equipment is product of Environmental Sensors Co, Boca Raton, Florida, USA) except VOC which is a product of met-one instrument, USA. 2.2.2. Noise L evel An Extech instrument (China), model 407730 Sound level meter with measuring range of 40 - 130 dB (A), was used to measure the noise level at all the processing mills visited. Measurements were done by directing the probe towards the direction of the prevailing sound and the reading recorded from the digital meter in decibels dB. 2.2.3. Suspended Particulate Matter (SPM) A Mini-volume air sampler (model: AEROCET 531, Manufactured by Met-one instrument, USA) with a pre- weighed membrane filter (45 µm) was used to collect particulate matter. With the aid of a pump and a flow- regulating device, air samples were pumped at a flow rate of 5 LPM at ambient conditions. Particle size separa- tion was achieved by impaction and an impactor of 10- micron cut-point was employed. A quartz filter of 47 mm diameter was used for trapping and a sensitive analytical microbalance was used for weighing. 2.2.4. Meteorological Parameters The Kestrel (model: 4500 NV) manufactured by Nielsen- Kellerman CO, Boothywn, USA meteorological station were used to measure temperature, relative humidity, wind speed and pressure. 2.3. Statistical Analysis SPSS software version 17 (SPSS Inc., Chicago) was used to carry out the statistical analysis. A one-way analysis of variance was carried out at α = 0.05, and Duncan’s mul- tiple range test was used to discern the source of the ob- served differences. 3. Results and Discussion The results of the air quality analysis during boiling and digestion of oil palm is presented in Tables 1 and 2 re- spectively, while noise/meteorology are respectively presented in Tabl es 3 and 4. NO2 concentration was gen- erally below the equipment detection limits (<0.01 ppm) in most of the mills, though with few exceptions. During boiling, NO2 was recorded in few mills; at 10 ft from mill A (0.233 ± 0.033 ppm) and mill D (0.267 ± 0.033 ppm) in the wind ward direction, At mill E, NO2 was recorded at 25 ft (0.133 ± 0.033 ppm) in the wind ward direction and 10 ft (1.167 ± 0.033 ppm) in the lee ward direction (i.e. off wind direction). In mill C, NO2 was not recorded in the wind ward direction, but only at 50 ft (0.167 ± 0.033 ppm) in the lee ward direction. The may be attributed to sudden change in wind direction as was observed in the particular mill during the study. During digestion, NO2 was not recorded at any of the mills in the lee-ward direction but only in mill A, B and C in the wind ward direction. In these mills, NO2 was consistently higher at the 10 ft distance from the mills and least at 50 ft. Since the permissible limits of NO2 in Nigeria are 0.04 - 0.06 ppm [55] (Table 5), it therefore follows that the limits were exceeded in some of the mills during boiling. However, the levels during the di- gestion process were within the Nigerian ambient air quality standards. NO2 is acidic gas and an important indicator of air pol- lution as it correlates well with other air pollutant con- centrations. NO2 is emitted during the combustion of fossil diesel and biomass and the variation in the concen- tration detected in this study is likely to be associated Copyright © 2013 SciRes. JEP 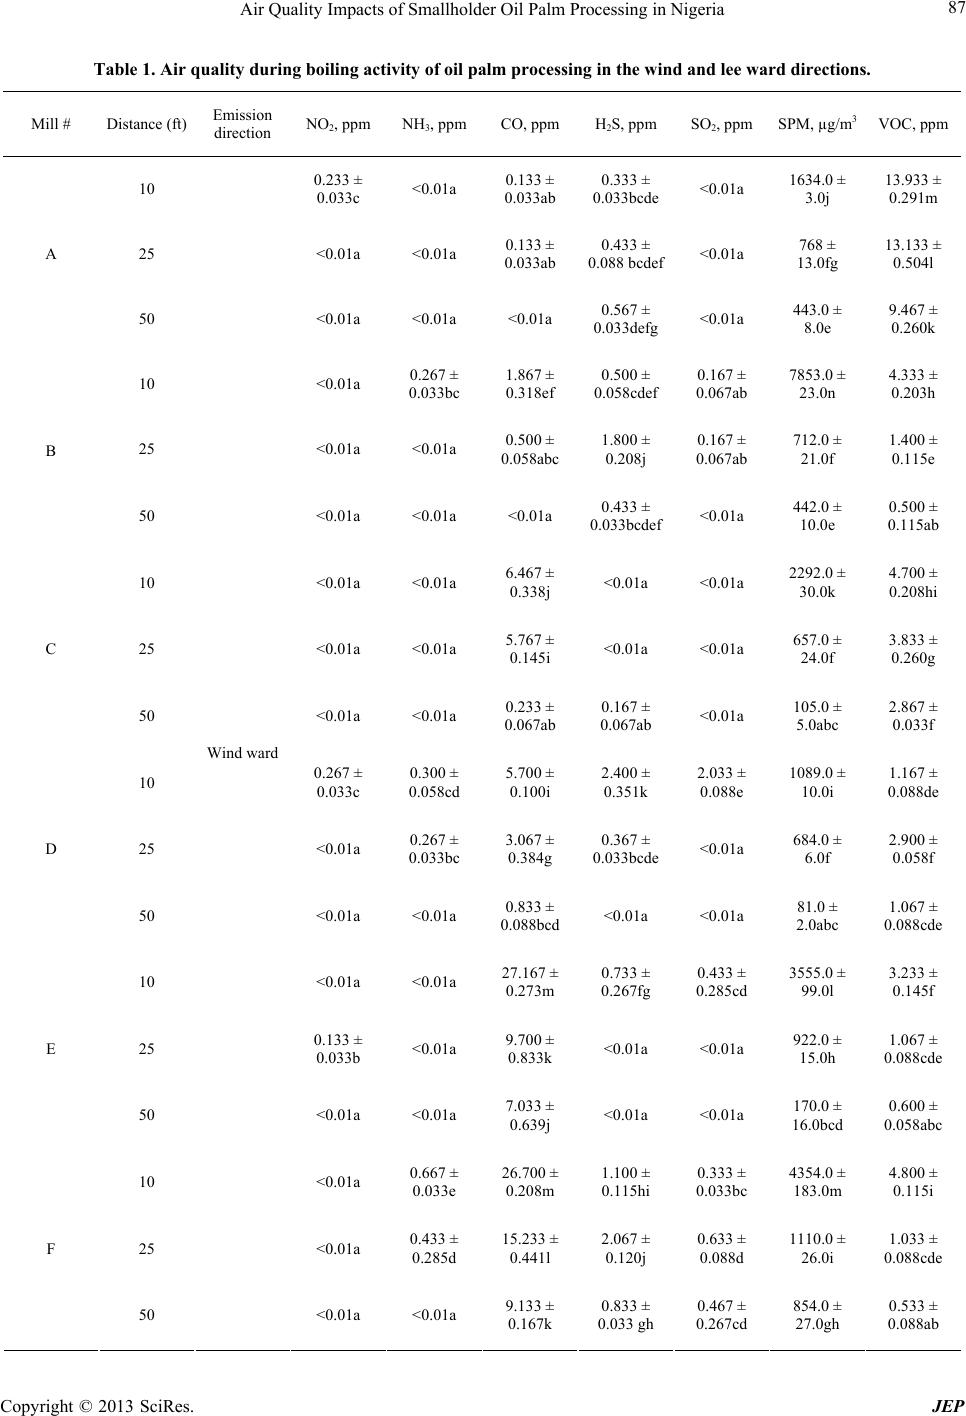 Air Quality Impacts of Smallholder Oil Palm Processing in Nigeria Copyright © 2013 SciRes. JEP 87 Table 1. Air quality during boiling activity of oil palm processing in the wind and lee ward directions. Mill # Distance (ft) Emission direction NO2, ppm NH3, ppmCO, ppm H2S, ppm SO2, ppm SPM, µg/m3 VOC, ppm 10 0.233 ± 0.033c <0.01a 0.133 ± 0.033ab 0.333 ± 0.033bcde <0.01a 1634.0 ± 3.0j 13.933 ± 0.291m 25 <0.01a <0.01a 0.133 ± 0.033ab 0.433 ± 0.088 bcdef<0.01a 768 ± 13.0fg 13.133 ± 0.504l A 50 <0.01a <0.01a <0.01a 0.567 ± 0.033defg <0.01a 443.0 ± 8.0e 9.467 ± 0.260k 10 <0.01a 0.267 ± 0.033bc 1.867 ± 0.318ef 0.500 ± 0.058cdef 0.167 ± 0.067ab 7853.0 ± 23.0n 4.333 ± 0.203h 25 <0.01a <0.01a 0.500 ± 0.058abc 1.800 ± 0.208j 0.167 ± 0.067ab 712.0 ± 21.0f 1.400 ± 0.115e B 50 <0.01a <0.01a <0.01a 0.433 ± 0.033bcdef <0.01a 442.0 ± 10.0e 0.500 ± 0.115ab 10 <0.01a <0.01a 6.467 ± 0.338j <0.01a <0.01a 2292.0 ± 30.0k 4.700 ± 0.208hi 25 <0.01a <0.01a 5.767 ± 0.145i <0.01a <0.01a 657.0 ± 24.0f 3.833 ± 0.260g C 50 <0.01a <0.01a 0.233 ± 0.067ab 0.167 ± 0.067ab <0.01a 105.0 ± 5.0abc 2.867 ± 0.033f 10 0.267 ± 0.033c 0.300 ± 0.058cd 5.700 ± 0.100i 2.400 ± 0.351k 2.033 ± 0.088e 1089.0 ± 10.0i 1.167 ± 0.088de 25 <0.01a 0.267 ± 0.033bc 3.067 ± 0.384g 0.367 ± 0.033bcde <0.01a 684.0 ± 6.0f 2.900 ± 0.058f D 50 <0.01a <0.01a 0.833 ± 0.088bcd <0.01a <0.01a 81.0 ± 2.0abc 1.067 ± 0.088cde 10 <0.01a <0.01a 27.167 ± 0.273m 0.733 ± 0.267fg 0.433 ± 0.285cd 3555.0 ± 99.0l 3.233 ± 0.145f 25 0.133 ± 0.033b <0.01a 9.700 ± 0.833k <0.01a <0.01a 922.0 ± 15.0h 1.067 ± 0.088cde E 50 <0.01a <0.01a 7.033 ± 0.639j <0.01a <0.01a 170.0 ± 16.0bcd 0.600 ± 0.058abc 10 <0.01a 0.667 ± 0.033e 26.700 ± 0.208m 1.100 ± 0.115hi 0.333 ± 0.033bc 4354.0 ± 183.0m 4.800 ± 0.115i 25 <0.01a 0.433 ± 0.285d 15.233 ± 0.441l 2.067 ± 0.120j 0.633 ± 0.088d 1110.0 ± 26.0i 1.033 ± 0.088cde F 50 Wind ward <0.01a <0.01a 9.133 ± 0.167k 0.833 ± 0.033 gh 0.467 ± 0.267cd 854.0 ± 27.0gh 0.533 ± 0.088ab 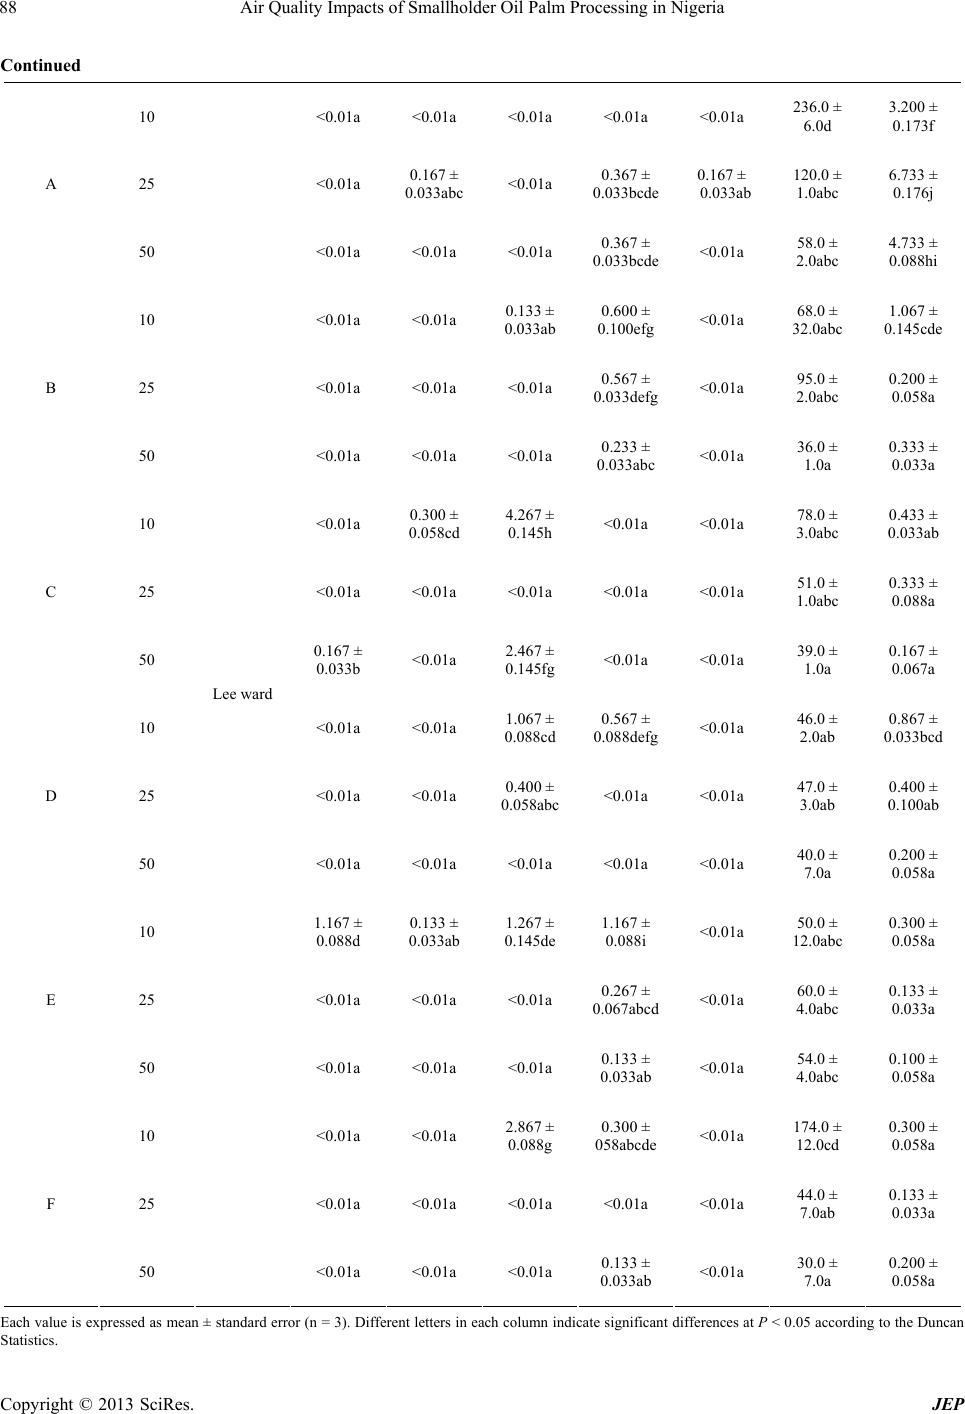 Air Quality Impacts of Smallholder Oil Palm Processing in Nigeria 88 Continued 10 <0.01a <0.01a <0.01a <0.01a <0.01a 236.0 ± 6.0d 3.200 ± 0.173f 25 <0.01a 0.167 ± 0.033abc <0.01a 0.367 ± 0.033bcde 0.167 ± 0.033ab 120.0 ± 1.0abc 6.733 ± 0.176j A 50 <0.01a <0.01a <0.01a 0.367 ± 0.033bcde <0.01a 58.0 ± 2.0abc 4.733 ± 0.088hi 10 <0.01a <0.01a 0.133 ± 0.033ab 0.600 ± 0.100efg <0.01a 68.0 ± 32.0abc 1.067 ± 0.145cde 25 <0.01a <0.01a <0.01a 0.567 ± 0.033defg <0.01a 95.0 ± 2.0abc 0.200 ± 0.058a B 50 <0.01a <0.01a <0.01a 0.233 ± 0.033abc <0.01a 36.0 ± 1.0a 0.333 ± 0.033a 10 <0.01a 0.300 ± 0.058cd 4.267 ± 0.145h <0.01a <0.01a 78.0 ± 3.0abc 0.433 ± 0.033ab 25 <0.01a <0.01a <0.01a <0.01a <0.01a 51.0 ± 1.0abc 0.333 ± 0.088a C 50 0.167 ± 0.033b <0.01a 2.467 ± 0.145fg <0.01a <0.01a 39.0 ± 1.0a 0.167 ± 0.067a 10 <0.01a <0.01a 1.067 ± 0.088cd 0.567 ± 0.088defg <0.01a 46.0 ± 2.0ab 0.867 ± 0.033bcd 25 <0.01a <0.01a 0.400 ± 0.058abc <0.01a <0.01a 47.0 ± 3.0ab 0.400 ± 0.100ab D 50 <0.01a <0.01a <0.01a <0.01a <0.01a 40.0 ± 7.0a 0.200 ± 0.058a 10 1.167 ± 0.088d 0.133 ± 0.033ab 1.267 ± 0.145de 1.167 ± 0.088i <0.01a 50.0 ± 12.0abc 0.300 ± 0.058a 25 <0.01a <0.01a <0.01a 0.267 ± 0.067abcd <0.01a 60.0 ± 4.0abc 0.133 ± 0.033a E 50 <0.01a <0.01a <0.01a 0.133 ± 0.033ab <0.01a 54.0 ± 4.0abc 0.100 ± 0.058a 10 <0.01a <0.01a 2.867 ± 0.088g 0.300 ± 058abcde <0.01a 174.0 ± 12.0cd 0.300 ± 0.058a 25 <0.01a <0.01a <0.01a <0.01a <0.01a 44.0 ± 7.0ab 0.133 ± 0.033a F 50 Lee ward <0.01a <0.01a <0.01a 0.133 ± 0.033ab <0.01a 30.0 ± 7.0a 0.200 ± 0.058a Each value is expressed as mean ± standard error (n = 3). Different letters in each column indicate significant differences at P < 0.05 according to the Duncan Statistics. Copyright © 2013 SciRes. JEP 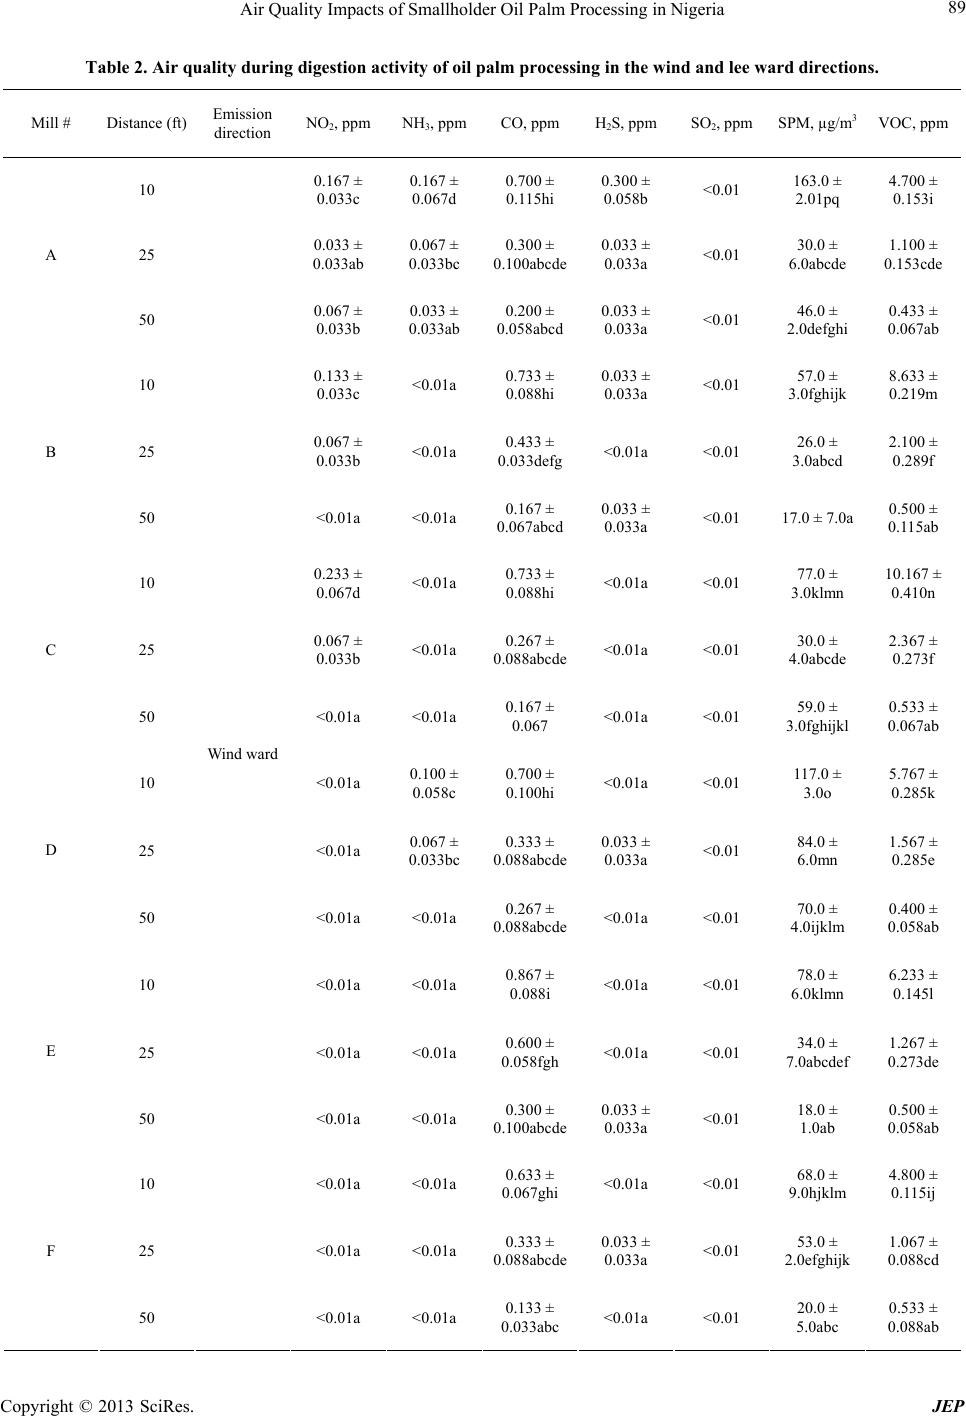 Air Quality Impacts of Smallholder Oil Palm Processing in Nigeria 89 Table 2. Air quality during digestion activity of oil palm processing in the wind and lee ward directions. Mill # Distance (ft) Emission direction NO2, ppm NH3, ppmCO, ppm H2S, ppm SO2, ppm SPM, µg/m3 VOC, ppm 10 0.167 ± 0.033c 0.167 ± 0.067d 0.700 ± 0.115hi 0.300 ± 0.058b <0.01 163.0 ± 2.01pq 4.700 ± 0.153i 25 0.033 ± 0.033ab 0.067 ± 0.033bc 0.300 ± 0.100abcde 0.033 ± 0.033a <0.01 30.0 ± 6.0abcde 1.100 ± 0.153cde A 50 0.067 ± 0.033b 0.033 ± 0.033ab 0.200 ± 0.058abcd 0.033 ± 0.033a <0.01 46.0 ± 2.0defghi 0.433 ± 0.067ab 10 0.133 ± 0.033c <0.01a 0.733 ± 0.088hi 0.033 ± 0.033a <0.01 57.0 ± 3.0fghijk 8.633 ± 0.219m 25 0.067 ± 0.033b <0.01a 0.433 ± 0.033defg <0.01a <0.01 26.0 ± 3.0abcd 2.100 ± 0.289f B 50 <0.01a <0.01a 0.167 ± 0.067abcd 0.033 ± 0.033a <0.01 17.0 ± 7.0a 0.500 ± 0.115ab 10 0.233 ± 0.067d <0.01a 0.733 ± 0.088hi <0.01a <0.01 77.0 ± 3.0klmn 10.167 ± 0.410n 25 0.067 ± 0.033b <0.01a 0.267 ± 0.088abcde <0.01a <0.01 30.0 ± 4.0abcde 2.367 ± 0.273f C 50 <0.01a <0.01a 0.167 ± 0.067 <0.01a <0.01 59.0 ± 3.0fghijkl 0.533 ± 0.067ab 10 <0.01a 0.100 ± 0.058c 0.700 ± 0.100hi <0.01a <0.01 117.0 ± 3.0o 5.767 ± 0.285k 25 <0.01a 0.067 ± 0.033bc 0.333 ± 0.088abcde 0.033 ± 0.033a <0.01 84.0 ± 6.0mn 1.567 ± 0.285e D 50 <0.01a <0.01a 0.267 ± 0.088abcde <0.01a <0.01 70.0 ± 4.0ijklm 0.400 ± 0.058ab 10 <0.01a <0.01a 0.867 ± 0.088i <0.01a <0.01 78.0 ± 6.0klmn 6.233 ± 0.145l 25 <0.01a <0.01a 0.600 ± 0.058fgh <0.01a <0.01 34.0 ± 7.0abcdef 1.267 ± 0.273de E 50 <0.01a <0.01a 0.300 ± 0.100abcde 0.033 ± 0.033a <0.01 18.0 ± 1.0ab 0.500 ± 0.058ab 10 <0.01a <0.01a 0.633 ± 0.067ghi <0.01a <0.01 68.0 ± 9.0hjklm 4.800 ± 0.115ij 25 <0.01a <0.01a 0.333 ± 0.088abcde 0.033 ± 0.033a <0.01 53.0 ± 2.0efghijk 1.067 ± 0.088cd F 50 Wind ward <0.01a <0.01a 0.133 ± 0.033abc <0.01a <0.01 20.0 ± 5.0abc 0.533 ± 0.088ab Copyright © 2013 SciRes. JEP 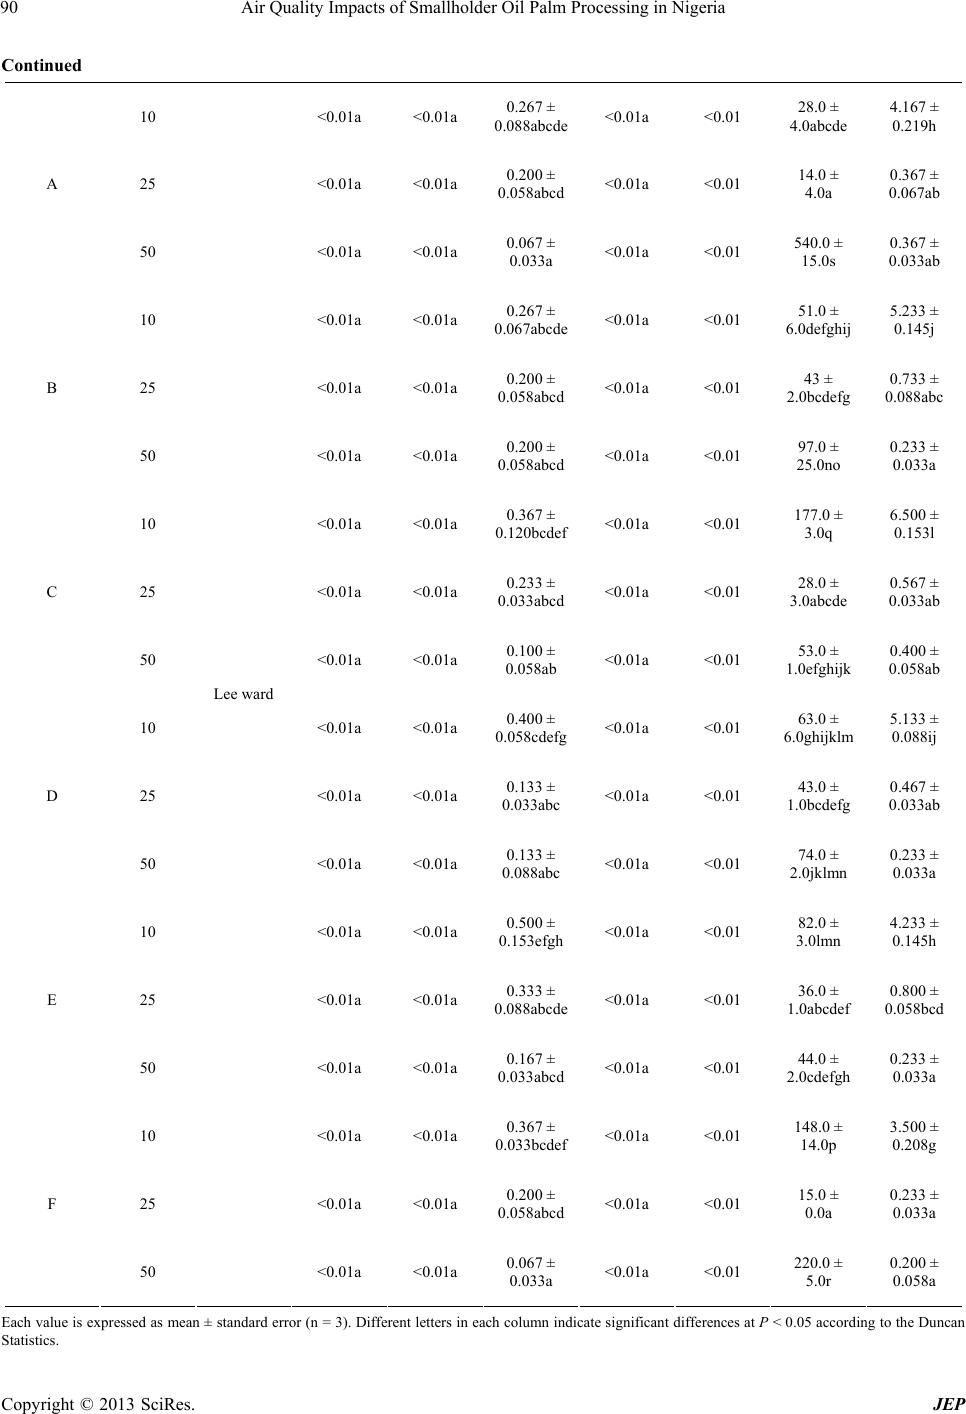 Air Quality Impacts of Smallholder Oil Palm Processing in Nigeria 90 Continued 10 <0.01a <0.01a 0.267 ± 0.088abcde <0.01a <0.01 28.0 ± 4.0abcde 4.167 ± 0.219h 25 <0.01a <0.01a 0.200 ± 0.058abcd <0.01a <0.01 14.0 ± 4.0a 0.367 ± 0.067ab A 50 <0.01a <0.01a 0.067 ± 0.033a <0.01a <0.01 540.0 ± 15.0s 0.367 ± 0.033ab 10 <0.01a <0.01a 0.267 ± 0.067abcde <0.01a <0.01 51.0 ± 6.0defghij 5.233 ± 0.145j 25 <0.01a <0.01a 0.200 ± 0.058abcd <0.01a <0.01 43 ± 2.0bcdefg 0.733 ± 0.088abc B 50 <0.01a <0.01a 0.200 ± 0.058abcd <0.01a <0.01 97.0 ± 25.0no 0.233 ± 0.033a 10 <0.01a <0.01a 0.367 ± 0.120bcdef <0.01a <0.01 177.0 ± 3.0q 6.500 ± 0.153l 25 <0.01a <0.01a 0.233 ± 0.033abcd <0.01a <0.01 28.0 ± 3.0abcde 0.567 ± 0.033ab C 50 <0.01a <0.01a 0.100 ± 0.058ab <0.01a <0.01 53.0 ± 1.0efghijk 0.400 ± 0.058ab 10 <0.01a <0.01a 0.400 ± 0.058cdefg <0.01a <0.01 63.0 ± 6.0ghijklm 5.133 ± 0.088ij 25 <0.01a <0.01a 0.133 ± 0.033abc <0.01a <0.01 43.0 ± 1.0bcdefg 0.467 ± 0.033ab D 50 <0.01a <0.01a 0.133 ± 0.088abc <0.01a <0.01 74.0 ± 2.0jklmn 0.233 ± 0.033a 10 <0.01a <0.01a 0.500 ± 0.153efgh <0.01a <0.01 82.0 ± 3.0lmn 4.233 ± 0.145h 25 <0.01a <0.01a 0.333 ± 0.088abcde <0.01a <0.01 36.0 ± 1.0abcdef 0.800 ± 0.058bcd E 50 <0.01a <0.01a 0.167 ± 0.033abcd <0.01a <0.01 44.0 ± 2.0cdefgh 0.233 ± 0.033a 10 <0.01a <0.01a 0.367 ± 0.033bcdef <0.01a <0.01 148.0 ± 14.0p 3.500 ± 0.208g 25 <0.01a <0.01a 0.200 ± 0.058abcd <0.01a <0.01 15.0 ± 0.0a 0.233 ± 0.033a F 50 Lee ward <0.01a <0.01a 0.067 ± 0.033a <0.01a <0.01 220.0 ± 5.0r 0.200 ± 0.058a Each value is expressed as mean ± standard error (n = 3). Different letters in each column indicate significant differences at P < 0.05 according to the Duncan Statistics. Copyright © 2013 SciRes. JEP 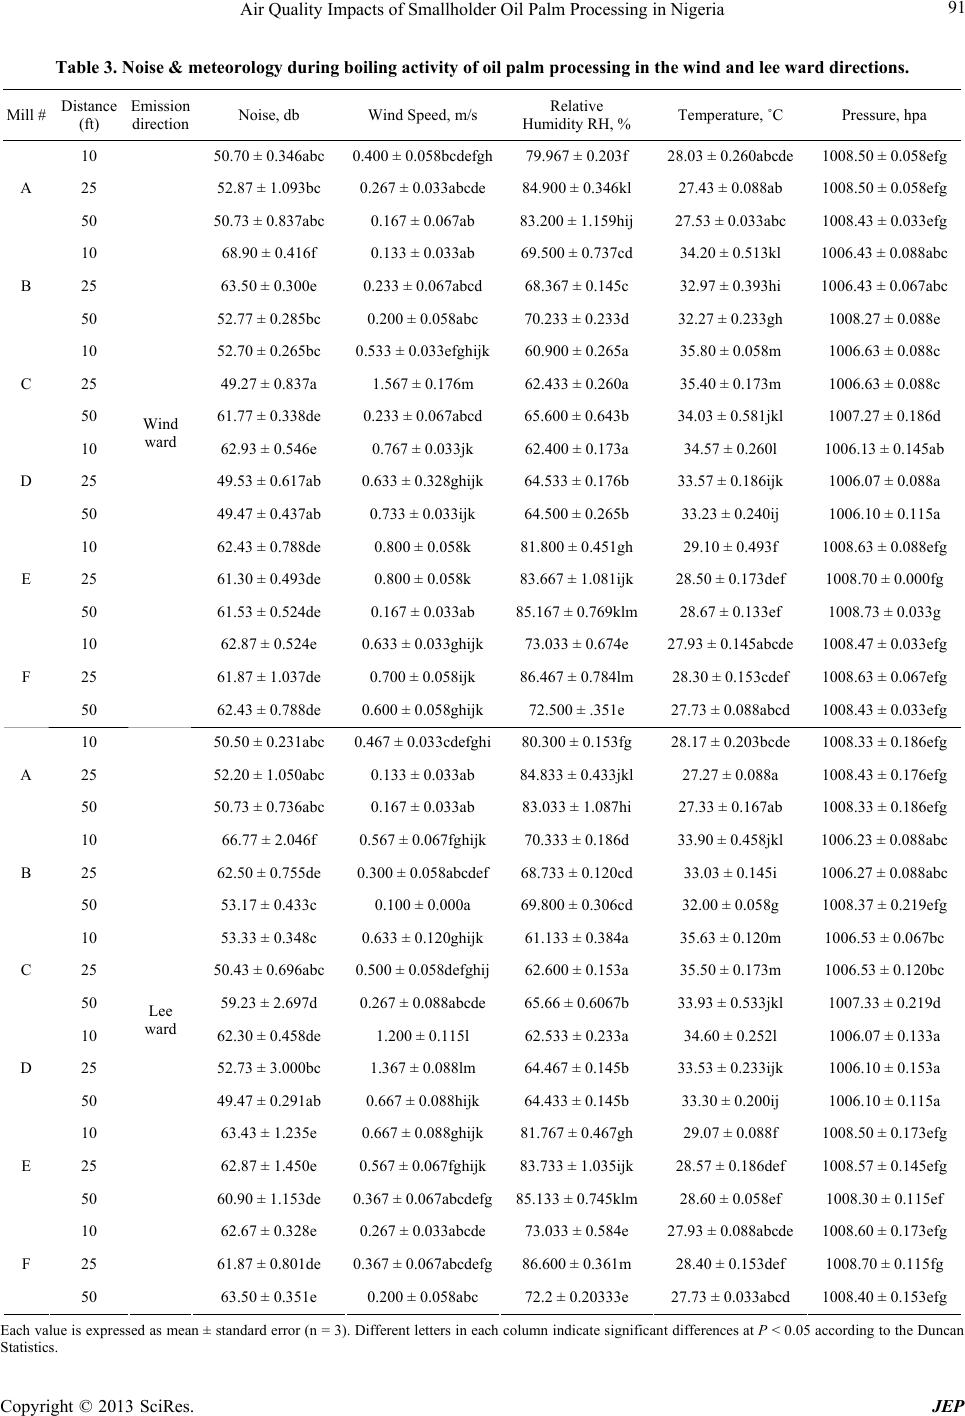 Air Quality Impacts of Smallholder Oil Palm Processing in Nigeria 91 Table 3. Noise & meteorology during boiling activity of oil palm processing in the wind and lee ward directions. Mill # Distance (ft) Emission direction Noise, db Wind Speed, m/s Relative Humidity RH, % Temperature, ˚C Pressure, hpa 10 50.70 ± 0.346abc 0.400 ± 0.058bcdefgh79.967 ± 0.203f 28.03 ± 0.260abcde 1008.50 ± 0.058efg 25 52.87 ± 1.093bc 0.267 ± 0.033abcde84.900 ± 0.346kl 27.43 ± 0.088ab 1008.50 ± 0.058efgA 50 50.73 ± 0.837abc 0.167 ± 0.067ab 83.200 ± 1.159hij 27.53 ± 0.033abc 1008.43 ± 0.033efg 10 68.90 ± 0.416f 0.133 ± 0.033ab 69.500 ± 0.737cd 34.20 ± 0.513kl 1006.43 ± 0.088abc 25 63.50 ± 0.300e 0.233 ± 0.067abcd 68.367 ± 0.145c 32.97 ± 0.393hi 1006.43 ± 0.067abcB 50 52.77 ± 0.285bc 0.200 ± 0.058abc 70.233 ± 0.233d 32.27 ± 0.233gh 1008.27 ± 0.088e 10 52.70 ± 0.265bc 0.533 ± 0.033efghijk60.900 ± 0.265a 35.80 ± 0.058m 1006.63 ± 0.088c 25 49.27 ± 0.837a 1.567 ± 0.176m 62.433 ± 0.260a 35.40 ± 0.173m 1006.63 ± 0.088c C 50 61.77 ± 0.338de 0.233 ± 0.067abcd 65.600 ± 0.643b 34.03 ± 0.581jkl 1007.27 ± 0.186d 10 62.93 ± 0.546e 0.767 ± 0.033jk 62.400 ± 0.173a 34.57 ± 0.260l 1006.13 ± 0.145ab 25 49.53 ± 0.617ab 0.633 ± 0.328ghijk64.533 ± 0.176b 33.57 ± 0.186ijk 1006.07 ± 0.088a D 50 49.47 ± 0.437ab 0.733 ± 0.033ijk 64.500 ± 0.265b 33.23 ± 0.240ij 1006.10 ± 0.115a 10 62.43 ± 0.788de 0.800 ± 0.058k 81.800 ± 0.451gh 29.10 ± 0.493f 1008.63 ± 0.088efg 25 61.30 ± 0.493de 0.800 ± 0.058k 83.667 ± 1.081ijk 28.50 ± 0.173def 1008.70 ± 0.000fg E 50 61.53 ± 0.524de 0.167 ± 0.033ab 85.167 ± 0.769klm28.67 ± 0.133ef 1008.73 ± 0.033g 10 62.87 ± 0.524e 0.633 ± 0.033ghijk73.033 ± 0.674e 27.93 ± 0.145abcde 1008.47 ± 0.033efg 25 61.87 ± 1.037de 0.700 ± 0.058ijk 86.467 ± 0.784lm 28.30 ± 0.153cdef 1008.63 ± 0.067efgF 50 Wind ward 62.43 ± 0.788de 0.600 ± 0.058ghijk72.500 ± .351e 27.73 ± 0.088abcd 1008.43 ± 0.033efg 10 50.50 ± 0.231abc 0.467 ± 0.033cdefghi80.300 ± 0.153fg 28.17 ± 0.203bcde 1008.33 ± 0.186efg 25 52.20 ± 1.050abc 0.133 ± 0.033ab 84.833 ± 0.433jkl 27.27 ± 0.088a 1008.43 ± 0.176efgA 50 50.73 ± 0.736abc 0.167 ± 0.033ab 83.033 ± 1.087hi 27.33 ± 0.167ab 1008.33 ± 0.186efg 10 66.77 ± 2.046f 0.567 ± 0.067fghijk70.333 ± 0.186d 33.90 ± 0.458jkl 1006.23 ± 0.088abc 25 62.50 ± 0.755de 0.300 ± 0.058abcdef68.733 ± 0.120cd 33.03 ± 0.145i 1006.27 ± 0.088abcB 50 53.17 ± 0.433c 0.100 ± 0.000a 69.800 ± 0.306cd 32.00 ± 0.058g 1008.37 ± 0.219efg 10 53.33 ± 0.348c 0.633 ± 0.120ghijk61.133 ± 0.384a 35.63 ± 0.120m 1006.53 ± 0.067bc 25 50.43 ± 0.696abc 0.500 ± 0.058defghij62.600 ± 0.153a 35.50 ± 0.173m 1006.53 ± 0.120bc C 50 59.23 ± 2.697d 0.267 ± 0.088abcde65.66 ± 0.6067b 33.93 ± 0.533jkl 1007.33 ± 0.219d 10 62.30 ± 0.458de 1.200 ± 0.115l 62.533 ± 0.233a 34.60 ± 0.252l 1006.07 ± 0.133a 25 52.73 ± 3.000bc 1.367 ± 0.088lm 64.467 ± 0.145b 33.53 ± 0.233ijk 1006.10 ± 0.153a D 50 49.47 ± 0.291ab 0.667 ± 0.088hijk 64.433 ± 0.145b 33.30 ± 0.200ij 1006.10 ± 0.115a 10 63.43 ± 1.235e 0.667 ± 0.088ghijk81.767 ± 0.467gh 29.07 ± 0.088f 1008.50 ± 0.173efg 25 62.87 ± 1.450e 0.567 ± 0.067fghijk83.733 ± 1.035ijk 28.57 ± 0.186def 1008.57 ± 0.145efgE 50 60.90 ± 1.153de 0.367 ± 0.067abcdefg85.133 ± 0.745klm28.60 ± 0.058ef 1008.30 ± 0.115ef 10 62.67 ± 0.328e 0.267 ± 0.033abcde73.033 ± 0.584e 27.93 ± 0.088abcde 1008.60 ± 0.173efg 25 61.87 ± 0.801de 0.367 ± 0.067abcdefg86.600 ± 0.361m 28.40 ± 0.153def 1008.70 ± 0.115fg F 50 Lee ward 63.50 ± 0.351e 0.200 ± 0.058abc 72.2 ± 0.20333e 27.73 ± 0.033abcd 1008.40 ± 0.153efg Each value is expressed as mean ± standard error (n = 3). Different letters in each column indicate significant differences at P < 0.05 according to the Duncan Statistics. Copyright © 2013 SciRes. JEP 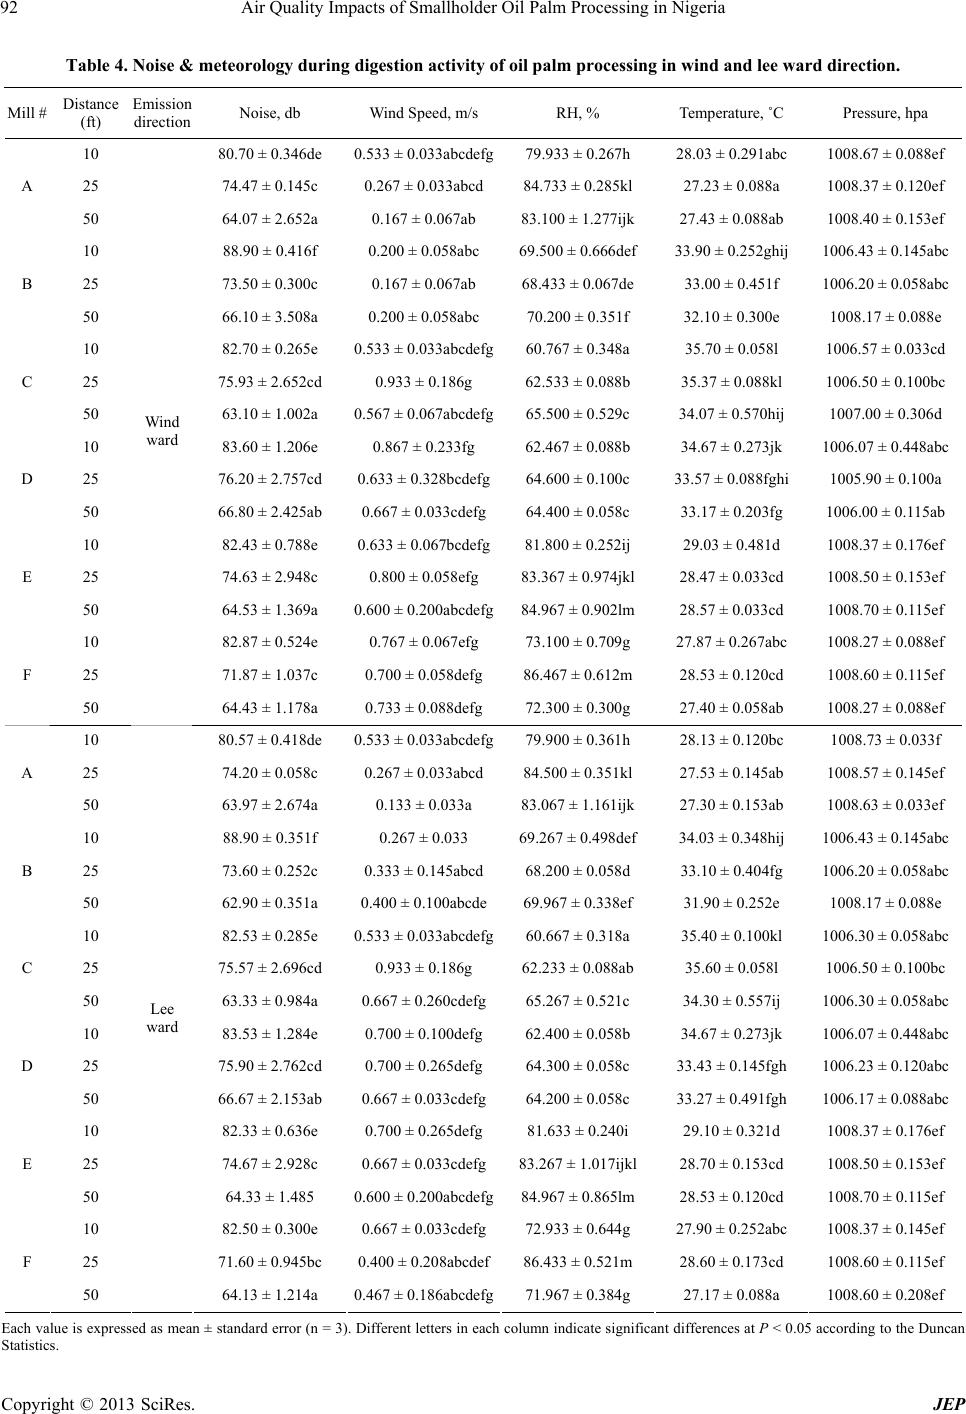 Air Quality Impacts of Smallholder Oil Palm Processing in Nigeria 92 Table 4. Noise & meteorology during digestion activity of oil palm processing in wind and lee ward direction. Mill # Distance (ft) Emission direction Noise, db Wind Speed, m/s RH, % Temperature, ˚C Pressure, hpa 10 80.70 ± 0.346de 0.533 ± 0.033abcdefg79.933 ± 0.267h 28.03 ± 0.291abc 1008.67 ± 0.088ef 25 74.47 ± 0.145c 0.267 ± 0.033abcd 84.733 ± 0.285kl 27.23 ± 0.088a 1008.37 ± 0.120ef A 50 64.07 ± 2.652a 0.167 ± 0.067ab 83.100 ± 1.277ijk 27.43 ± 0.088ab 1008.40 ± 0.153ef 10 88.90 ± 0.416f 0.200 ± 0.058abc 69.500 ± 0.666def 33.90 ± 0.252ghij 1006.43 ± 0.145abc 25 73.50 ± 0.300c 0.167 ± 0.067ab 68.433 ± 0.067de 33.00 ± 0.451f 1006.20 ± 0.058abcB 50 66.10 ± 3.508a 0.200 ± 0.058abc 70.200 ± 0.351f 32.10 ± 0.300e 1008.17 ± 0.088e 10 82.70 ± 0.265e 0.533 ± 0.033abcdefg60.767 ± 0.348a 35.70 ± 0.058l 1006.57 ± 0.033cd 25 75.93 ± 2.652cd 0.933 ± 0.186g 62.533 ± 0.088b 35.37 ± 0.088kl 1006.50 ± 0.100bc C 50 63.10 ± 1.002a 0.567 ± 0.067abcdefg65.500 ± 0.529c 34.07 ± 0.570hij 1007.00 ± 0.306d 10 83.60 ± 1.206e 0.867 ± 0.233fg 62.467 ± 0.088b 34.67 ± 0.273jk 1006.07 ± 0.448abc 25 76.20 ± 2.757cd 0.633 ± 0.328bcdefg64.600 ± 0.100c 33.57 ± 0.088fghi 1005.90 ± 0.100a D 50 66.80 ± 2.425ab 0.667 ± 0.033cdefg64.400 ± 0.058c 33.17 ± 0.203fg 1006.00 ± 0.115ab 10 82.43 ± 0.788e 0.633 ± 0.067bcdefg81.800 ± 0.252ij 29.03 ± 0.481d 1008.37 ± 0.176ef 25 74.63 ± 2.948c 0.800 ± 0.058efg 83.367 ± 0.974jkl 28.47 ± 0.033cd 1008.50 ± 0.153ef E 50 64.53 ± 1.369a 0.600 ± 0.200abcdefg84.967 ± 0.902lm 28.57 ± 0.033cd 1008.70 ± 0.115ef 10 82.87 ± 0.524e 0.767 ± 0.067efg 73.100 ± 0.709g 27.87 ± 0.267abc 1008.27 ± 0.088ef 25 71.87 ± 1.037c 0.700 ± 0.058defg 86.467 ± 0.612m 28.53 ± 0.120cd 1008.60 ± 0.115ef F 50 Wind ward 64.43 ± 1.178a 0.733 ± 0.088defg 72.300 ± 0.300g 27.40 ± 0.058ab 1008.27 ± 0.088ef 10 80.57 ± 0.418de 0.533 ± 0.033abcdefg79.900 ± 0.361h 28.13 ± 0.120bc 1008.73 ± 0.033f 25 74.20 ± 0.058c 0.267 ± 0.033abcd 84.500 ± 0.351kl 27.53 ± 0.145ab 1008.57 ± 0.145ef A 50 63.97 ± 2.674a 0.133 ± 0.033a 83.067 ± 1.161ijk 27.30 ± 0.153ab 1008.63 ± 0.033ef 10 88.90 ± 0.351f 0.267 ± 0.033 69.267 ± 0.498def 34.03 ± 0.348hij 1006.43 ± 0.145abc 25 73.60 ± 0.252c 0.333 ± 0.145abcd 68.200 ± 0.058d 33.10 ± 0.404fg 1006.20 ± 0.058abcB 50 62.90 ± 0.351a 0.400 ± 0.100abcde69.967 ± 0.338ef 31.90 ± 0.252e 1008.17 ± 0.088e 10 82.53 ± 0.285e 0.533 ± 0.033abcdefg60.667 ± 0.318a 35.40 ± 0.100kl 1006.30 ± 0.058abc 25 75.57 ± 2.696cd 0.933 ± 0.186g 62.233 ± 0.088ab 35.60 ± 0.058l 1006.50 ± 0.100bc C 50 63.33 ± 0.984a 0.667 ± 0.260cdefg65.267 ± 0.521c 34.30 ± 0.557ij 1006.30 ± 0.058abc 10 83.53 ± 1.284e 0.700 ± 0.100defg 62.400 ± 0.058b 34.67 ± 0.273jk 1006.07 ± 0.448abc 25 75.90 ± 2.762cd 0.700 ± 0.265defg 64.300 ± 0.058c 33.43 ± 0.145fgh 1006.23 ± 0.120abcD 50 66.67 ± 2.153ab 0.667 ± 0.033cdefg64.200 ± 0.058c 33.27 ± 0.491fgh 1006.17 ± 0.088abc 10 82.33 ± 0.636e 0.700 ± 0.265defg 81.633 ± 0.240i 29.10 ± 0.321d 1008.37 ± 0.176ef 25 74.67 ± 2.928c 0.667 ± 0.033cdefg83.267 ± 1.017ijkl 28.70 ± 0.153cd 1008.50 ± 0.153ef E 50 64.33 ± 1.485 0.600 ± 0.200abcdefg84.967 ± 0.865lm 28.53 ± 0.120cd 1008.70 ± 0.115ef 10 82.50 ± 0.300e 0.667 ± 0.033cdefg72.933 ± 0.644g 27.90 ± 0.252abc 1008.37 ± 0.145ef 25 71.60 ± 0.945bc 0.400 ± 0.208abcdef86.433 ± 0.521m 28.60 ± 0.173cd 1008.60 ± 0.115ef F 50 Lee ward 64.13 ± 1.214a 0.467 ± 0.186abcdefg71.967 ± 0.384g 27.17 ± 0.088a 1008.60 ± 0.208ef Each value is expressed as mean ± standard error (n = 3). Different letters in each column indicate significant differences at P < 0.05 according to the Duncan tatistics. S Copyright © 2013 SciRes. JEP 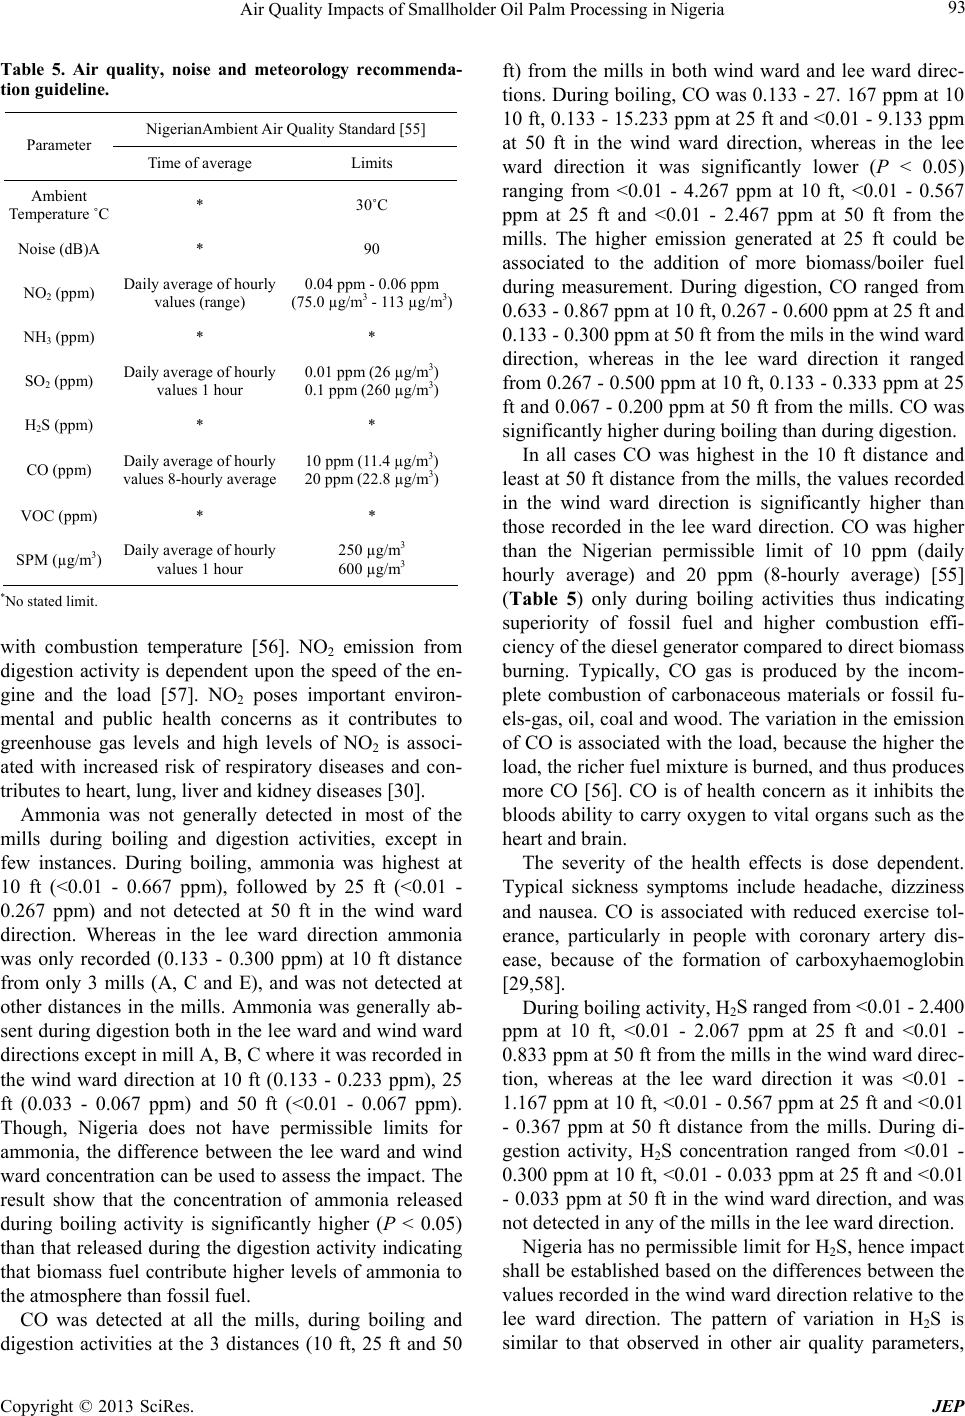 Air Quality Impacts of Smallholder Oil Palm Processing in Nigeria Copyright © 2013 SciRes. JEP 93 Table 5. Air quality, noise and meteorology recommenda- tion guideline. NigerianAmbient Air Quality Standard [55] Parameter Time of average Limits Ambient Temperature ˚C * 30˚C Noise (dB)A * 90 NO2 (ppm) Daily average of hourly values (range) 0.04 ppm - 0.06 ppm (75.0 µg/m3 - 113 µg/m3) NH3 (ppm) * * SO2 (ppm) Daily average of hourly values 1 hour 0.01 ppm (26 µg/m3) 0.1 ppm (260 µg/m3) H2S (ppm) * * CO (ppm) Daily average of hourly values 8-hourly average 10 ppm (11.4 µg/m3) 20 ppm (22.8 µg/m3) VOC (ppm) * * SPM (µg/m3) Daily average of hourly values 1 hour 250 µg/m3 600 µg/m3 *No stated limit. with combustion temperature [56]. NO2 emission from digestion activity is dependent upon the speed of the en- gine and the load [57]. NO2 poses important environ- mental and public health concerns as it contributes to greenhouse gas levels and high levels of NO2 is associ- ated with increased risk of respiratory diseases and con- tributes to heart, lung, liver and kidney diseases [30]. Ammonia was not generally detected in most of the mills during boiling and digestion activities, except in few instances. During boiling, ammonia was highest at 10 ft (<0.01 - 0.667 ppm), followed by 25 ft (<0.01 - 0.267 ppm) and not detected at 50 ft in the wind ward direction. Whereas in the lee ward direction ammonia was only recorded (0.133 - 0.300 ppm) at 10 ft distance from only 3 mills (A, C and E), and was not detected at other distances in the mills. Ammonia was generally ab- sent during digestion both in the lee ward and wind ward directions except in mill A, B, C where it was recorded in the wind ward direction at 10 ft (0.133 - 0.233 ppm), 25 ft (0.033 - 0.067 ppm) and 50 ft (<0.01 - 0.067 ppm). Though, Nigeria does not have permissible limits for ammonia, the difference between the lee ward and wind ward concentration can be used to assess the impact. The result show that the concentration of ammonia released during boiling activity is significantly higher (P < 0.05) than that released during the digestion activity indicating that biomass fuel contribute higher levels of ammonia to the atmosphere than fossil fuel. CO was detected at all the mills, during boiling and digestion activities at the 3 distances (10 ft, 25 ft and 50 ft) from the mills in both wind ward and lee ward direc- tions. During boiling, CO was 0.133 - 27. 167 ppm at 10 10 ft, 0.133 - 15.233 ppm at 25 ft and <0.01 - 9.133 ppm at 50 ft in the wind ward direction, whereas in the lee ward direction it was significantly lower (P < 0.05) ranging from <0.01 - 4.267 ppm at 10 ft, <0.01 - 0.567 ppm at 25 ft and <0.01 - 2.467 ppm at 50 ft from the mills. The higher emission generated at 25 ft could be associated to the addition of more biomass/boiler fuel during measurement. During digestion, CO ranged from 0.633 - 0.867 ppm at 10 ft, 0.267 - 0.600 ppm at 25 ft and 0.133 - 0.300 ppm at 50 ft from the mils in the wind ward direction, whereas in the lee ward direction it ranged from 0.267 - 0.500 ppm at 10 ft, 0.133 - 0.333 ppm at 25 ft and 0.067 - 0.200 ppm at 50 ft from the mills. CO was significantly higher during boiling than during digestion. In all cases CO was highest in the 10 ft distance and least at 50 ft distance from the mills, the values recorded in the wind ward direction is significantly higher than those recorded in the lee ward direction. CO was higher than the Nigerian permissible limit of 10 ppm (daily hourly average) and 20 ppm (8-hourly average) [55] (Table 5) only during boiling activities thus indicating superiority of fossil fuel and higher combustion effi- ciency of the diesel generator compared to direct biomass burning. Typically, CO gas is produced by the incom- plete combustion of carbonaceous materials or fossil fu- els-gas, oil, coal and wood. The variation in the emission of CO is associated with the load, because the higher the load, the richer fuel mixture is burned, and thus produces more CO [56]. CO is of health concern as it inhibits the bloods ability to carry oxygen to vital organs such as the heart and brain. The severity of the health effects is dose dependent. Typical sickness symptoms include headache, dizziness and nausea. CO is associated with reduced exercise tol- erance, particularly in people with coronary artery dis- ease, because of the formation of carboxyhaemoglobin [29,58]. During boiling activity, H2S ranged from <0.01 - 2.400 ppm at 10 ft, <0.01 - 2.067 ppm at 25 ft and <0.01 - 0.833 ppm at 50 ft from the mills in the wind ward direc- tion, whereas at the lee ward direction it was <0.01 - 1.167 ppm at 10 ft, <0.01 - 0.567 ppm at 25 ft and <0.01 - 0.367 ppm at 50 ft distance from the mills. During di- gestion activity, H2S concentration ranged from <0.01 - 0.300 ppm at 10 ft, <0.01 - 0.033 ppm at 25 ft and <0.01 - 0.033 ppm at 50 ft in the wind ward direction, and was not detected in any of the mills in the lee ward direction. Nigeria has no permissible limit for H2S, hence impact shall be established based on the differences between the values recorded in the wind ward direction relative to the lee ward direction. The pattern of variation in H2S is similar to that observed in other air quality parameters, 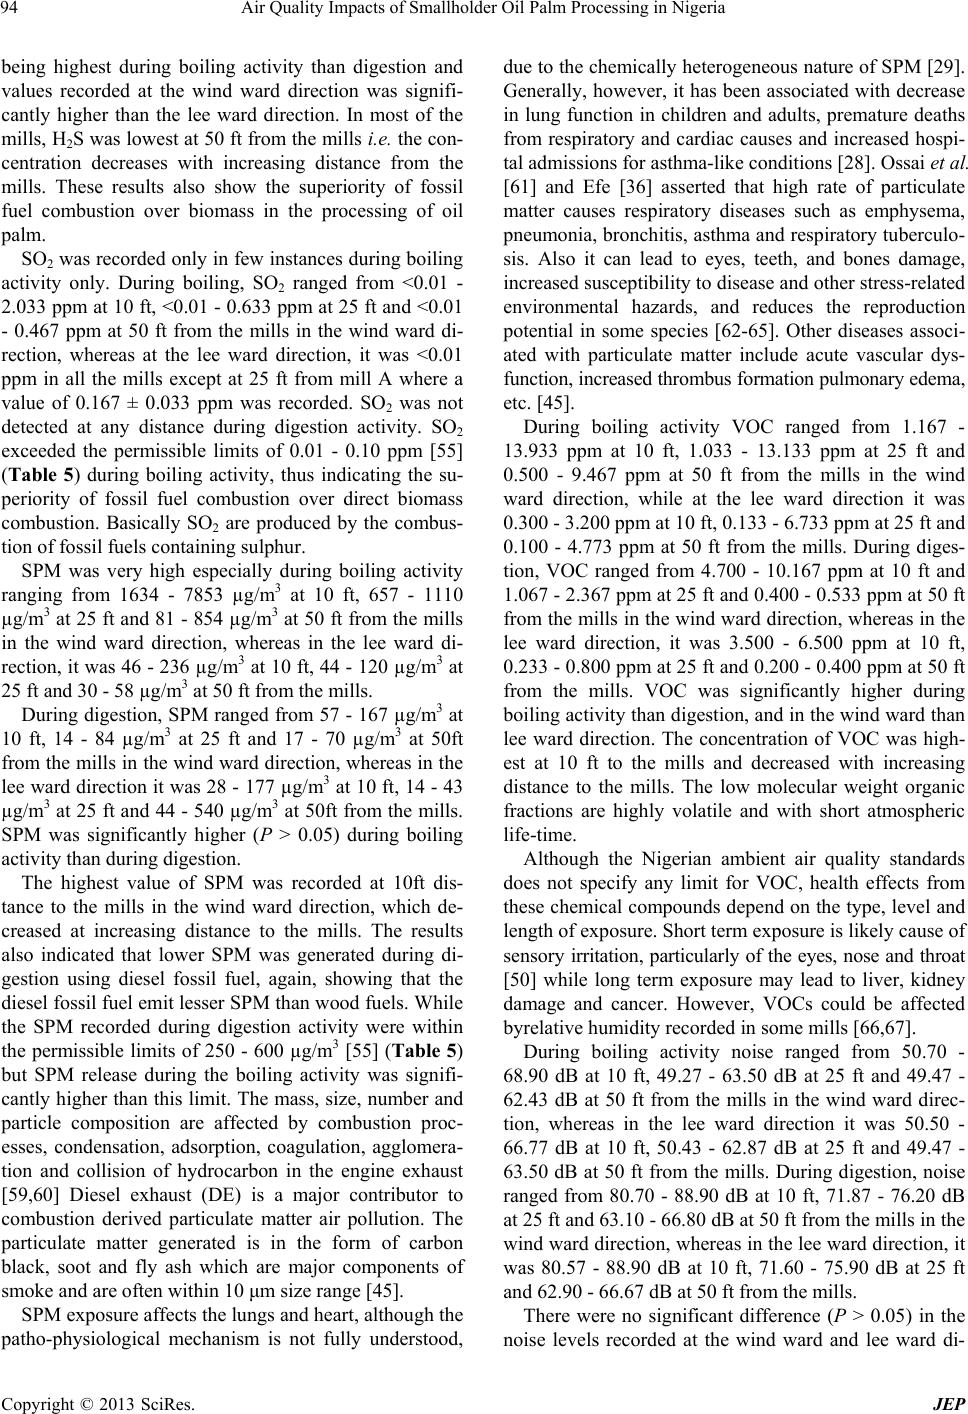 Air Quality Impacts of Smallholder Oil Palm Processing in Nigeria 94 being highest during boiling activity than digestion and values recorded at the wind ward direction was signifi- cantly higher than the lee ward direction. In most of the mills, H2S was lowest at 50 ft from the mills i.e. the con- centration decreases with increasing distance from the mills. These results also show the superiority of fossil fuel combustion over biomass in the processing of oil palm. SO2 was recorded only in few instances during boiling activity only. During boiling, SO2 ranged from <0.01 - 2.033 ppm at 10 ft, <0.01 - 0.633 ppm at 25 ft and <0.01 - 0.467 ppm at 50 ft from the mills in the wind ward di- rection, whereas at the lee ward direction, it was <0.01 ppm in all the mills except at 25 ft from mill A where a value of 0.167 ± 0.033 ppm was recorded. SO2 was not detected at any distance during digestion activity. SO2 exceeded the permissible limits of 0.01 - 0.10 ppm [55] (Table 5) during boiling activity, thus indicating the su- periority of fossil fuel combustion over direct biomass combustion. Basically SO2 are produced by the combus- tion of fossil fuels containing sulphur. SPM was very high especially during boiling activity ranging from 1634 - 7853 µg/m3 at 10 ft, 657 - 1110 µg/m3 at 25 ft and 81 - 854 µg/m3 at 50 ft from the mills in the wind ward direction, whereas in the lee ward di- rection, it was 46 - 236 µg/m3 at 10 ft, 44 - 120 µg/m3 at 25 ft and 30 - 58 µg/m3 at 50 ft from the mills. During digestion, SPM ranged from 57 - 167 µg/m3 at 10 ft, 14 - 84 µg/m3 at 25 ft and 17 - 70 µg/m3 at 50ft from the mills in the wind ward direction, whereas in the lee ward direction it was 28 - 177 µg/m3 at 10 ft, 14 - 43 µg/m3 at 25 ft and 44 - 540 µg/m3 at 50ft from the mills. SPM was significantly higher (P > 0.05) during boiling activity than during digestion. The highest value of SPM was recorded at 10ft dis- tance to the mills in the wind ward direction, which de- creased at increasing distance to the mills. The results also indicated that lower SPM was generated during di- gestion using diesel fossil fuel, again, showing that the diesel fossil fuel emit lesser SPM than wood fuels. While the SPM recorded during digestion activity were within the permissible limits of 250 - 600 µg/m3 [55] (Table 5) but SPM release during the boiling activity was signifi- cantly higher than this limit. The mass, size, number and particle composition are affected by combustion proc- esses, condensation, adsorption, coagulation, agglomera- tion and collision of hydrocarbon in the engine exhaust [59,60] Diesel exhaust (DE) is a major contributor to combustion derived particulate matter air pollution. The particulate matter generated is in the form of carbon black, soot and fly ash which are major components of smoke and are often within 10 μm size range [45]. SPM exposure affects the lungs and heart, although the patho-physiological mechanism is not fully understood, due to the chemically heterogeneous nature of SPM [29]. Generally, however, it has been associated with decrease in lung function in children and adults, premature deaths from respiratory and cardiac causes and increased hospi- tal admissions for asthma-like conditions [28]. Ossai et al. [61] and Efe [36] asserted that high rate of particulate matter causes respiratory diseases such as emphysema, pneumonia, bronchitis, asthma and respiratory tuberculo- sis. Also it can lead to eyes, teeth, and bones damage, increased susceptibility to disease and other stress-related environmental hazards, and reduces the reproduction potential in some species [62-65]. Other diseases associ- ated with particulate matter include acute vascular dys- function, increased thrombus formation pulmonary edema, etc. [45]. During boiling activity VOC ranged from 1.167 - 13.933 ppm at 10 ft, 1.033 - 13.133 ppm at 25 ft and 0.500 - 9.467 ppm at 50 ft from the mills in the wind ward direction, while at the lee ward direction it was 0.300 - 3.200 ppm at 10 ft, 0.133 - 6.733 ppm at 25 ft and 0.100 - 4.773 ppm at 50 ft from the mills. During diges- tion, VOC ranged from 4.700 - 10.167 ppm at 10 ft and 1.067 - 2.367 ppm at 25 ft and 0.400 - 0.533 ppm at 50 ft from the mills in the wind ward direction, whereas in the lee ward direction, it was 3.500 - 6.500 ppm at 10 ft, 0.233 - 0.800 ppm at 25 ft and 0.200 - 0.400 ppm at 50 ft from the mills. VOC was significantly higher during boiling activity than digestion, and in the wind ward than lee ward direction. The concentration of VOC was high- est at 10 ft to the mills and decreased with increasing distance to the mills. The low molecular weight organic fractions are highly volatile and with short atmospheric life-time. Although the Nigerian ambient air quality standards does not specify any limit for VOC, health effects from these chemical compounds depend on the type, level and length of exposure. Short term exposure is likely cause of sensory irritation, particularly of the eyes, nose and throat [50] while long term exposure may lead to liver, kidney damage and cancer. However, VOCs could be affected byrelative humidity recorded in some mills [66,67]. During boiling activity noise ranged from 50.70 - 68.90 dB at 10 ft, 49.27 - 63.50 dB at 25 ft and 49.47 - 62.43 dB at 50 ft from the mills in the wind ward direc- tion, whereas in the lee ward direction it was 50.50 - 66.77 dB at 10 ft, 50.43 - 62.87 dB at 25 ft and 49.47 - 63.50 dB at 50 ft from the mills. During digestion, noise ranged from 80.70 - 88.90 dB at 10 ft, 71.87 - 76.20 dB at 25 ft and 63.10 - 66.80 dB at 50 ft from the mills in the wind ward direction, whereas in the lee ward direction, it was 80.57 - 88.90 dB at 10 ft, 71.60 - 75.90 dB at 25 ft and 62.90 - 66.67 dB at 50 ft from the mills. There were no significant difference (P > 0.05) in the noise levels recorded at the wind ward and lee ward di- Copyright © 2013 SciRes. JEP  Air Quality Impacts of Smallholder Oil Palm Processing in Nigeria 95 rection, indicating that the intensity of noise is unaffected by wind direction. From these results it will appear that noise pollution is not of serious concern during local processing of palm oil. Unlike in the other parameters, noise do not follow wind direction and was significantly higher (P < 0.05) during digestion than during boiling. This is expected because the Lister engine generates noise during digestion. Noise level was below the FEPA stipulated limit of 90 dB [55] (Table 5) during boiling and digestion activities. During boiling activity, atmospheric temperature ranged from 27.93˚C - 35.80˚C at 10 ft, 27.43˚C - 35.40˚C at 25 ft and 27.53˚C - 34.03˚C at 50 ft from the mills in the wind ward direction, whereas it was 27.93˚C - 35.63˚C at 10 ft, 27.27˚C - 35.50˚C at 25 ft and 27.33˚C - 35.93˚C at 50 ft from the mills in the lee ward direction. During digestion, temperature ranged from 27.87˚C - 35.70˚C at 10 ft, 27.23˚C - 35.37˚C at 25 ft and 27.40˚C - 34.07˚C at 50 ft to the mills in the wind ward direction, whereas in the lee ward direction it was 27.93˚C - 35.40˚C at 10 ft, 27.53˚C - 35.60˚C at 25 ft and 27.17˚C - 34.30˚C at 50 ft from the mills. The temperature was found to be greater that the permissible limit of 30˚C [55] (Table 5). Though temperature decreased at increasing distances from the mills, there were no significant dif- ferences between the values recorded at the wind ward and lee ward wind directions and between boiling and digestion processing activities. The wind speed ranged from 0.100 - 1.567 m/s during boiling and 0.133 - 0.933 m/s during digestion, which is classified as light air in the Beaufort scale. The wind speed and direction affected the concentration of air quality parameters but did not influence noise and tem- perature significantly. Relative humidity ranged from 62.40% - 86.60% during boiling and 60.79% - 86.43% during digestion, while pressure ranged from 1006.07 - 1008.73 hpa during boiling and 1006.00 - 1008.87 hpa during digestion. It does appear that relative humidity and pressure has no differential effects on the air quality parameters. The high values obtained in some mills and the distance from the processing activity may be attrib- uted to reduced cloud cover and the influence of moisture laden tropical maritime air mass. However, RH appears to enhance particle deposition [67,68]. The occasional increase in the emission from the longer distance as compared to short distance in some of the parameters is associated to the fueling of boiler fuel during measurement while the digestion activity was enhanced by the loading rate. Other factors are changes in wind speed and direction. This basically influenced both direction (lee and wind ward) measurements. 4. Conclusion This study investigated the air quality during palm oil processing by smallholders in Nigeria. The air quality parameters (NO2, NH3, CO, H2S, SO2, VOC, SPM) dur- ing boiling activity were found to exceed the threshold limits. Emissions during digestion activity were however within the threshold limits. Therefore, emissions during the boiling process could pose serious environmental and public health concern which portends negative implica- tions for environmental sustainability. We recommend the use of improved burners that could emit fewer pol- lutants. Also, government should develop environmental quality guidelines for smallholder oil palm processing activities to ensure environmental sustainability of their operations. 5. Acknowledgements The authors gratefully acknowledges the following un- dergraduates students of Niger Delta University that par- ticipated in the field sampling exercise; Eke Rita, Inatimi Sampson, Obieze Francis, Jeremiah Ikakita, Okonkwo Amaka, Oghenegueke Ejiroghene, Alaka Evelyn, Ereke Samuel, Kakiri Gift, Perewarebo Glory, Biriduba Wo- yengitonyokopa, Clarke Ebisine and Eretinghe Dorcas. The authors also wish to thank Ally Bedford of IDC Ltd. for reviewing the manuscript. REFERENCES [1] S. O. Abah, “HIA Practices in Nigeria,” Impact Assess- ment and Project Appraisal, Vol. 30, No. 3, 2012, pp. 207-213. doi:10.1080/14615517.2012.705064 [2] E. I. Ohimain, E. I. Seiyaboh, S. C. Izah, V. E. Oghene- gueke and T. G. Perewarebo, “Some Selected Physico- Chemical and Heavy Metal Properties of Palm Oil Mill Effluents,” Greener Journal of Physical Sciences, Vol. 2, No. 4, 2012, pp. 131-137. [3] T. F. Ediagbonya, E. E. Ukpebor, F. E. Okieimen and G. E. Okungbowa, “Comparative Study of TSP, Inhalable Particles and Respirable Particles in Urban and Rural Ar- eas in Niger Delta Region of Nigeria,” Greener Journal of Physical Sciences, Vol. 2, No. 3, 2012, pp. 89-96. [4] C. E. Ekpenyong, E. O. Ettebong, E. E. Akpan, T. K. Samson and N. E. Daniel, “Urban City Transportation Mode and Respiratory Health Effect of Air Pollution: A Cross-Sectional Study among Transit and Non-Transit Workers in Nigeria,” BMJ Open, Vol. 2, No. 5, 2012, Ar- ticle ID: e001253. doi:10.1136/bmjopen-2012-001253 [5] World Health Organization, “Estimated Deaths and DA- LYs Attributable to Selected Environmental Risk Factors by WHO Member State, 2002,” 2012. http://www.who.int/entity/quantifying_ehimpacts/country profilesebd.xls [6] S. O. Aghalino, “British Colonial Policies and the Oil Palm Industry in the Niger Delta Region of Nigeria 1900-1960,” African Study Monographs, Vol. 21, No. 1, 2000, pp. 19-33. [7] J. A. Akangbe, G. B. Adesiji, S. B. Fakayode and Y. O. Copyright © 2013 SciRes. JEP  Air Quality Impacts of Smallholder Oil Palm Processing in Nigeria 96 Aderibigbe, “Towards Palm Oil Self-Sufficiency in Nige- ria: Constraints and Training Needs Nexus of Palm Oil Extractors,” Journal of Human Ecology, Vol. 33, No. 2, 2011, pp. 139-145. [8] S. M. A. Tagoe, M. J. Dickinson and M. M. Apetorgbor, “Factors Influencing Quality of Palm Oil Produced at the Cottage Industry Level in Ghana,” International Food Research Journal, Vol. 19, No. 1, 2012, pp. 271-278. [9] J. N. Okechalu, M. M. Dashen, P. M. Lar, B. Okechalu and T. Gushop, “Microbiological Quality and Chemical Characteristics of Palm Oil Sold within Jos Metropolis, Plateau State, Nigeria,” Journal of Microbiology and Biotechnology Research Vol. 1, No. 2, 2011, pp. 107-112. [10] S. C. Izah and E. I. Ohimain, “Microbiological Quality of Crude Palm Oil Produced by Smallholder Processors in the Niger Delta, Nigeria,” Journal of Microbiology and Biotechnology Research, Vol. 3, No. 2, 2013, pp. 30-36. [11] E. G. F. Ngando, M. E. A. Mpondo, E. E. L. Dikotto and P. Koona, “Assessment of the Quality of Crude Palm Oil from Smallholders in Cameroon,” Journal of Stored Products and Postharvest Research, Vol. 2, No. 3, 2011, pp. 52-58. [12] M. U. Dimelu and V. Anyaiwe, “Priorities of Smallholder Oil Palm Producers in Ika Local Government Area of Delta State: Implication for Agricultural Extension Ser- vice in Nigeria,” World Journal of Agricultural Sciences, Vol. 7, No. 2, 2011, pp. 117-123. [13] P. F. Rupani, R. P. Singh, H. Ibrahim and N. Esa, “Re- view of Current Palm Oil Mill Effluent (POME) Treat- ment Methods: Vermicomposting as a Sustainable Prac- tice,” World Applied Sciences Journal, Vol. 11, No. 1, 2010, pp. 70-81. [14] S. Sumathi, S. P. Chai and A. R. Mohamed, “Utilization of Oil Palm as a Source of Renewable Energy in Malay- sia,” Renewable and Sustainable Energy Review, Vol. 12, No. 9, 2008, pp. 2404-2421. doi:10.1016/j.rser.2007.06.006 [15] M. M. Ugbah and C. N. Nwawe, “Trends in Oil Palm Production in Nigeria,” Journal of Food, Agriculture and Environment, Vol. 6, No. 1, 2008, pp. 119-122. [16] United State Department of Agriculture (USDA), “World Agricultural Production,” Foreign Agriculture Series WAP 11-12, USDA, Washington DC, 2012. [17] S. Vermeulen and N. Guad, “Towards Better Practice in Small Holder Palm Oil Production,” National Resources Issue Series No. 5, International Institute for Environment and Development, London, 2006. [18] E. I. Ohimain, C. Daokoru-Olukole, S. C. Izah and E. E. Alaka, “Assessment of the Quality of Crude Palm Oil Produced by Smallholder Processors in Rivers State, Ni- geria,” Nigerian Journal of Agriculture, Food and Envi- ronment, Vol. 8, No. 2, 2012, pp. 28-34. [19] E. I. Ohimain, A. A. Oyedeji and S. C. Izah, “Employ- ment Effects of Smallholder Oil Palm Processing Plants in Elele, Rivers State, Nigeria,” International Journal of Applied Research and Technology, Vol. 1, No. 6, pp. 83- 93. [20] F. I. Olagunju, “Economics of Palm Oil Processing in Southwestern Nigeria,” International Journal of Agricul- tural Economics and Rural Development, Vol. 1, No. 2, 2008, pp. 69-77. [21] M. K. C. Sridhar and O. O. AdeOluwa, “Palm Oil Indus- try Residue,” In: P. S. Nigam and A. Pandey, Eds., Bio- technology for Agro-Industrial Residues Utilization, Spri- nger Science, Berlin, 2009, pp. 341-355. [22] R. P. Singh, A. Embrandiri, M. H. Ibrahim and N. Esa, “Management of Biomass Residues Generated from Oil Mill: Vermicomposting a Sustainable Option,” Resources, Conservation and Recycling, Vol. 55, No. 4, 2011, pp. 423-434. doi:10.1016/j.resconrec.2010.11.005 [23] R. P. Singh, M. H. Ibrahim and N. Esa, “Composting of Waste from Palm Oil Mill: A Sustainable Waste Man- agement Practice,” Review in Environmental Science Bio- technology, Vol. 9, No. 4, 2010, pp. 331-344. doi:10.1007/s11157-010-9199-2 [24] Foundation for Partnership Initiatives in the Niger Delta (PIND), “A report on Palm Oil Value Chain Analysis in the Niger Delta,” 2011, pp. 2-4. www.pindfoundation.net/wp-content/plugins/.../download .php?id=28 [25] Initiative for Public Policy Analysis (IPPA), “African Case Study: Palm Oil and Economic Development in Ni- geria and Ghana; Recommendations for the World Bank’s 2010 Palm Oil Strategy,” 2010. http://www.ippanigeria.org/press/2.html [26] I. Colbeck, Z. A. Nasir, S. Ahmad and Z. Ali, “Exposure to PM10, PM2.5, PM1 and Carbon Monoxide on Roads in Lahore, Pakistan,” Aerosol and Air Quality Research, Vol. 11, 2001, pp. 689-695. [27] C. M. Ma, G. B. Hong and C. T. Chang, “Influence of Traffic Flow Patterns on Air Quality inside the Longest Tunnel in Asia,” Aerosol and Air Quality Research, Vol. 11, 2011, pp. 44-50. [28] T. Adler, “Respiratory Health: Measuring the Health Effects of Crop Burning,” Environ Health Perspectives, Vol. 118, No. 11, 2010, p. A475. doi:10.1289/ehp.118-a475 [29] A. Abelsohn, D. Stieb, M. D. Sanborn and E. Weir, “Identifying and Managing Adverse Environmental Health Effects: 2. Outdoor Air Pollution,” CMAJ, Vol. 166, No. 9, 2002, pp. 161-167. [30] N. O. Umesi, J. T. Ideria and S. Abah, “Background Con- centration of NO2 Prior to Construction and Operation of a Gas-Fired Gas Plant in the Niger Delta Region of Nige- ria,” Environment and Ecology, Vol. 27, No. 2, 2009, pp. 592-602. [31] L. Rantanen, S. Mikkonen, L. Nylund, P. Kociba, M. Lappi and N. O. Nylund, “Effect of Fuel on the Regulated, Unregulated and Mutagenic Emissions of DI Diesel En- gine,” SAE Technical Paper No. 932686, Society of Automotive Engineers, Warrendale, 1993. [32] J. Bunger, J. Krahl, K. Baum, O. Schroder, M. Muller, G. Westphal, P. Ruhnau, T. Schulz and E. Hallier, “Cyto- toxic and Mutagenic Effects Particles Size and Concen- tration Analysis of Diesel Engine Emissions Using Bio- diesel and Petro Diesel as Fuel,” Archieves of Toxicology, Copyright © 2013 SciRes. JEP  Air Quality Impacts of Smallholder Oil Palm Processing in Nigeria 97 Vol. 74, No. 8, 2000, pp. 490-494. doi:10.1007/s002040000155 [33] Y. C. Lin, W. J. Lee and G. C. Fang, “Characterization of Particles Size Distribution from Diesel Engines Fueled with Palm-Biodiesel Blends and Paraffinic Fuel Blends,” Atmospheric Environment, Vol. 42, 2008, pp. 1133-1143. [34] J.-H. Tsai, K.-L. Huang, C.-H. Chiu, C.-C. Lin, W.-C. Kuo, W.-Y. Lin, H.-C. Chaung, T.-H. Yang and S.-J. Chen, “Particle-Bound PAHs and Particle-Extract-Induced Cy- totoxicity of Emission from a Diesel-Generator Fuelled with Soy-Biodiesel,” Aerosol and Air Quality Research, Vol. 11, 2011, pp. 822-836. [35] J. Yanowitz, R. L. McCormick and M. S. Graboski “In- Use Emission from Heavy-Duty Diesel Vehicles,” Envi- ronmental Science & Technology, Vol. 34, No. 5, 2010, pp. 729-740. doi:10.1021/es990903w [36] S. I. Efe, “Spatial Distribution of Particulate Air Pollution in Nigerian Cities: Implications for Human Health,” Jour- nal of Environmental Health Research, Vol. 7, No. 2, 2008, pp. 107-116. [37] W. J. Lee, Y. F. Wang, T. C. Lin, Y. Y. Chen, W. C. Lin, C. C. Ku and J. T. Cheng, “PAH Characteristics in the Ambient Air of Traffic-Source,” Science of the Total En- vironment, Vol. 195, No. 2-3, 1995, 185-200. doi:10.1016/0048-9697(95)04323-S [38] R. M. Harrison, D. J. T. Smith and L. Luhana, “Source Apportionment of Atmospheric Polynuclear Aromatic Hydrocarbons Collected from an Urban Location in Bir- mingham, UK,” Environmental Science and Technology, Vol. 30, No. 3, 1996, pp. 825-832. doi:10.1021/es950252d [39] Y. C. Lin, W. J. Lee, C. C. Chen and C. B. Chen, “Saving Energy and Reducing Emissions of Both Polycyclic Aro- matic Hydrocarbon and Particular Matter by Adding Bio-Solution to Emulsified Diesel,” Environmental Sci- ence and Technology, Vol. 40, No. 17, 2006, pp. 5543- 5559. doi:10.1021/es061120v [40] Y. C. Lin, W. J. Lee and C. B. Chen, “Characterization of Polycyclic Aromatic Hydrocarbon from Diesel Engine by Adding Light Cycle Oil to Premium Fuel,” Journal of the Air and Waste Management Association, Vol. 56, No. 6, 2006, pp. 725-758. doi:10.1080/10473289.2006.10464494 [41] Y. C. Lin, W. J. Lee, C. B. Chen, G. C. Fang and P. J. Tasi, “Impact of Using Fishing Boat Fuel with Higher Polyaromatic Content on the Emission of Polycyclic Aromatic Hydrocarbons from the Diesel Engine,” At- mospheric Environment, Vol. 40, No. 9, 2006, pp. 1601- 1609. doi:10.1016/j.atmosenv.2005.11.013 [42] Y. C. Lin, W. J. Lee and H. C. Hou, “PAH Emissions and Energy Efficiency of Palm-Biodiesel Blends Fueled on Diesel Generator,” Atmospheric Environment, Vol. 40, No. 21, 2006, pp. 3930-3940. doi:10.1016/j.atmosenv.2006.02.026 [43] Y. C. Lin, W. J. Lee, T. S. Wu and C. T. Wang, “Com- parison of PAH and Regulated Harmful Matter Emissions from Biodiesel Blends and Paraffin Fuel Blends on En- gine Accumulated Mileage Test,” Fuel, Vol. 85, No. 17-18, 2006, pp. 2516-2523. doi:10.1016/j.fuel.2006.04.023 [44] H. H. Yang, C. F. Chiang, W. J. Lee, K. P. Hwang and M. F. Wu, “Size Distribution and Dry Deposition of Road Dust PAHs,” Environment International, Vol. 25, No. 5, 1999, pp. 585-597. doi:10.1016/S0160-4120(99)00036-7 [45] G. R. Ana, “Air Pollution in the Niger Delta Area: Scope, Challenges and Remedies,” In: M. Khallaf, Ed., The Im- pact of Air Pollution on Health, Economy, Environment and Agricultural Sources, InTech—Open Access Com- pany, Rijeka, 2011. pp. 182-198. [46] L. S. Kalkstein, “A New Approach to Evaluate the Impact of Climate on Human Mortality,” Environmental Health Perspectives, Vol. 96, 1991, pp. 145-150. doi:10.1289/ehp.9196145 [47] M. Saez, J. Sunyer, A. Tobias, F. Ballester and A. M. Antó, “Ischaemic Heart Disease and Weather Tempera- ture in Barcelona, Spain,” European Journal of Public Health, Vol. 10, No. 1, 2000, pp. 58-63. doi:10.1093/eurpub/10.1.58 [48] L. Makra, S. Z. Tombácz, B. Bálint, Z. Sümeghy, T. Sánta and T. Hirsch, “Influences of Meteorological Pa- rameters and Biological Chemical Air Pollutants on the Incidence of Asthma and Rhinitis,” Climate Research, Vol. 37, No. 1, 2008, pp. 99-119. doi:10.3354/cr00752 [49] Z. Sümeghy, “Influence of Different Factors on Relative air Humidity in Szeged, Hungary,” Acta Climatologica et Chorologica, Vol. 42-43, 2009, pp. 131-141. [50] P. Wolkoff and S. K. Kjærgaard, “The Dichotomy of Relative Humidity on Indoor Air Quality,” Environment International, Vol. 33, No. 6, 2007, pp. 850-857. doi:10.1016/j.envint.2007.04.004 [51] N. L. Nagda and H. E. Rector, “A Critical Review of Re- ported Air Concentrations of Organic Compounds in Air- craft Cabins,” Indoor Air, Vol. 13, No. 3, 2003, pp. 292- 301. doi:10.1034/j.1600-0668.2003.00202.x [52] S. Yusoff, “Renewable Energy from Palm Oil-Innovation on Effective Utilization of Waste,” Journal of Cleaner Production, Vol. 14, No. 1, 2006, pp. 87-93. doi:10.1016/j.jclepro.2004.07.005 [53] K. W. Chan, I. Watson and K. C. Lim, “Use of Palm Oil Waste Material for Increased Production,” In: E. Pussh- parajah and S. L. Anu, Eds., Soil Science and Agricul- tural Development in Malaysia, Malaysia Society of Soil Science, Kuala Lumpur, 1980, pp. 213-242. [54] O. Taiwo, “The Case of Lagos-Air Quality Improvement Project,” Lagos Metropolitan Area Transport Authority (LAMATA), 2005. [55] FEPA, “Guidelines and Standards for Environmental Pollution Control in Nigeria,” Federal Environmental Go- vernment Protection Agency, 1991. [56] S. C. A. de Almeida, C. R. Belchior, M. V. G. Nasci- mento, L. S. R. Vieira and G. Fleury, “Performance of a Diesel Generator Fuelled with Palm Oil,” Fuel, Vol. 81, No. 6, 2002, pp. 2097-2102. doi:10.1016/S0016-2361(02)00155-2 [57] M. S. Graboski and R. L. McCornimik, “Combustion of Fat and Vegetable Oil Derived Fuels in Diesel Engines,” Progress in Energy and Combustion Science, Vol. 24, No. Copyright © 2013 SciRes. JEP  Air Quality Impacts of Smallholder Oil Palm Processing in Nigeria Copyright © 2013 SciRes. JEP 98 2, 1998, pp. 125-164. doi:10.1016/S0360-1285(97)00034-8 [58] Committee of the Environmental and Occupational Health Assembly of the American Thoracic Society, “Health Ef- fects of Outdoor Air Pollution [Review],” American Journal of Respiratory and Critical Care Medicine, Vol. 153, No. 1, 1996, pp. 3-50. [59] P. Ahlink, L. Ntziachristos, J. Keskinen and A. Virtanen, “Real-Time Measurements of Diesel Particle Size Distri- bution with an Electrical Low-Pressure Impactor,” SAE Technical Paper No. 980410, 1998. [60] Z. Ning, C. S. Cheung and S. X. Liu, “Experimental In- vestigation of the Effect of Exhaust Gas Cooling on Die- sel Particulate,” Journal of Aerosol Science, Vol. 35, No. 3, 2004, pp. 333-345. doi:10.1016/j.jaerosci.2003.10.001 [61] E. K. Ossai, G. O. Iniaghe, S. A. Osakwe and P. A. Ag- baire, “Pollution Problems and Environmental Effects of Chemicals,” In: F. K. Ekechi, Reading in General Studies: History and Philosophy of Science, Abraka General Studies Department Publishers DELSU, Abraka, 1999, pp. 83-86. [62] J. J. McAughey, “Regional Lung Deposition and Dose of Ambient Particulates in Humans by Particle Mass and Number,” Research Report, AEA Technology, Aerosol Science Centre, Oxfordshire, 1997. [63] J. Injuk and R. Van Gricken, “Atmospheric Concentra- tions and Deposition of Heavy Metals over the North Sea: a Literature Review,” Journal of Atmospheric Chemistry, Vol. 20, No. 2, 1995, pp. 179-212. doi:10.1007/BF00696557 [64] C. A. III. Pope, D. V. Bates and M. E. Raizenne, “Health Effect of Particulate Air Pollution, Time for Reassess- ment,” Environmental Health Perspectives, Vol. 103, No. 5, 1995, pp. 472-480. doi:10.1289/ehp.95103472 [65] D. R. Blake and F. S. Rowland, “Urban Leakage of Liq- uefied Petroleum Gas and Its Impact on Mexico City Air Quality,” Science, Vol. 269, No. 5226, 1995, pp. 953-956. doi:10.1126/science.269.5226.953 [66] P. Wolkoff, “Impact of Air Velocity, Temperature, Humi- dity, and Air on Long-Term VOC Emissions from Build- ing Products,” Atmospheric Environment, Vol. 32, No. 14-15, 1998, pp. 2659-2668. doi:10.1016/S1352-2310(97)00402-0 [67] L. Fang, G. Clausen and P. O. Fanger, “Impact of Tem- perature and Humidity on Chemical and Sensory Emis- sions from Building Materials,” Indoor Air, Vol. 9, No. 3, 1999, pp. 193-201. doi:10.1111/j.1600-0668.1999.t01-1-00006.x [68] A. Litvak, A. J. Gadgil and W. J. Fisk, “Hygroscopic Fine Mode Particle Deposition on Electronic Circuits and Re- sulting Degradation of Circuit Performance: An Experi- mental Study,” Indoor Air, Vol. 10, No. 1, 2000, pp. 47- 56. doi:10.1034/j.1600-0668.2000.010001047.x [69] A. F. Miguel, A. H. Reis and M. Aydin, “Aerosol Particle Deposition and Distribution in Bifurcating Ventilation Ducts,” Journal of Hazardous Material, Vol. 116, No. 3, 2004, pp. 249-255. doi:10.1016/j.jhazmat.2004.09.013
|