Q. ZUO ET AL.
58
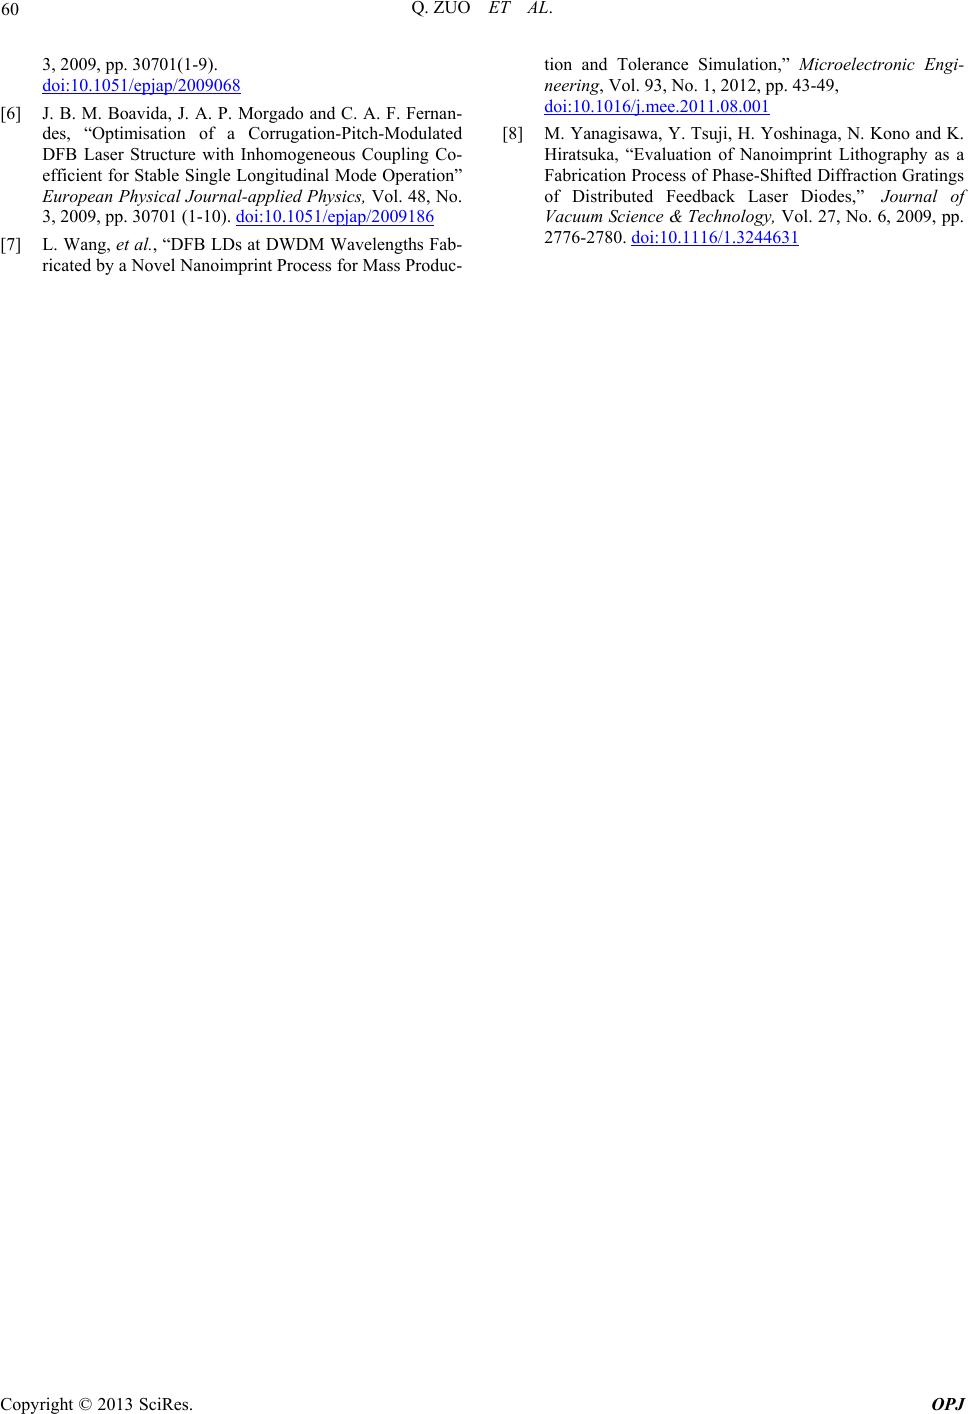
ing is that there are three Bragg-detuned sections with the
grating period bigger than that of the other parts, namely,
the basic period. As shown in Figure 1, 1
r,2
r,3
rar de-
fined as the center of the three CPM parts respectively
and length of the three CPM parts are 1,2, 3.
All these parameters are normalized to the total cavity
length L.
e
)
Lc LcLc
(1,2,3
jj are the grating period of the three CPM
parts respectively. 0
is the basic period. Define the rela-
tive pitch difference of three CPM parts to basic period
as follows:
0
3
0
,1,2,
jj
3
=
(1)
Here the center of the second CPM part is limited to
the center of the cavity. That means 2
r 0.5. So the rest
of parameters need to be optimized are 1, 3, 1,
2,3, ,2,3 and normalized coupling
coefficient (). Think of the fact that the effect of rela-
tive pitch difference to device performance is periodic[4],
the varying range of relative pitch difference is limited
between 0 and is limited between 1 and 3.
The constraints of 1,3,1,2,3 are to avoid the
overlap of the three CPM parts. The other laser parame-
ters used in this paper are summarized in Table 1.
r rLc
Lc Lc 1
KL
3
510
r r
KL
Lc Lc Lc
Figure 1. A simplified schematic diagram for the 3CPM-DFB
laser structure.
Table 1. Summary of laser parameters.
Laser parameters Value
Materials parameters
Spontaneous emission rate, A 2.5 × 10⁸ s-1
Bimolecular recombination coefficient, B 1.0 × 10⁻¹⁶ m3·s-1
Auger recombination coefficient, C 3.0 × 10-41 m6·s-1
Differential gain, A0 2.7 × 10⁻²⁰ m2
Gain curvature, A1 1.5 × 10¹⁹ m-3
Differential peak wavelength, A2 2.7 × 10⁻³² m4
Internal loss, αloss 4.0 × 10³ m-1
Effective index at zero injection, n0 3.41351524
Carrier density at transparency, N0 1.5 × 1024 m-3
Differential index, dn/dN -1.8 × 10⁻²⁶ m3
Group velocity, νg 8.1 × 10⁷ m·s-1
Nonlinear gain coefficient, ε 1.5 × 10⁻²³ m3
Structure parameters
Active layer width, w 1.5 μm
Active layer thickness, d 0.12 μm
Cavity length, L 500 μm
Optical confinement factor, Г 0.35
Grating period, Λ 227.039 nm
2.2. Grating Structure Optimization
To do the threshold analysis, sophisticated TMM-based
laser model is used [5-6]. The cavity is divided into
seven concatenated sections to ensure structure parame-
ters in each section are constant. For a given set of struc-
ture parameters, the entire lasing mode and their thresh-
old gain can be obtained based on TMM model. Then the
mode selectivity and field flatness can be calculated.
They are defined by
2
0
1
;()
L
th
LL LFIzId
L
z (2)
Where th L
and L
are the normalized gain of the
lasing mode and the main side mode respectively.
z
is the normalized electric field intensity at position z and
I is its average value along the cavity. The set of struc-
ture parameters mentioned in section 2.1 are scanned and
updated with the similar step by step procedures that are
clearly presented in reference [5,6]. In every step, the big-
ger L
and smaller F than the previous step can be
picked out and the corresponding structure parameters
can be updated. Then other parameters are ready to opti-
mized. This process is repeated until no improvements on
L
and F are achieved.
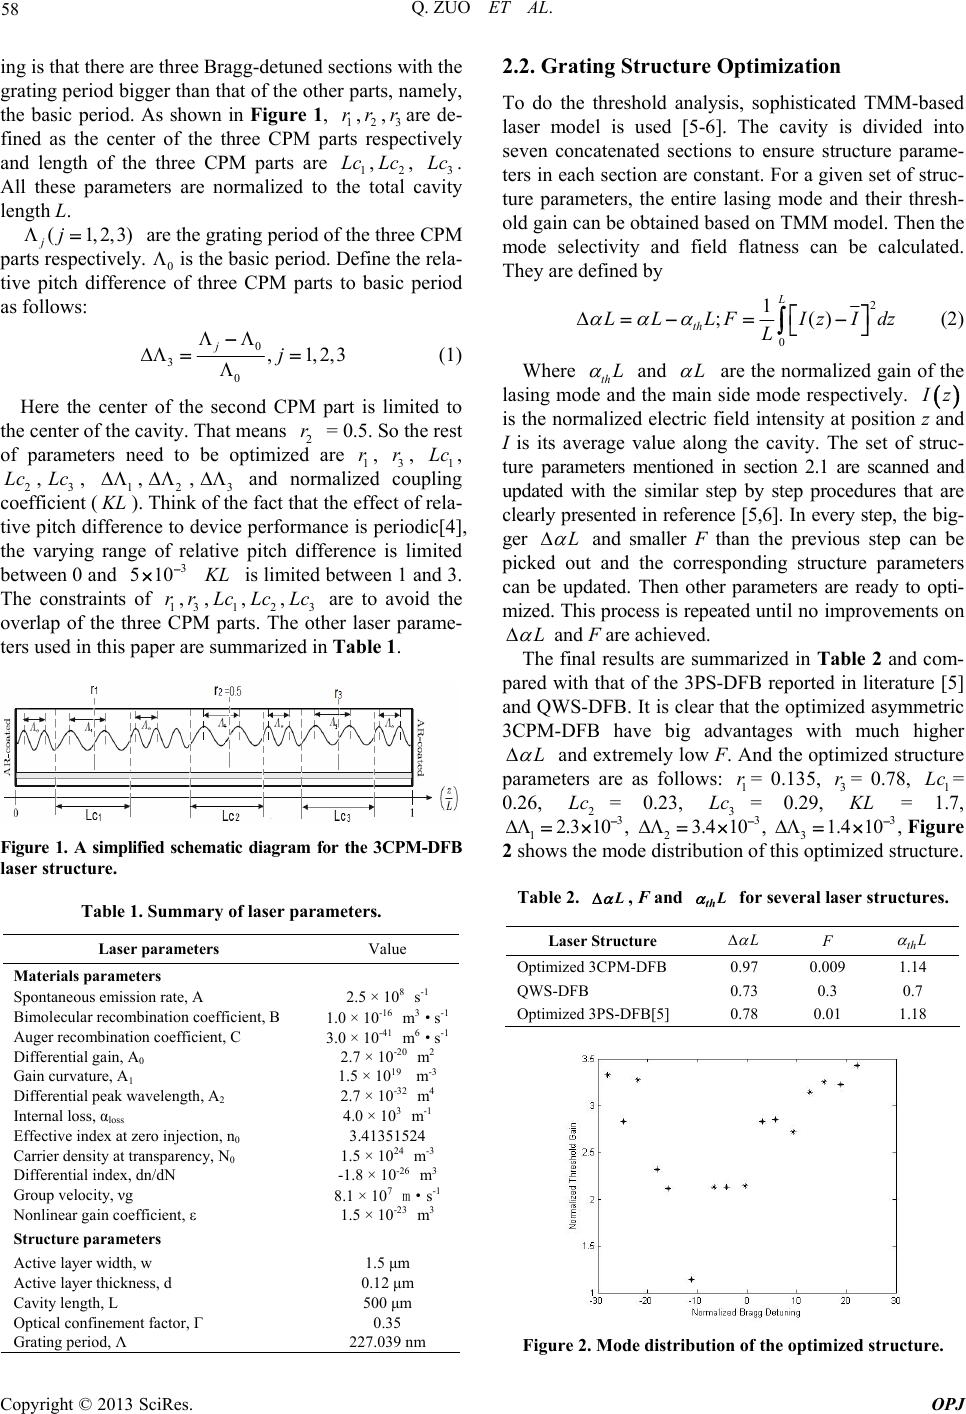
The final results are summarized in Table 2 and com-
pared with that of the 3PS-DFB reported in literature [5]
and QWS-DFB. It is clear that the optimized asymmetric
3CPM-DFB have big advantages with much higher
L
and extremely low F. And the optimized structure
parameters are as follows: = 0.135, 3= 0.78, 1=
0.26, = 0.23, = 0.29, = 1.7,
1
r
3
rLc
2
Lc
2.3 1
Lc KL
3
0 ,
1
2
3
10
3. , 4 3
3, 1.4 10
Figure
2 shows the mode distribution of this optimized structure.
Table 2.
L, F and for several laser structures.
thL
Laser Structure
F th
Optimized 3CPM-DFB 0.97 0.009 1.14
QWS-DFB 0.73 0.3 0.7
Optimized 3PS-DFB[5] 0.78 0.01 1.18
Figure 2. Mode distribution of the optimized structure.
Copyright © 2013 SciRes. OPJ