Journal of Biomedical Science and Engineering
Vol.7 No.5(2014), Article ID:44671,18 pages DOI:10.4236/jbise.2014.75029
Arteriovenous Shunt Stenosis Evaluation Using a Fractional-Order Fuzzy Petri Net Based Screening System for Long-Term Hemodialysis Patients
Wei-Ling Chen1,2, Chung-Dann Kan3, Chia-Hung Lin4*
1Department of Biomedical Engineering, National Cheng Kung University, Tainan City, Taiwan
2Department of Engineering and Maintenance, Kaohsiung Veterans General Hospital, Kaohsiung City, Taiwan
3Department of Surgery, National Cheng Kung University Hospital, Tainan City, Taiwan
4Department of Electrical Engineering, Kao-Yuan University, Kaohsiung City, Taiwan
Email: lynnchen.k@gmail.com, kcd56@mail.ncku.edu.tw, *eechl53@gmail.com
Copyright © 2014 by authors and Scientific Research Publishing Inc.
This work is licensed under the Creative Commons Attribution International License (CC BY).
http://creativecommons.org/licenses/by/4.0/


Received 2 March 2014; revised 3 April 2014; accepted 10 April 2014
ABSTRACT
This paper proposes the evaluation of arteriovenous shunt (AVS) stenosis using a fractional-order Fuzzy Petri net based screening system for long-term hemodialysis treatment of patients. The screening system uses the Burg method, the fractional-order chaos system, and the Fuzzy Petri net (FPN) for early detection of AVS dysfunction. The Burg method is an autoregressive (AR) model that is used to estimate the frequency spectra of a phonoangiographic signal and to identify the spectral peaks in the region from 25 Hz to 800 Hz. In AVS, the frequency spectrum varies between normal blood flow and turbulent flow. The power spectra demonstrate changes in frequency and amplitude as the degree of stenosis changes. A screening system combining fractional-order chaos system and FPN is used to track the differences in the frequency spectra between the normal and stenosis access. The dynamic errors are indexes that can be used to evaluate the degree of AVS stenosis using a FPN. For 42 long-term follow-up patients, testing results show that the proposed screening system is more efficient in the evaluation of AVS stenosis.
Keywords:Arteriovenous Shunt (AVS); Fractional-Order Self-Synchronization Error; Burg Method; Phonoangiographic Signal; Fuzzy Petri Net (PN)

1. Introduction
Chronic kidney disease (CKD) is a worldwide public health problem with high rates of morbidity and mortality [1] . According to reports from the Department of Health (DOH), the rate of end stage renal disease (ESRD) in Taiwan is 2447 per million [2] . CKD is usually an irreversible and progressive disease and has five stages of severity. Patients are treated with hemodialysis, peritoneal dialysis, or a kidney transplant. Hemodialysis is one of the treatment choices for these patients and arteriovenous shunt (AVS) is vital for hemodialysis therapy, because it makes a surgical connection between an arterial anastomosis site and a venous anastomosis site. AVS occlusion and failure causes turbulent flow, high wall shear stress, and high blood pressure [3] . In clinical examinations, for visualization of the vascular access, using angiography is the gold standard for the diagnosis of stenosis [4] . Flow rates for arteriovenouse grafts typical range from 600 - 1000 ml/min, which is necessary for efficient hemodialysis, but can cause flow transition to a turbulent state that is discernable by a palpable thrill or audible bruit [5] . Stenoses are often associated with unusual blood sounds, resulting from turbulent flow over a narrowed blood vessel [6] . These auscultatory sounds can be recorded by one or two electronic stethoscopes and diagnosis is made or confirmed before and after angiography, which was accompanied by angioplasty [7] -[9] . As an early detection tool, phono-angiographic signals provide a non-invasive and low cost technique to monitor the sounds of an AVS.
Studies [10] -[12] have shown that stenosis produces a general increase in sound level and new high frequency components in the power spectra. Frequency analysis, such as Fourier transform and wavelet transform, is used to preprocess the phonoangiographic signals. The changes in frequency and amplitude are dependent on the stenosis site and its severity, and appear as frequency peaks in the region from 100 Hz to 800 Hz in the sound recording from stenotic vessels. Prior studies have indicated an increase in the high-frequency component (300 Hz - 800 Hz) of phono-angiographic signals, following a higher degree of stenosis. Fourier transform is a non- parametric method for the estimation of power spectra. However, it is not an optimal method, because it suffers from spectral leakage effects due to the size of the sampling window. Wavelet transform [12] is a parametric method that provides better frequency resolution than non-parametric methods. Significant features are extracted at specific coefficients with different types of wavelets and a trial procedure of wavelet decomposition. The Burg method is also a parametric method for the estimation of frequency spectra; this method can use a small data set to reduce the number of stored samples and memory requirements [13] -[16] . It produces smoother spectra than the Fourier transform method, but it is susceptible to frequency shifts. Thus, the Burg method is used to find the characteristic frequencies from phono-angiographic signals. However, it lacks an automatic diagnosis function.
In addition, heartbeat regulation and blood flow show non-linear characteristics. The morphology of blood vessels includes circumferential, longitudinal, and radial deformation. A non-uniform laminar flow causes turbulent flow and anomalous diffusion in the stenosis vessel. This phenomenon can be described as fractionalorder diffusion [17] -[19] . Fractional-order chaos systems (FOCSs) are used to construct self-synchronization error formulation for systems characterized by random signals and to identify a broad range of anomalous phenomena and frequency spectra. Therefore, Chen-Lee based fractional-order chaos system is used to track the differences in the frequency spectra between normal condition and AVS stenosis. This approach uses a master system (MS) and a slave system (SS). Using a coupling variable, the dynamic error equations are defined as the differences between the SS and the MS. These differences are used as indexes for presenting the degree of AVS stenosis. The Fuzzy Petri net [20] -[23] is a dynamic and marked graphical system. This system has been extended to develop an inference algorithm to deal with Fuzzy reasoning problems and multi-criteria decisionmaking applications. It is used for representing Fuzzy inference rules in knowledge based systems, and can perform Fuzzy reasoning. The decision-making system developed in this study combines signal processing, fractional-order chaos system, and Fuzzy Petri net to evaluate the degree of AVS stenosis.
For 42 long-term follow-up patients, the results show that the proposed screening system is more efficient for AVS stenosis evaluation. The remainder of this paper is organized as follows: Section 2 addresses the problem formulation and Sections 3 and 4 describe the methodology and screening system implementation, respectively. In Sections 5 and 6, experimental results and conclusions are provided to show the efficiency of the proposed method.
2. Problem Formulation
Arteriovenous shunts, including arteriovenous fistula (AVF) and arteriovenous graft (AVG), are the pathological physiology created on a patient’s forearm and upper-arm to facilitate the hemodialysis process in ESRD patients. As daily sites for hemodialysis, these vascular accesses must be punctured every two days. The maintenance of the proper function and morphology of these vascular accesses is the most important issue for uremic patients. After repeated puncturing of the vascular accesses and long-term use, the interior of the accesses can exhibit pathologic changes, including the formation of a thrombus, intimal hyperplasia and changes in the aneurysmal deformability of the access, as shown in Figure 1. AVS stenosis is the pathologic change of AVS and most commonly occurs in patients receiving long-term hemodialysis therapy. Over 85% of documented reports, the most common cause is stenotic lesions at the arteriovenous anastomosis or along the proximal venous limb.
More than 75% of narrowing of the lumen diameter in the vascular access may result in a need for percutaneous transluminal angioplasty (PTA) or surgical revision [7] to clear the residual thrombus and dilate the stenotic segment. In clinical practice, Doppler ultrasound, phonoangiography, and angiography (X-ray) are used to detect the presence of a stenosis inside these vascular accesses [9] [10] . Stationary instruments provide reliable techniques and high accuracy in clinical assessment. However, they are not suitable for early detection or homecare applications by the patients themselves.
Clinical physicians also sometimes use a stethoscope to evaluate the condition of vascular accesses. This is a simple, non-invasive, and non-expensive technique for monitoring the vascular access functions. The literature shows that the phonoangiographic (PCG) signal of AVS stenosis produces higher frequency components in the frequency spectra and spectral changes in frequency and magnitude [11] -[13] . As shown in Figure 2, an electric stethoscope can be used to record the PCG signals originating from AVF and AVG [8] . Using this information, the frequency spectra are used to determine the parameters for stenosis evaluation. Frequency feature extraction from PCG signals was obtained using the fractional-order chaos system (FOCS). Finally, Fuzzy Petri net was proposed to screen the degrees of AVS stenosis.
3. Methodology Description
3.1. Frequency Feature Extraction
The Burg method was used to estimate the frequency spectra by fitting an autoregressive (AR) model of a given specific order to the PCG signals. This was used to estimate the power spectral density function associated with the phonoangiographic signals. Each sample of a signal can be expressed as a linear combination of previous samples and residual values resi. With a discrete set of n sampling points, K coefficients are used to approximate the original data of xi, where i = 1, 2, 3, …, n, presented as [13] [14]
 (1)
(1)
where xi represents the signal samples in this study and K is the AR model order, where k = 1, 2, 3, …, K, and gk stands for the model coefficients of the AR model.
This method uses the optimal parameters gk to minimize the square error between the original and the ap-
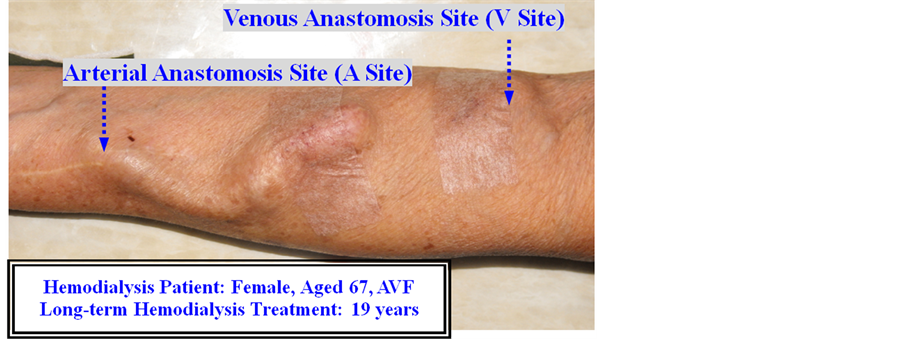
Figure 1. The aneurysmal deformability of the access.
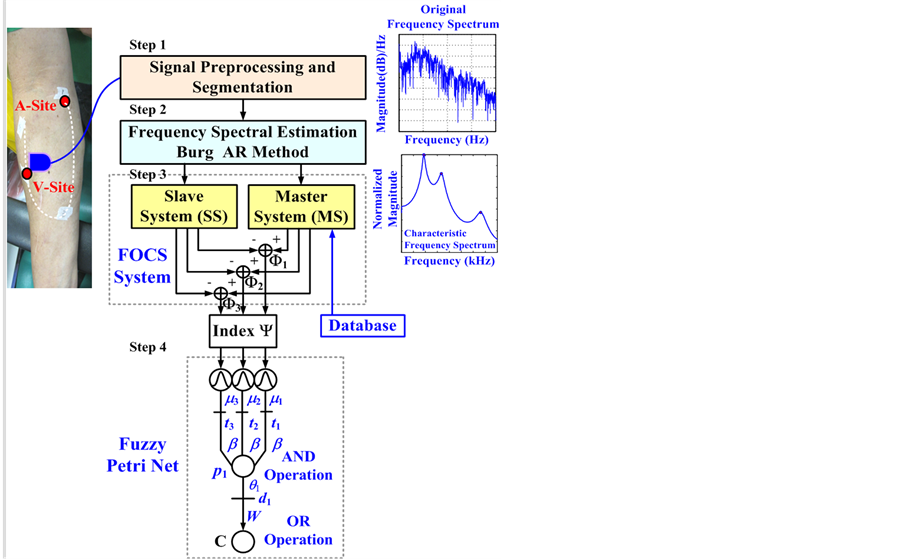
Figure 2. The block diagram of proposed screening system.
proximated data. Forward and backward linear prediction requires the minimization of Fk and Hk, as [15]
 (2)
(2)
 (3)
(3)
where wi, iÎ[k, n], is a linear weighted combination of k previous known data, and zi, iÎ[0, n-k], is a linear weighted combination of k next known data. The sum of the residual energies at stage k is Ek = Fk + Hk. The Levinson-Durbin recursion algorithm is used to minimize the total sum of the forward and backward prediction errors for determining the model coefficients [16] .
The frequency spectra are normalized between zero and one, making it easy to find the characteristic frequencies. The frequency spectra for AVS stenosis and the normal condition are shown in Figure 3(a) and Figure 3(d), respectively. It can be seen that the characteristic frequencies have the distinguishing peak amplitude of central spectra and occupy different frequency bands. These characteristic frequencies provide indices for the detection of AVS stenosis and the evaluation of the AVS degree.
3.2. Self-Synchronization Error Formulation (SSEF)
Synchronized chaotic systems are widely used in non-linear physical applications and physical informatics.
Generally, a chaotic system consists of a master system (MS) and a slave system (SS), whose behavior can mimic each another [24] [25] . Typical chaos synchronization (CS) system can be described as Master System: (4)
(4)
Slave System: (5)
(5)
where X = [x1, x2, x3]T and Y = [y1, y2, y3]T are state variables, A(X) and A(Y) are termed the coefficient matrices, and U = [u1, u2, u3]T is the control input.
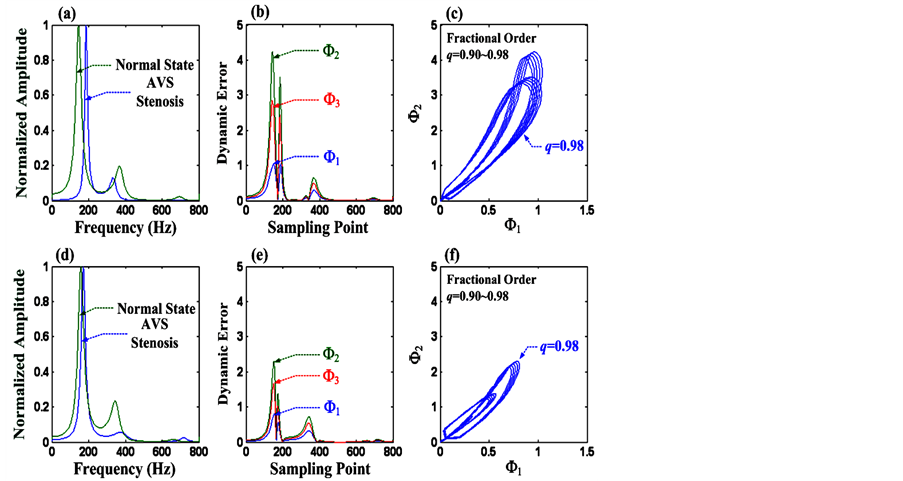
Figure 3. (a) and (d) Frequency spectra of normal or abnormal AVS, (b) and (e) Dynamic errors F1, F2, and F3, with fractional order q = 0.98 and system parameters a’ = 1.983, b’ = −3.966, and c’ = −2.9745, (c) and (f) Phase diagram of F1 versus F2, with fractional orders q = 0.90 - 0.98.
Many phenomena and human physiologies demonstrate chaotic behaviors, fractional-order dynamics and non-linear characteristics. A non-uniform laminar flow causes turbulent flow and murmurs in the coronary artery, stenosis vessel, involving high-pitch stenosis murmurs [26] -[29] . The fractional-order differentiator has been proposed to track the differences of frequency spectra between normal and abnormal AVS. According to the definition by Grünwald-Letnikov [18] [19] , the fractional rate of change of frequency spectra can be expressed as
 (6)
(6)
where x is the relative frequency spectrum for all α, and e is any real number. If parameter α is taken as 1, then the rate of change is like a slope. The choice of the parameter α determines the phenomena that are modeled. By selecting α for the range 0 to 1, the Equation (4) can be referred to as the fractional rate of changes, and anomalous phenomena can be described.
The Chen-Lee system exhibits good symmetrical behavior and is widely used in CS applications [24] [25] . It is a simplified mathematical model of a chaotic attractor. The master system and the slave system with a control term can be represented as Master System: (7)
(7)
Slave System: (8)
(8)
where a, b, and c are system parameters. In order to track self-synchronization errors, the control term u1 = u2 = u3 = 0, is used. The errors are defined as e1 = (x1 − y1), e2 = (x2 − y2), and e3 = (x3 − y3), e = [e1, e2, e3]T, and Equation (8) is subtracted from Equation (7), so the dynamics of error system can be represented as
 (9)
(9)
In order to express the fractional-order diffusion, a fractional-order error system is used, and the ordinary differential system (9) can be modified by fractional-order derivatives as follows [29] [30] :
 (10)
(10)
where q = (1 − α) is the fractional order that satisfies 0 < q £ 1, α is the even value rounded up to the nearest integer 1, and G(·) is the Gamma function (G(1) = G(2) = 1). This is the definition of usual derivatives when the order q = 1 (α = 0). System (9) acts as a chaotic attractor, satisfying [29] [30]
 (11)
(11)
where the system parameters, a’, b’, and c’, are nonzero constants. The phase trajectories show various dynamic behaviors when the fractional order is q.
For computer implementation, discrete fractional-order chaos system is proposed to detect AVS and to evaluate the outcome of a surgical operation. Let the error states be e1[i] = x[i] − y[i], e2[i] = x[i + 1] − y[i + 1], and e3[i] = x[i + 2] − y[i + 2], i = 1, 2, 3, …, n − 2, so the self-synchronization error formulations, F1[i], F2[i], and F3[i] are defined, as
 (12)
(12)
 (13)
(13)
 (14)
(14)
where x[i], x[i + 1], and x[ i + 2] represent the data sequence of the frequency spectra using the reference/baseline data after/before percutaneous transluminal angioplasty (PTA) treatment, y[i], y[i + 1], and y[i + 2] represent the data sequence of undergoing further collection of data based on routine examinations, and n is the integer number of the frequency.
The self-synchronization error formulations have three dynamic errors and they change their values depending on the error states, e1, e2, and e3. With the maximum values, max{F1[i]}, F1ÎRn-2, max{F2[i]}, F2ÎRn−2, and max{F3[i]}, F3ÎRn−2, we evaluate the degree of AVS stenosis using the index, Y, as in [30]
 (15)
(15)
It is expected that the vibration and turbulent flow caused by stenosis produce different central spectra and frequency bands. Refer to Figure 3(a) and Figure 3(d), the dynamic errors, F1[i], F2[i], and F3[i], i = 1, 2, 3, …, n − 2 (n = 800), can be calculated using the system parameters a = 2, b = −4, and c = −3, in Equation (11). When the fractional order q = 0.98, the dynamic errors are also identified using the system parameters a’ = 1.983, b’ = −3.966, and c’ = −2.9745, as shown in Figure 3(b) and Figure 3(e). Using fractional orders, the dynamic behaviors of a FOCS become relatively broad, and a broad range of features is identified. Figure 3(c) and Figure 3(f) show the phase diagram for F1 versus F2 with fractional orders q = 0.90 - 0.98. The self-synchronization errors seem similar and stable, and the scaling factors, a’, b’, and c’, control the phase trajectories of the chaotic motion and could be bounded within a limited region. We hypothesize that the origin is a stable point under a normal condition and that the phase trajectories increase as the stenosis become more serious.
3.3. Fuzzy Petri Net (FPN)
A set of Fuzzy IF-THEN rules is commonly used to represent linguistic inference rules. Let inference rule R = {R1, R2, R3, …, Rr, …, RNr}, where the form of the rth rule be presented as Rr: IF Yr THEN C (CF = mr) (16)
where Yr and C are propositions, each proposition is a real value, and mr is the value of the certainty factor (CF), mrÎ [0,1]. The CF can indicate the grade of membership of mr r = 1, 2, 3, …, Nr, in the Fuzzy set, including triangular, trapezoid, and Gaussian membership function. A Gaussian membership function can be parameterized by a mean and a standard deviance, sr. It is a nonlinear classifier and is defined by
 (17)
(17)
The larger the value of mr, and the more confidence is confirmed.
We can use a Fuzzy Petri net (FPN) to represent the Fuzzy IF-THEN rules of a rule-based system. The FPN is a marked graphical system, containing two types: places (P) and transitions (T), where circle symbols represent places, and bar symbols represent transitions. Each transition is associated with a CF value between zero and one. In this study, the definition of the FPN is as follows [20] -[23] :
FPN=(P, T, D, y, C, m, q, b, W) (18)
PÇTÇD=Æ ánd |P|=|D|
where P = {p1, p2, p3, …, pNp} is a finite set of places, T = {t1, t2, t3, …, tNt} is a finite set of transitions, D = {d1, d2, d3, …, dNp} is a finite set of propositions, y = {y1, y2, y3, …, yNr} is the input function, a mapping from transitions to desired places, C = {C1, C2, C3, …, CNc} is the output function, a mapping from transitions to desired places, m = {m1, m2, m3, …, m Nr} is a membership function, defined in [0,1] from inputs to transitions, q = {q1, q2, q3, …, qNt} is a membership function, defined in [0,1] from places to transitions, b is a weighted value from transitions to desired places, and W is a weighted value from transitions to desired outputs. The structure of FPN can be represented by a rule connectivity graphical system, as shown in Figure 4. According to this theory, inference functions contain “AND” or “OR” operators with min and max composite operations, which is known as “multivalued logic (Boolean rule of C. G. Looney [31] )”. In this study, indexes Y, provide key information for making decision rules for an FPN based screening system.
4. Screening System Implementation
4.1. Signal Preprocessing
Long-term hemodialysis treatment of patients was chosen for clinical investigation at the Department of Surgery, National Cheng Kung University Hospital (Tainan City, Taiwan). Phonoangiographic signals were recorded using an electronic stethoscope (3M™ Littmann 4100 Series, Minnesota, USA) with a 4 KHz sampling rate at measurement sites. A band pass filter with cut off at frequencies from 40 Hz and 800 Hz to prevent the base line from wandering and maintain the characteristic frequencies at the signal preprocessing stage [11] [12] . Frequency spectral evaluation was then used to find the characteristic frequencies using the Burg AR method with a given AR order of P = 8 [30] . The frequency region, <800 Hz, was chosen in this study. The self-synchroniza-
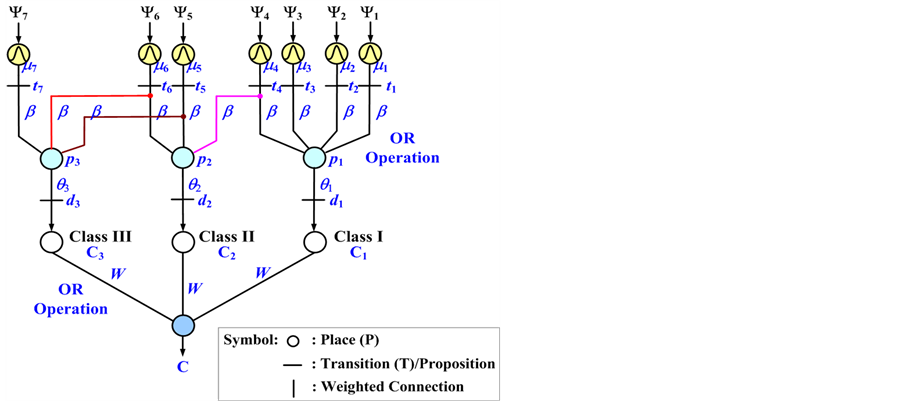
Figure 4. Fuzzy Petri net (FPN) based screening system.
tion error formulations were used to calculate dynamic errors. Depending on the dynamic errors, indexes Y, the status of AVS can be identified.
4.2. Preliminary Diagnosis and Classification
In clinical cases, following multiple PTA treatment, the vessel can develop severely fibrous soft tissue and sclerosis, leading to graft thrombosis, or loss of the available graft puncture area [32] . For example, polytetrafluoroethylene graft failure results in thrombosis, either at the graft-vein anastomosis or in proximal vein. In clinical research, the degree of narrowing of the normal vessel is an index, the so-called degree of stenosis (DOS). This index was confirmed the specific degree from images examinations, which are defined as in [33]
 (19)
(19)
 (20)
(20)
where D is the diameter of the normal graft or vessel in the direction of the blood flow, d is the diameter of the stenosis lesion, DOSpre% is the DOS% before PTA, and DOSpost% is the DOS% after PTA. The examination results have been classified into three classes by clinical physicians, as shown in Table 1. When the DOS% is greater than 50%, PTA or surgical revision is required to dilate the stenotic lesion or to remove the thrombus. The parameter DDOS% is the reduction degree of residual AVS stenosis from before and after PTA. This gives us the following two hypotheses:
Ÿ AVS has still residual stenosis, such as elastic recoil or graft thrombosis, etc., after PTA as small values, DDOS% and index Y.
Ÿ AVS has stenosis upon monthly examination when the DOS% and index Y are increasing.
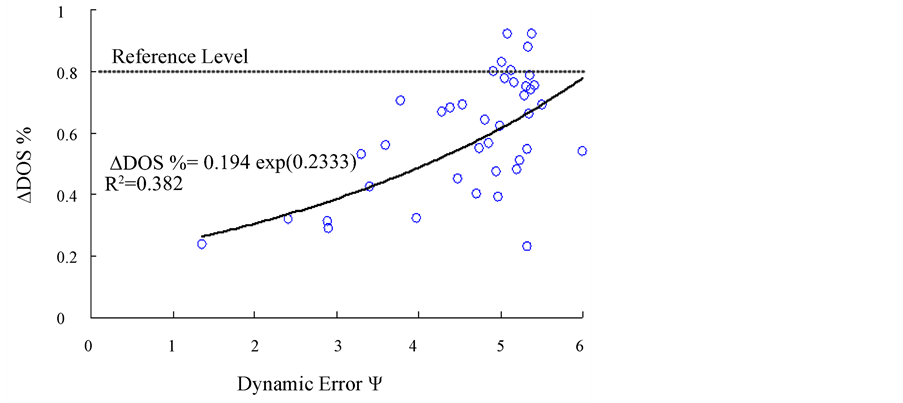
For the surgical results among 42 patients (IRB, under contract number: ER-99-186), the overall DOS% of patients is greater than 80% before PTA, [28] which is regarded as the reference level, and in three groups (>50%, 30% - 50%, <30%) after PTA. In statistics, there is no statistical significance between the groups in arterial anastomosis sites (A-sites) and venous anastomosis sites (V-sites), p > 0.05. Therefore, the correlation between DDOS% and index Y at the V-sites is closer than for the A-sites, as shown in Table 1 [30] . We can use exponent regression to model the relationship between DDOS% and index Y, as well as DOS% and index Y, respectively. The prediction model is fitted a non-linear curve that passes directly through all of the experimental data, as shown in Figure 5(a). It can be seen the correlation between DDOS and the Index, Y, at the V-site, as
 (21)
(21)
 (a)
(a)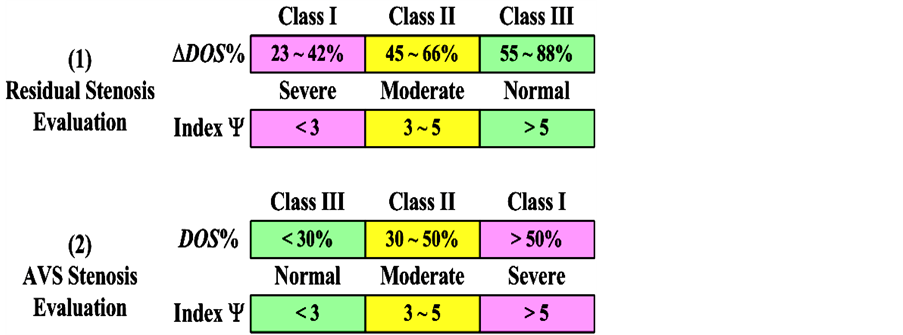 (b)
(b)
Figure 5. (a) The ∆DOS% versus index Y at V site, (b) Order of severity for the evaluation of AVS stenosis.

Table 1. The correlation results of DOS%, DDOS% and Index Y at A-site and V-site [30] .
The exponential regression was used to perform a least square curve fit, which minimizes the sum of the squares of the deviations of the experimental data from the prediction model. Thus, the examination criteria can be obtained for a prediction approach. As shown in Figure 5(b), the specific ranges, including Class I: Y < 3, Class II: 3 < Y < 5, and Class III: Y > 5, are used to evaluate the residual stenosis after PTA. We also compare the index Y before and after PTA at a monthly examination and suggest the specific ranges for evaluating AVS stenosis, order of severity, including Class III: Y < 3, Class II: 3 < Y < 5, and Class I: Y > 5.
4.3. Fuzzy Petri Nets Based Screening System
According to Table 1 and Figure 5, a Gaussian membership function can be parameterized by means (mean = 0.00 - 6.00) and a standard deviance (s1 = s2 = s3 = … = sr = 0.3802) using Equation (17). Figure 6 illustrates the Gaussian membership functions for three classes. In this way, we have 7 membership functions mr, r = 1, 2, 3, …, 7, with specific ranges Yr. The CF of each input in the different ranges is distributed in the range of [0, 1]. The FPN can perform Fuzzy inference to evaluate the degree of AVS stenosis of each proposition specified by the clinical physician, as shown in Table 2. Assume the degree of proposition Cm (Class I - Class III), m = 1, 2, 3, place pm is associated with the proposition dm = qm(pm), m = 1, 2, 3. Thus, the FPN based screening system can be determined, as shown in Figure 4. The FPN performs max operations (OR operator) to generate the goal proposition C, C = max{C1, C2, C3}. The FPN algorithm is summarized as follows:
Step 1) IF Yr THEN tr, CF = mr, where tr = mr(Yr), r = 1, 2, 3, …, 7 (Nr = 7).
Step 2) IF (m1 or m2 or … or mr) THEN pm, pm = max{(m1 ´ b), (m2 ´ b), …, (mr ´ b)}, m = 1, 2, 3, …, Nr (Nr = 7).
Step 3) Compute the proposition dm = qm(pm), m = 1, 2, 3 (Np = 3).
Step 4) IF (d1 or d2 or … or dm) THEN Cm, Cm = max{q1(p1) ´ W, q2(p2) ´ W, …, qm(pm) ´ W}, m = 1, 2, 3 (Nc = 3).
Step 5) Final output C = lm ´ max{C1, C2, C3}.
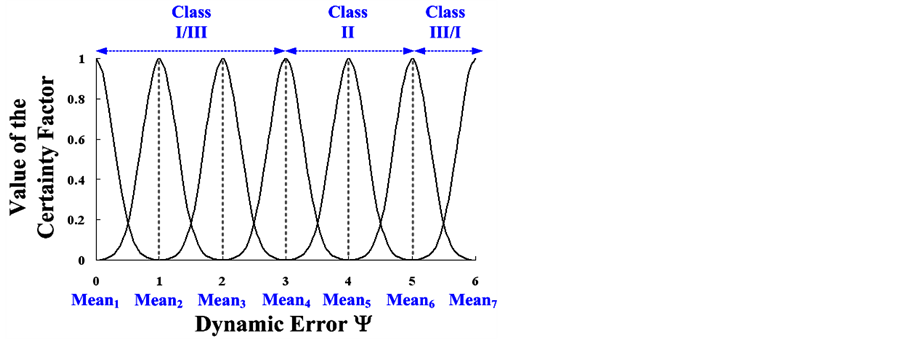
Figure 6.Gaussian membership functions for three classes
Table 2. Inference rules of Fuzzy Petri nets.
The index, lm, is a real number, and is defined as
Ÿ residual stenosis evaluation: l1 = 1 for Class I, l2 = 2 for Class II, and l3 = 3 for Class IIIŸ AVS stenosis evaluation: l1 = 3 for Class III, l2 = 2 for Class II, and l3 = 1 for Class I.
The goal proposition C indicates the possible degree of AVS senosis. Therefore, function qm(pm) is a nonlinear approximator, and is defined by
 (22)
(22)
where value pm, 0 £ pm £ 1, can determine the output of function qm (Nt = 3), and the larger value, the more likely it is the output goal proposition will occur. Its solution list is monotonically decreasing, and the degree can be divided into three classes.
5. Experimental Results and Discussion
The proposed screening system with the signal processing, Burg AR method, self-synchronization error formulations, and Fuzzy Petri nets was developed on a PC AMD Athlon II ´ 2 245 2.91 GHz with 1.75 GB RAM and Matlab software. To demonstrate the effectiveness of the proposed model for AVS stenosis evaluation, 42 subjects were tested. There were 23 females and 19 males with a mean age of 63 ± 10.2 years (49 to 81 years). The AVS types included 22 arteriovenous grafts (AVGs) and 20 arteriovenous fistulas (AVFs) to surgically connect the artery and vein. The participants’ mean duration of long-term hemodialysis therapy was 48 ± 31 months. Preliminary diagnosis results confirmed the specific degrees by ultrasonic image examination and observation by clinical physicians. Two case studies, residual stenosis after PTA and long-term/monthly examinations were used to validate the proposed screening system, as detailed below.
5.1. Residual Stenosis Evaluation after PTA
The records of the 42 subjects were divided into three groups. The overall testing results are shown in Figure 7, and the accuracy (90.47%) and sensitivity (92.30%) are greater than 90% with 4 failures. Each subject used at least 2 records for 8 seconds at the venous anastomosis site before PTA and after PTA. We classified the AVS stenosis according to three main degrees, as “Class I”, “Class II”, and “Class III”, corresponding to monotoni cally decreasing curves that define the level to quantify the similarity in each class. The output function of qm, m = 1, 2, 3, itself can be an arbitrary curve, and we can define it as a function that must vary between 0.3679 and 1.0000 for Class I, 0.7358 and 2.0000 for Class II, 1.1037 and 3.0000 for Class III, respectively. Nonlinear Gaussian classifiers are used to screen possible classes from the three groups. Then, the place pm can determine the similarity level more likely to be close to each nonlinear approximator. If place pm is similar to any proposition, its value spreads between 0 and 1. It can be seen the function of AVS can be evaluated by the proposed screening system.
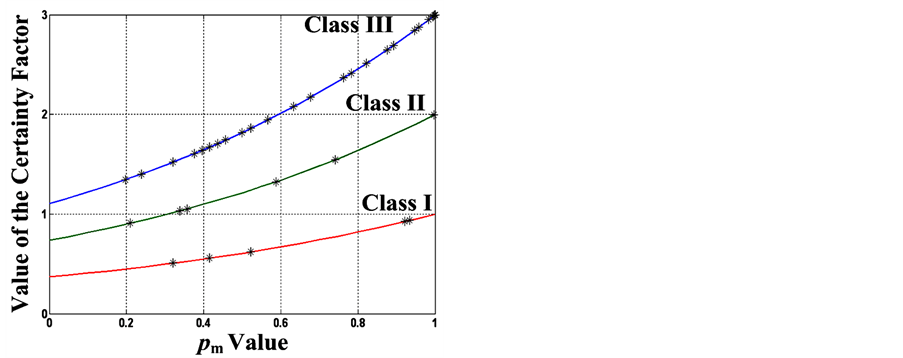
Figure 7. Feasibility screening results of residual stenosis evaluation after PTA (42 tests).
In order to demonstrate the effectiveness of the proposed method, 10 patients were also randomly selected to verify the residual stenosis evaluation, as shown in Table 3. A clinical physician verified that these subjects had a high degree of DOS% before PTA. PTA treatment or surgical revision is used to dilate the stenotic lesion and to enlarge the focal site with balloon expansion. Then, the proposed screening system has high confidences for early detection to decide the degree of residual stenosis, and has a non-invasive means of measurement and an automatic diagnostic algorithm for monitoring AVS conditions. According to this examination, we recommend increasing surveillance and confirmation analysis, especially in “Class II and III”. This confirms the FPN based screening system provides promising results for residual stenosis evaluation at the venous anastomosis site.
5.2. Long-Term Monthly Examinations
As an example, a female hemodialysis patient, aged 54, AVG type (Right Forearm Loop), agreed to participate in the long-term examination and allowed further data collection through monthly observation from June 25, 2011 to November 12, 2012. In a routine monitoring cycle, a monthly examination was used to evaluate the AVG function, as shown in Table 4. On September 6, 2011, the patient had severe AVG occlusion, DOS% = 92%, and received PTA treatment. After multiple PTA procedures, the vessel became severely fibrous and sclerotic. An immediate elastic recoil can occur after PTA treatment, which contributes to blood flow resistance from the outflow to the total occlusion condition. On November 12, 2011, using the ultrasonic image examination, were found this type of recoil at the venous anastomosis site. This type of case can fall into one of the two following scenarios:
Table 3. Results of residual stenosis evaluation at venous anastomosis site (V-site).
Table 4. Results of long-term monthly examination at venous anastomosis site (V-site).
Ÿ From inflow to outflow stenosis condition: with focal increase in velocity, the main characteristic frequency gradually shifts from low frequency components to high frequency components, such as the 1st characteristic frequency could increase from 96 Hz to 187 Hz in three-months of observation.
Ÿ From outflow to total occlusion condition: the 1st and 2nd characteristic frequencies return to their previous levels, but the frequencies of the 2nd and 3rd characteristic disappear.
Thus, the index Y gradually increases as the stenosis gradually becomes severe. For example, index Y = 5.04, the diagnostic procedures of the FPNs are:
Step 1) Compute the CFs of mr(fr), then transition T = [t1, t2, t3, …, t7] = [0.0000, 0.0000, 0.0000, 0.0000, 0.0007, 0.9892, 0.0019].
Step 2) Perform OR operations with 3 combinations of transitions, and then place P = [p1, p2, p3] = [max{(t1 ´ 1), (t2 ´ 1), (t3 ´ 1), (t4 ´ 1)}, max{(t4 ´ 0.4), (t5 ´ 0.8), (t6 ´ 0.4)}, max{(t5 ´ 0.4), (t6 ´ 1), (t7 ´ 1)}] = [0.0000, 0.3957, 0.9892].
Step 3) Compute the proposition D = [d1, d2, d3] = [0.3679, 0.5465, 0.9893].
Step 4) Perform OR operations with 3 combinations of three groups of places, and then the goal proposition max[(d1 ´ 1), (d2 ´ 1), (d3 ´ 1)] = max[C1, C2, C3] = 0.9893.
Step 5) Final output C = l3 ´ max[C1, C2, C3] = 0.9893 (l3 = 1).
Overall results of one routine monitoring cycle were shown in Table 4. These results confirm that the proposed screening system can also be used to evaluate the degree of AVS stenosis for monthly examinations.
5.3. Performance Tests and Discussion
Table 5 shows comparison performances using the proposed screening method, a support vector machine (SVM) [11] and a probabilistic neural network (PNN) [34] . After collecting recorded data, 40-sets of training data from input-output pairs were used to train a PNN and a SVM, as shown in Figure 8(a) and Figure 8(b). So the structures of multi-layer networks can be determined using input-output training data, and be built with a network topology 1 ´ 3 ´ 3 for SVM and a topology 1 ´ 40 ´ 4 ´ 3 for PNN. Updating of network parameters was performed after the network structure had been determined. For adaptive applications, traditional optimization me-
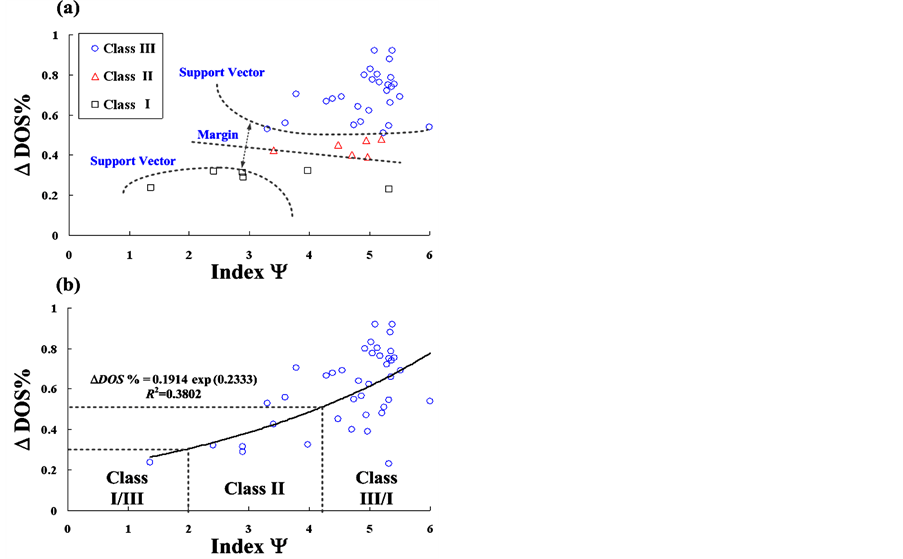
Figure 8. (a) Training data for support vector machine (SVM); (b) Training data for probabilistic neural network (PNN).
Table 5. Comparison of performances between the proposed method and other methods.
Note: Activation function: (1) PNN [34] :  (2) SVM [11] :
  where Y is the input testing data, and Y(k), k = 1, 2, 3, …, K (K = 40), is the training data.
thods, such as the gradient descent method and the least-square algorithm, were used to choose the optimal network parameters. As seen in Table 5, an adaptive mechanism design with updating the parameters, sk, and was adopted to minimize the mean squared error function (MSEF) between the actual output and desired output [34] [35] . However, traditional optimization methods have two bottlenecks: 1) MSEF is a non-linear function and its partial differential equation is difficult to obtain, and 2) It cannot guarantee convergence to a global optimal solution as the iteration computing and the number of training data increase.
The particle swarm optimization (PSO) algorithm is an evolutionary optimization technique, which provides more efficiency in solving multiple optima, high dimensionality, featuring non-linearity, and nondifferentiability problems [36] . For the same training data, the evolution computations of this technique were used to minimize the MSEF, as shown in Figure 9. It can be seen the solution list of the PNN classifier is monotonically decreasing, but the MSEF could not reach the convergent condition (MSEF < 10−2).
In addition, only slight improvement in the optimal parameters was obtained by increasing the number of iteration training and population sizes (G = 20 - 40).
A SVM can find an optimal hyper-plane for linearly or non-linearly separable patterns, as shown in Figure 8(a), and also can transfer input data into higher dimensional space. A specific function, kernel-based transformation, transfers the input space into higher dimensional space by non-linear transformation and tuning the parameters, tk, sk, and bias. For the same training data, the solution list of the SVM classifier can rapidly reach the convergent condition, as shown in Figure 9. However, its solution list involves vibration convergence and is trapped to the local optimal solution due to updating of three parameters at each iteration computation. With a non-linear SVM mechanism, it is not suitable to train a classifier under low-dimensional pattern space. Its accuracy is only 65% (with 14 failures), which less than PNN.
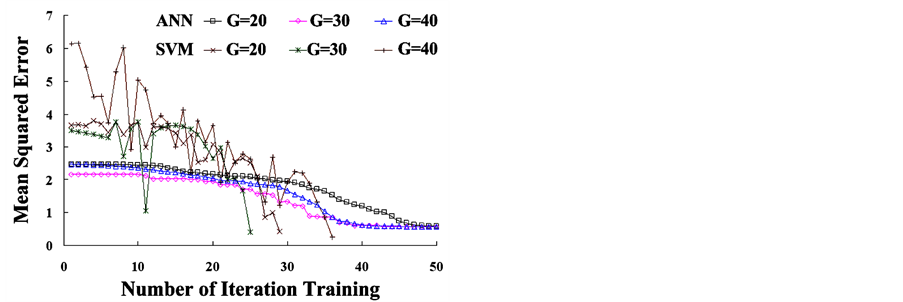
Figure 9. The mean square error versus the number of iteration training.
The multi-layer networks provide promising solutions to perform classification tasks, but the algorithms are difficult implement in hardware devices. The proposed screening system provides a rule-based mechanism and automatic weighted Fuzzy reasoning. A flexible and intelligent approach requires no iteration computation for updating network parameters. Thus, it can overcome the complexity of adjustable mechanism design, and the prototype device can be implemented with fundamental mathematic operations and logical operation functions as needed in a short design cycle, as seen in Appendix.
Some advantages of the proposed screening system are summarized as follows:
Ÿ Burg autoregressive (AR) method is used to identify the characteristic frequencies.
Ÿ Self-synchronization error formulation (SSEF) is used to track the differences of frequency spectra betweennormal and abnormal conditions.
Ÿ Fractional-order dynamic error can be used to scale the equal difference values within the specific ranges.
Ÿ Fuzzy Petri net (FPN) requires no assignation of a specific objective function and no iteration computing to update parameters.
6. Conclusion
In Taiwan, more than 66 thousand people need to receive the hemodialysis treatment and this number is increasing year by year. For long-term use, AVF or AVG accesses must be punctured every two days. Maintenance of proper AVS function is the most important issue for end stage renal disease patients. The proposed screening system has developed an early detection tool for evaluating AVS condition. With the noninvasive phonoangiographic signals, the Burg AR method was used to estimate the characteristic frequency spectra. Using fractional calculation with fractional orders, 0.90 < q < 0.98, the self-synchronization error formulations are used to compute the fractional-order dynamic errors, which are orthogonal components bound to the limit values in the first quadrant. Thus, the norm of the dynamic errors is used to specify the degrees of the stenosis. Then, we implemented human diagnosis work to present a Fuzzy Petri net based inference algorithm for a rule-based screening system, and the degree subdivides into three classes to screen the residual stenosis and occlusion levels. We used 42 case studies for “residual stenosis evaluation” and 10 case studies for “long-term monthly examination” to verify the feasibility of the proposed screening system. It can provide early detection in homecare applications and is easy to implement with a portable medical monitor.
Acknowledgements
This work was supported by the Medical Device Innovation Center (MDIC) at National Cheng Kung University, under contract number: D102-21001 (January 1, 2013-December 31, 2013). The Institutional Review Board (IRB) of the National Cheng-Kung University Hospital approved this study, under contract number: ER-99-186.
References
- Tsai, J.-C., Chen, S.-C., Hwang, S.-J., Chang, J.-M., Lin, M.-Y. and Chen, H.-C. (2010) Prevalence and Risk Factors for CKD in Spouses and Relatives of Hemodialysis Patients. American Journal of Kidney Diseases, 55, 856-866. http://dx.doi.org/10.1053/j.ajkd.2009.12.021
- Bethesda, M.D. (2011) National Institute of Diabetes and Digestive and Kidney Diseases. National Institutes of Health, 2, 298.
- Fillinger, M.F., Reinitz, E.R., Schwartz, R.A., Resetarits, D.E., Paskanik, A.M., Bruch, D. and Bredenberg, C.E. (1989) Beneficial Effects of Banding on Venous Intimal-Medial Hyperplasia in Arteriovenous Loop Grafts. American Journal of Surgery, 11, 87-94. http://dx.doi.org/10.1016/0002-9610(89)90353-X
- Allon, M. and Robbin, M.L. (2009) Hemodialysis Vascular Access Monitoring: Current Concepts. Hemodialysis International, 13, 153. http://dx.doi.org/10.1111/j.1542-4758.2009.00359.x
- Loth, F., Fischer, P.F. and Bassiouny, H.S. (2008) Blood Flow in End-to-Side Anastomoses. Annual Review of Fluid Mechanics, 40, 367-393. http://dx.doi.org/10.1146/annurev.fluid.40.111406.102119
- Beathard, G. (2004) A Practitioner’s Guide to Physical Examination of Dialysis Vascular Access. Fistula First Project.
- Cheng, S.-M., Ng, S.-P., Yang, F.-S. and Shih, S.-L. (2003) Interventional Treatment for Complete Occlusion of Arteriovenous Shunt: Our Experience in 39 Cases. Chinese Journal of Radiology, 28, 137-142.
- Mansy, H.A., Hoxie, S.J., Patel, N.H. and Sandler, R.H. (2005) Computerised Analysis of Auscultatory Sounds Associated with Vascular Patency of Haemodialysis Access. Medical and Biological Engineering and Computing, 43, 56- 62. http://dx.doi.org/10.1007/BF02345123
- National Kidney Foundation (2006) Clinical Practice Guidelines and Clinical Practice Recommendations. Clinical Practice Guidelines for Vascular Access.
- A., Asif, Gadalean, F.N., Merrill, D., Cherla, G., Cipleu, C.D., Epstein, D.L. and Roth, D. (2005) Inflow Stenosis in Arteriovenous Fistulas and Grafts: A Multicenter, Prospective Study. Kidney International, 67, 1986-1992.
- Vasquez, O.P., Munguia, M.M. and Mandersson, B. (2009) Arteriovenous Fistula Stenosis Detection Using Wavelets and Support Vector Machines. 31st Annual International Conference of the IEEE EMBS, Mineapolis, 2-6 September, 1298-1301.
- Gram, M., Olesen, J.T., Riis, H.C., Selvaratnam, M., Meyer-Hofmann, H., Pedersen, B.B., Christensen, J.H., Struijk, J. and Schmidt, S.E. (2011) Stenosis Detection Algorithm for Screening of Arteriovenous Fistulae. IFMBE Proceedings of 15th Nordic Baltic Conference on Biomedical Engineering and Medical Physics, 34, 241-244.
- Akay, Y.M., Akay, M., Welkowitz, W., Lewkowicz, S. and Semmlow, J.L. (1993) Noninvasive Acoustical Detection of Coronary Artery Disease: A Comparative Study of Signal Processing Methods. IEEE Transactions on Biomedical Engineering, 40, 571-578. http://dx.doi.org/10.1109/10.237677
- Kannathal, N., Rajendra, A.U., Paul, J. and Ng, E.Y.K. (2006) Analysis of EEG Signals with and without Reflexology Using FFT and Auto Regressive Modeling Techniques. Chinese Journal of Medicine, 1, 12-20.
- Roth, K., Kauppinen, I., Esquef, P.A.A. and Valimaki, V. (2003) Frequency Warped Burg’s Method for AR-Modeling. IEEE Workshop on Applications of Signal Processing to Audio and Acoustics, October 19-22, 5-8.
- Collomb, C. (2009) Linear Prediction and Levinson-Durbin Algorithm. http://ccollomb.free.fr/technotes/
- Hwang, C., Leu, J.F. and Tsay, S.Y. (2002) A Note on Time-Domain Simulation of Feedback Fractional-Order Systems. IEEE Transactions on Automatic Control, 47, 625-631. http://dx.doi.org/10.1109/9.995039
- Ge, Z.M. and Hsu, M.Y. (2007) Chaos in a Generalized Van Der Pol System and in Its Fractional Order System. Chaos, Solitons & Fractals, 33, 1711-1745. http://dx.doi.org/10.1016/j.chaos.2006.03.028
- Podlubny, I. (1999) Fractional Differential Equations, Mathematics in Science and Engineering. Academic Press, New York.
- Ahson, S.I. (1995) Petri Net Models of Fuzzy Neural Networks. IEEE Transactions on Systems, Man, and Cybernetics, 25, 926-932. http://dx.doi.org/10.1109/21.384255
- Chen, S.M. (2000) Fuzzy Backward Reasoning Using Fuzzy Petri Nets. IEEE Transactions on Systems, Man, and Cybernetics-Part B: Cybernetics, 30, 846-856. http://dx.doi.org/10.1109/3477.891146
- Chen, S.M. (2002) Weighted Fuzzy Reasoning Using Weighted Fuzzy Petri Nets. IEEE Transactions on Knowledge and Data Engineering, 14, 386-397. http://dx.doi.org/10.1109/69.991723
- Cao, Y.Z. and Chen, G.Q. (2010) A Fuzzy Petri-Nets Model for Computing with Words. IEEE Transactions on Fuzzy Systems, 18, 486-499. http://dx.doi.org/10.1109/TFUZZ.2009.2035816
- Chen, H.K. (2005) Synchronization of Two Different Chaotic Systems: A New System and Each of the Lorenz Dynamical Systems. Chaos, Solitons & Fractals, 23, 1245-1251.
- Chen, J.H. (2008) Controlling Chaos and Chaotification in the Chen-Lee System by Multiple Time Delays. Chaos, Solitons & Fractals, 36, 843-852. http://dx.doi.org/10.1016/j.chaos.2006.10.049
- Ma, C.B. and Hori, Y. (2007) Fractional-Order Control: Theory and Applications in Motion Control. IEEE Industrial Electronics Magazine, 1, 6-16.
- McKay, C.B. and Meiselman, H.J. (1988) Osmolality-Mediated Fahraeus and Fahraeus-Lindqvist Effects for Human RBC Suspensions. American Journal of Physiology-Heart and Circulatory Physiology, 254, H238-H249.
- Schmidt, S.E., Graebe, M., Toft, E. and Sruijk, J.J. (2011) No Evidence of Nolinear or Chaotic Behavior of Cardiovascular Murmurs. Biomedical Signal Processing and Control, 6, 157-163. http://dx.doi.org/10.1016/j.bspc.2010.07.003
- Lin, C.H., Chen, J.L., Du, Y.C., Pan, S.M. and Wu, J.X. (2011) Diabetic Foot Peripheral Vascular Occlusive Disease Estimation Using Fractional-Order Chaos Synchronization Detector. International Conference on Fluid Power and Mechatronics, Beijing, 17-20 August 2011, 597-601.
- Chen, W.L., Chen, T.S., Lin, C.H., Chen, P.J. and Kan, C.D. (2013) Phonoangiography with a Fractional Order Chaotic System—A New and Easy Algorithm in Analyzing Residual Arteriovenous Access Stenosis. Medical & Biological Engineering & Computing, 51, 1011-1019.
- Looney, C.G. and Alfize, A.R. (1987) Logical Controls via Boolean Rule Matrix Transformations. IEEE Transactions on Systems, Man and Cybernetics, 17, 1077-1082. http://dx.doi.org/10.1109/TSMC.1987.6499319
- Prabir, R.C., Vikas, P.S. and Alfred, K.C. (2006) Hemodialysis Vascular Access Dysfunction: A Cellular and Molecular Viewpoint. Journal of the American Society of Nephrology, 17, 1112-1127. http://dx.doi.org/10.1681/ASN.2005050615
- Van Der Linden, J., Smits, J.H.M., Assink, J.H., Wolterbeek, D.W., Zijlstra, J.J., De Jong, G.H., Van Den Dorpel, M.A. and Blankestijn, P.J. (2002) Shortand Long-Term Functional Effects of Percutaneous Transluminal Angioplasty in Hemodialysis Vascular Access. Journal of the American Society of Nephrology, 13, 715-720.
- Wu, J.X., Lin, C.H., Du, Y.C. and Chen, T.S. (2012) Sprott Chaos Synchronization Classifier for Diabetic Foot Peripheral Vascular Occlusive Disease Estimation. IET Science, Measurement & Technology, Manuscript Acceptance, 6, 533-540. http://dx.doi.org/10.1049/iet-smt.2011.0002
- De Jesus Rubio, J. (2009) SOFMLS: Online Self-Organizing Fuzzy Modified Last-Squares Network. IEEE Transactions on Fuzzy Systems, 17, 1296-1309. http://dx.doi.org/10.1109/TFUZZ.2009.2029569
- Ratnaweera, A., Halgamuge, S.K. and Watson, H.C. (2004) Self-Organizing Hierarchical Particle Swarm Optimizer with Time-Varying Acceleration Coefficients. IEEE Transactions on Evolutionary, Computation, 8, 240-255. http://dx.doi.org/10.1109/TEVC.2004.826071
Appendix
The authors designed a prototype of arteriovenous shunt (AVS) stenosis screening system using the LabWIEW graphical programming (National Instruments™ Corporation, Austin, Texas, USA), as shown in Figure A1. It includes phonoangiographic (PCG) signals recording, signal processing, feature extraction, and Fuzzy Petri net. The proposed screening system has developed an assistant tool for residual stenosis evaluation and AVS stenosis evaluation. It also allows applications for the detection of arterial occlusive diseases and coronary artery diseases.
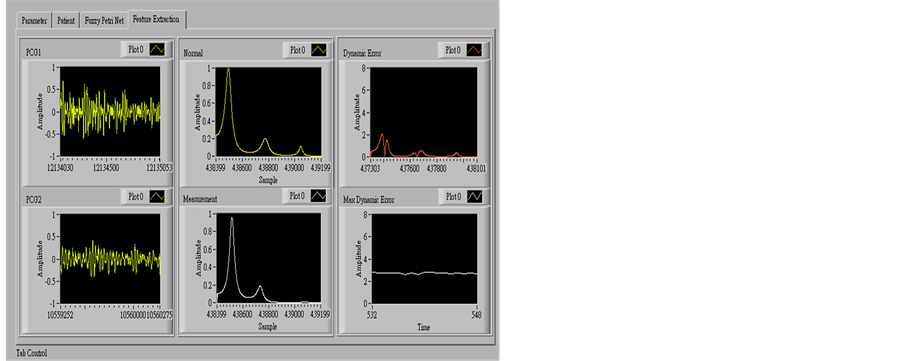
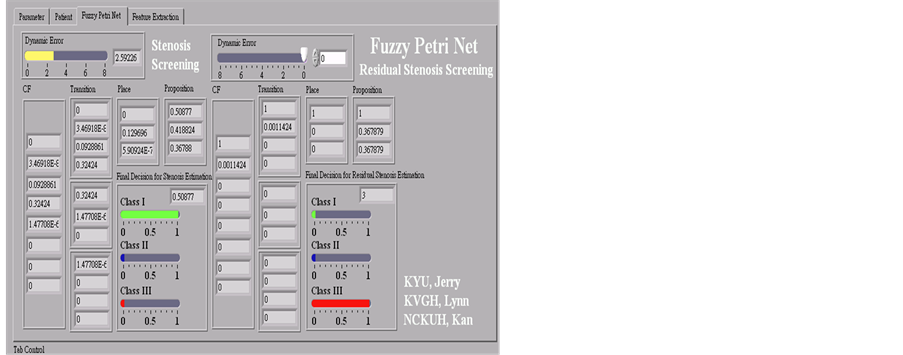
Figure A1. Main human-computer interface.
NOTES

*Corresponding author.