Advances in Remote Sensing
Vol.04 No.04(2015), Article ID:61659,7 pages
10.4236/ars.2015.44023
Forest Fires and Climate Correlation in Mexico State: A Report Based on MODIS
Xanat Antonio1, Edward Alan Ellis2
1Autonomous University of Mexico State, Geography Faculty, Toluca, Mexico
2Tropical Research Center (CITRO), Universidad Veracruzana, Veracruz, Mexico

Copyright © 2015 by authors and Scientific Research Publishing Inc.
This work is licensed under the Creative Commons Attribution International License (CC BY).


Received 9 October 2015; accepted 30 November 2015; published 3 December 2015

ABSTRACT
Forest fires are one of the most important threats for forests in the State of Mexico. Therefore, understanding their geographical patterns is a priority for the design of forest management strategies. We processed the records obtained with the MOD14A2 product (for thermal anomalies and fire) of MODIS sensor. Such scenes correspond to dry seasons (from March 15 to June 30) from 2000 to 2012 in the State of Mexico. We analyzed such records in a GIS environment to learn their spatial patterns and establish their geographical correlations as a first step to understand the causal agents of forest fires. As a result, forest fires in the State of Mexico showed a clustered spatial trend with a southwest tendency and a slight spatial relation with total winter precipitation and maximal temperature in summer.
Keywords:
Forest Fires, MODIS Product, State of Mexico, Spatial Patterns

1. Introduction
Forest fires are one of the most studied natural phenomena, due to its nature and impacts. Detecting and Mapping forest fires is a well stablished research area (e.g. [1] [2] ), as the construction of spatial models to predict forest fires risk is [3] -[7] . In Mexico, [8] describes the factors associated to forest fires and [9] proposes a forest fires model in GIS. [10] explored the spatial relation of forest fires in the State of Durango. In the State of Mexico, [11] studied forest fires temporality and effects. However, there are no studies applying remote sensing to automatically map and understand the spatial patterns of forest fires in this State. Understanding the spatial distribution and patterns of forest fires is necessary to plan interventions in order to prevent them. For such a reason, we use the MOD14A2 product as a first approach to understand the spatial patterns of forest fires in the State of Mexico during dry seasons from 2000 to 2012.
2. Method
It consists on the study area description, the construction of a geodatabase, and the search for spatial relationships.
2.1. Study Area
The State of Mexico is located between latitudes 18˚21'15" and 20˚19'00" north and longitudes 98˚35'30" and 100˚37'00" west, between the Trans-Mexican Volcanic Belt and Sierra Madre del Sur [12] . According to [13] , the dominant vegetation types are (ordered by extension): Pine forest (250 thousand hectares), Oak forest (199 thousand hectares), deciduous and semi-deciduous rain forest (186 thousand hectares) and sacred fir forest (83 thousand hectares). The 513,500 hectares comprised in this State forest are mainly located in the southwest and on mountainous terrains (Figure 1).
The presence of forest fires is complex to explain. However, in this region there are several factors that facilitate them: as well the high elevation that increases sun exposition, the presence of dry winters and summer

Figure 1. Vegetation types distribution in Mexico State.
droughts followed by heavy rain periods promote vegetation growth, illegal logging, grass burning, urban and agricultural encroachment, and intentional fires threaten the forests in this State, which holds the first national place in forest fire incidence for the period 1995-2010, except in 2002 and 2004 when it held the second place [14] .
2.2. Geographical Database Construction
We downloaded the MODIS-Terra product named MOD14A2 from LPDACC website of USGS EROS center (https://lpdaac.usgs.gov/get_data). This product bases on “detection by localizing the occurrence of fast changes in daily reflectivity data, in short, of the NIR region (band 2) and SWIR (band 5) [15] . This detection takes into account the reflectivity estimated for each pixel, inverting a bidirectional reflectivity model (BDRF), from a several-day fixed temporary window. The algorithm differences between seasonal changes of some coverages similar to those burned (such as shades) and more time-persisting changes as a consequence of those caused by fire. At a second stage, from contextual criteria that begin in the detected change pixels, the algorithm allows completing the perimeters of burned areas that were not mapped in the previous phase” [16] . We selected the scenes h8v6 and h8v7 of 8 days for the hottest and driest period of the year (between March 15 and June 31); once obtained, we projected them with Modis Projection Tool, mosaicked them and extracted the polygons with the burned areas using GIS query. We built climate layers using records from the National Meteorological Service, specifically the records of maximum value for the maximal temperature in May and the total sum of winter precipitation, which were added to the punctual location of the stations and interpolated using the IDW method.
2.3. Spatial Patterns and Relationships
We explored several descriptors of the spatial pattern on the burned forest areas using ArcGIS: central mean value, dispersion ellipse, and Moran I index. The first points at the average coordinates of the group, whilst the second graphically expresses how the data disperses over the territory. The third is a measure that allows establishing if the data are clumped, random or regular in their distribution. Once we learnt that the burned areas have a grouped pattern, we exported the data to IDRISI in order to establish their spatial relation to the maximal temperature in May and the total precipitation in winter. To validate these results, we contrasted them with the climate and forest fires records reported by CNA and CONAFOR from 1970 to 2006 for the State of Mexico.
3. Results
In Figure 2, we show the forest burned areas of Mexico State for the 2000-2011 period.
During the driest and hottest periods of the year forest fires in the State of Mexico tend to concentrate and extend over the southwest region, showing considerable variability between years. On average, there are 93 forest fires each year, and 51% of the burned areas have an extension of 10.9 ha or are smaller. In this State, forest fires are very frequent but mostly small. The majority of the affected areas are persistent over the years and are located in the municipalities of Valle de Bravo, Ixtapan del Oro, Tlatlaya, Amatepec, Nuevo Santo Tomás, Zacazonapan, San Martín Otzoloapan, Tejupilco de Hidalgo, Sultepec, Temascaltepec and San Simón de Guerrero (Figure 3).
Moran’s I index reveals that burned forest areas tend to be clustered (Table 1) during the period 2000-2012; only in two years, 2006 and 2009, they had a random pattern.
In Table 2, we concentrate the indicators of the spatial relation between burned areas and total precipitation in winter (Wrain) and Maximum temperature in May (Max Tmay).
Maximum temperature in May strongly correlates with burned areas in 2012, but slightly in 2000 and 2008. Total precipitation in winter slightly correlates with burned areas in 2003 and 2012. This agrees with long-term records for the State of Mexico (1970-2007) in which forest fires are more frequent in winters with few precipitation followed by high values of maximal temperature in May (Figure 4). However, for the period and dataset studied the combination of these variables is not sufficient to predict the extent of the burned surfaces. This is explained by the complexity of forest fires.
4. Conclusion
Even with the spatial limitations of MODIS products, this first approach allows concluding that forest fires in

Figure 2. Burned forest areas in Mexico state 2000-2012, as detected by the MOD14A2 product.
Figure 2. Burned forest areas in Mexico state 2000-2012, as detected by the MOD14A2 product.
Table 1. Spatial pattern of forest burned areas in Mexico State, accordingo to Moran’s I index.
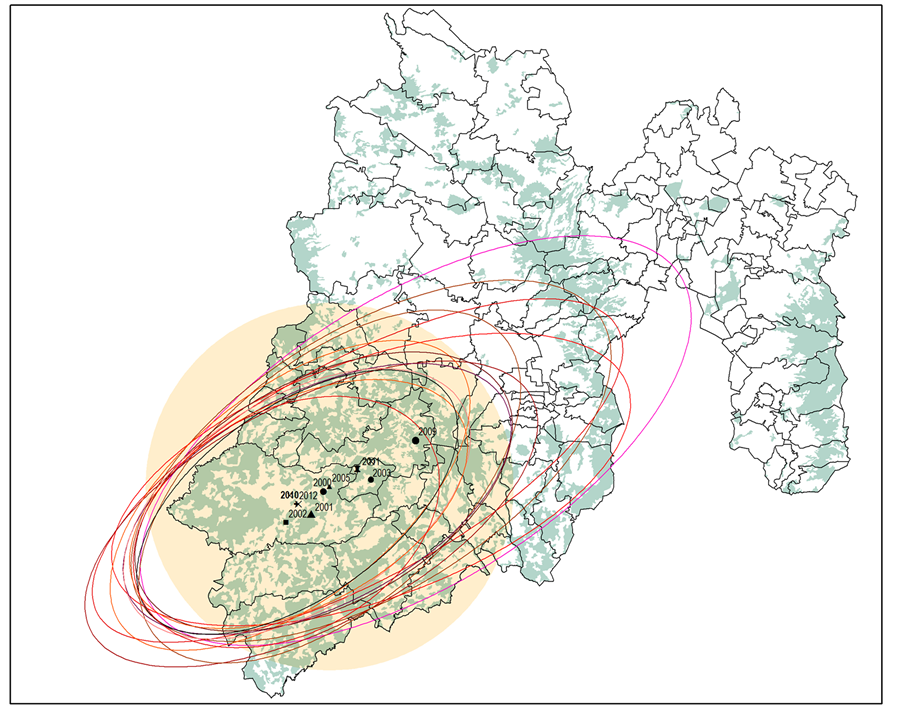
Figure 3. Mean central point and ellipse of dispersion for the burned forest areas in Mexico State 2000-20012.
Table 2. Burned areas correlation with Total precipitation of winter (Wrain) and Maximum temperature of May (MaxTmay).
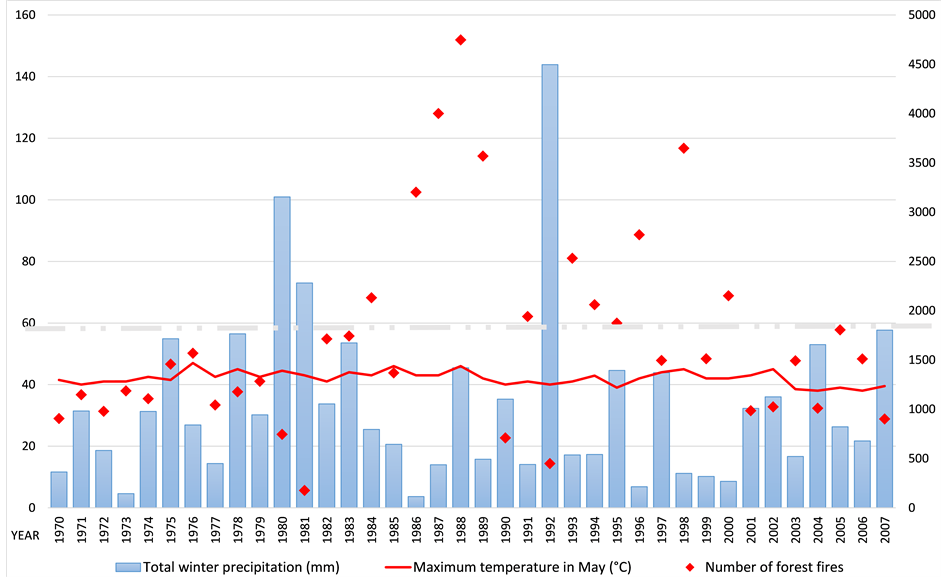
Figure 4. Total precipitation of winter, maximum temperature of may and fores fires frequency in Mexico State.
the State of Mexico are small, clustered, persistent and related to total precipitation in winter and maximum temperature in May. Although further studies with greater temporal and spatial precision are required, this study suggests the implementation of a spatial index that incorporates these climatic factors in order to select the areas with the most proneness to forest fires.
Acknowledgements
The “Autonomous University of the State of Mexico (UAEMEX) fund for research” supplied the resources for this research (24796/2007). This report takes part of the postdoctoral research carried by Dra. Antonio at CITRO.
The LPDACC website administrated by EROS Data center of the USGS (www.usgs.gov) was the source of the MYD14 product of MODIS tool and the MODIS projection tool, indispensable materials for this research.
Cite this paper
XanatAntonio,Edward AlanEllis, (2015) Forest Fires and Climate Correlation in Mexico State: A Report Based on MODIS. Advances in Remote Sensing,04,280-286. doi: 10.4236/ars.2015.44023
References
- 1. Chuvieco, E. (1999) Remote Sensing of Large Wildfires in the Mediterranean European Basin. Springer, Berlin.
http://dx.doi.org/10.1007/978-3-642-60164-4 - 2. Ganteaume, A., Camia, A., Jappiot, M., San-Miguel-Ayanz, J., Long-Fournel, M. and Lampin, C. (2013) A Review of the Main Driving Factors of Forest Fire Ignition over Europe. Environment Management, 51, 651-662.
http://dx.doi.org/10.1007/s00267-012-9961-z - 3. Barrett, K., Kasischke, E.S., McGuire, A.D., Turetsky, M.R. and Kane, E.S. (2010) Modeling Fire Severity in Black Spruce Stands in the Alaskan Boreal Forest Using Spectral and Non-Spectral Geospatial Data. Remote Sensing of Environment, 114, 1494-1503.
http://dx.doi.org/10.1016/j.rse.2010.02.001 - 4. Durão, R.M., Pereira, M.J., Branquinho, C. and Soares, A. (2010) Assessing Spatial Uncertainty of the Portuguese Fire Risk through Direct Sequential Simulation. Ecological Modelling, 221, 27-33.
http://dx.doi.org/10.1016/j.ecolmodel.2009.09.004 - 5. Romero-Calcerrada, R., Barrio-Parra, F., Millington, J.D.A. and Novillo, C.J. (2010) Spatial Modelling of Socioeconomic Data to Understand Patterns of Human-Caused Wildfire Ignition Risk in the SW of Madrid (Central Spain). Ecological Modelling, 221, 34-45.
http://dx.doi.org/10.1016/j.ecolmodel.2009.08.008 - 6. Massada, A.B., Radeloff, V.C., Stewart, S.I. and Hawbaker, T.J. (2009) Wildfire Risk in the Wildland-Urban Interface: A Simulation Study in Northwestern Wisconsin. Forest Ecology and Management, 258, 1990-1999.
http://dx.doi.org/10.1016/j.foreco.2009.07.051 - 7. Carmel, Y., Paz, S., Jahashan, F. and Shoshany, M. (2009) Assessing Fire Risk Using Monte Carlo Simulations of Fire Spread. Forest Ecology and Management, 257, 370-377.
http://dx.doi.org/10.1016/j.foreco.2008.09.039 - 8. Villers, M.A. (2006) Incendios Forestales. Ciencias, 81, 60-66.
http://www.redalyc.org/pdf/644/64408110.pdf - 9. Muñoz-Robles, C.A., Treviño-Garza, E.J., Verástegui-Chávez, J., Jiménez-Pérez, J. and Aguirre-Calderón, O.A. (2005) Desarrollo de un modelo espacial para la evaluación del peligro de incendios forestales en la Sierra Madre Oriental de México. Investigaciones Geográficas, 56, 101-117.
http://www.redalyc.org/articulo.oa?id=56905608 - 10. Avila-Flores, D., Pompa-Garcia, M., Antonio-Nemiga, X., Rodriguez-Trejo, D.A., Vargas-Perez, E. and Santillan-Perez, J. (2010) Driving Factors for Forest Fire Occurrence in Durango State of Mexico: A Geospatial Perspective. Chinese Geographical Science, 20, 491-497.
http://dx.doi.org/10.1007/s11769-010-0437-x - 11. Rivas, I., Fragoso, N.J., García, J., Rivas, E., Díaz, E.P. and Sanchez J.C. (2000) Incendios Forestales en el Estado de México en el periodo de Diciembre de 1997 a junio de 1998. Ciencia Ergo Sum, 6, 301-309.
http://www.redalyc.org:9081/home.oa?cid=275957 - 12. IGECEM (2013) Información geográfica del estado de México. Instituto de Información e investigación geográfica, estadística y catastral del Estado de México (IGECEM). Gobierno del Estado de México.
http://igecem.edomex.gob.mx/indole_social - 13. Nava, G., Endara A., Regil, H.H., Estrada, C., Arriaga, C. and Mass, S. (2009) Atlas Forestal del Estado de México. 1era. Edición. Universidad Autónoma del Estado de México-ICAR. Toluca, Estado de México.
- 14. INEGI (2015) Estadísticas Históricas de México. Instituto Nacional de Estadística Geografía e Informática (INEGI). Aguascalientes, México.
http://www.inegi.org.mx/prod_serv/contenidos/espanol/bvinegi/productos/nueva_estruc/HyM2014/22.%20MedioAmbiente.pdf
- 15. Roy, D., Lewis, P.E. and Justice, C.O. (2002) Burned Area Mapping Using Multi-Temporal Moderate Spatial Resolution Data-a Bi-Directional Reflectance Model-Based Expectation Approach. Remote Sensing of Environment, 83, 263-286.
http://dx.doi.org/10.1016/S0034-4257(02)00077-9 - 16. Bastarrika, A., Chuvieco, E. and Martín, M.P. (2008) Comparación de productos de área quemada obtenidos mediante imágenes de satélite en la Península ibérica. UNED. Espacio, Tiempo y Forma, 1, 33-47.
http://revistas.uned.es/index.php/ETFVI/article/view/1458