Open Journal of Applied Sciences
Vol.4 No.3(2014), Article ID:43619,27 pages DOI:10.4236/ojapps.2014.43012
Vibrational Studies of Different Human Body Disorders Using FTIR Spectroscopy
S. Kumar1*, Reena2, S. Chaudhary1, Sweety1, Deep Chand Jain3
1Department of Physics, Medical Physics Research Laboratory, D.A.V. (P.G.) College, Muzaffar Nagar, India
2Department of Mathematics, Shri K. K. Jain College, Khatauli, India
3Department of Neurology, Safdarjang Hospital, New Delhi, India
Email: *sanjeev1962@yahoo.co.in, *sanjeev1962kumar@rediffmail.com, reena_math@rediffmail.com, drdcjain@gmail.com
Copyright © 2014 by authors and Scientific Research Publishing Inc.
This work is licensed under the Creative Commons Attribution International License (CC BY).
http://creativecommons.org/licenses/by/4.0/


Received 8 January 2014; revised 15 February 2014; accepted 22 February 2014
ABSTRACT
Some of the important features of the bands occur in the present study. The band called amide A is available in all the diseased and healthy controls and the frequency of the band ranges from 3380 cm−1 to 3480.74 cm−1. The band due to C-H band and called hydrocarbon band was found only in paralytic and Alzheimer diseased along with normal healthy controls. Carbide band (C=C) is found only in Duchenne muscular dystrophy, paralytic and Alzheimer’s disease patients. Amide I was intact in all disorders with normal persons. Peroxide band (O-O) was found in all the cases of study. Amide IV band was found in paralytic, muscular dystrophy, Alzheimer’s diseases and normal controls. The amide V band was found in Alzheimer’s diseases only. The appearance or disappearance of the bands is a good sign to understand the mechanisms at the molecular level. FTIR spectroscopy may help in the diagnosis of the disease at the early stage of the onset. This spectroscopy can be used nicely for the study of hair, vaginal fluid, nails, urine, mucus, semen, synovial fluid, blood, hemoproteins, skin, and tears for human beings. We can also use it to understand the effect of adulteration on food and paint technology. FTIR is an indicator to explore the changes occurring at molecular level.
Keywords:Fourier Transform Infrared (FTIR); ImmunoglobuinG (IgG); Epilepsy (E); Migraine (M); Paralysis (P); Alzheimer’s Diseases (AD); Duchenne Muscular Dystrophy (DMD)

1. Introduction
Our main attention is concentrated on Fourier Transform Infrared (FTIR) Spectroscopy. This spectroscopy is a tool used to detect common contaminants, molecular deformations and complexities in other biological fluids such as serum, plasma hemoglobin molecule, seminal fluid, vaginal fluid, synovial fluid, tears, saliva and Cerebro Spinal Fluid (CSF) and some other components such as nails, skin, and hair.
FTIR is based on the fundamental principle of molecular spectroscopy. This broad ranging area of physics and chemistry covers multitude experimental techniques.
We would like to give some facts regarding the principle of this technique. Specific molecules absorb light energy at specific wavelengths. These are called resonance frequencies. Water molecule (H2O) resonates around 3450 cm−1 (wave number in unit) in the infrared region of the electromagnetic spectrum.
FTIR spectrophotometer works by taking a very small quantity of the sample and introducing it to the infrared cell. A cell may be a pellet or liquid container. An infrared light source is fitted with this cell and illuminated by the source. A spectrograph is obtained and the range of the spectrum started from 4000 cm−1 to 400 cm−1. The intensity of light transmitted through the sample is measured at each wave number allowing the amount of light absorbed by the sample to be studied. We can determine the exact spectrum of the desired sample by difference of the spectrum before and after the illumination of the infrared source of light. This is known as the infrared spectrum of the sample.
The resonance frequencies of a molecule are due to the presence of molecular functional groups specific to the molecule. A functional group is simply a group of two or more atoms bonded together in a specific way. In the water molecule (H2O) the functional group is O-H. This group contributes to the resonance frequency around 3450 cm−1. It is quite possible to determine the presence of different molecules in the sample. It can be done by measuring the absorption at different wavelengths.
Whenever a resonance with one of the constituent molecules present in the sample is met, the amount of light absorbed increases or conversely the amount of light transmitted through the sample decreases. This is known as attenuation cell FTIR spectrophotometer.
FTIR is very useful for identifying chemicals that are either organic, inorganic or biological. It is used to quantitative some components of an unknown mixture. It can be applied to the analysis of solids, liquids and gases. The term FTIR refers to a fairly recent development in the manner in which the data is collected and converted from an interference pattern of a spectrum. This spectroscopy is the powerful tool for identifying types of chemical bonds (functional groups). The wavelength of light absorbed is characteristic of the chemical bond [1] .
A molecule has a number of fundamental vibrational frequencies and that each may be associated with absorption of radiation of its own frequency. There are 3N − 6 fundamental frequencies for a general molecule containing N atoms and for special molecules with degenerate frequencies, free internal rotations, etc. The frequency ranges from 100 cm−1 to 4000 cm−1. The absorption bands generally lie in the infrared region. Absorption may occur at nonfundamental frequencies if two or more fundamental modes of vibration are excited simultaneously. The corresponding absorption is generally weak.
The infrared absorption spectrum of a complex molecule may show a large number of absorption bands of different intensities and with an irregular frequency pattern. Since the whole spectrum is characteristic of the molecule and no two species of molecule have exactly the same absorption pattern. We can use the spectra to identify compounds [2] .
The molecular vibrations associated with infrared absorption are strictly vibrations of the entire molecule. It happens that the distortion is largely confined to one section of the molecule. If this section recurs in different molecules, the associated infrared absorption will reappear at essentially the same frequency and approximately the same intensity. This happens so, reliably that the presence or absence of absorption at a particularly frequency can be used to infer the presence or absence of the chemical grouping concerned. The absence of groups is more reliably determined. Absorption in a certain region may arise from some unusual combination of groupings which would be separately transparent.
Such frequencies associated with chemical groupings are called characteristic group frequencies.
2. Basic Theory of Infrared Vibrational Spectroscopy
Theoretical details of infrared spectroscopy are given here. A vibrating diatomic molecule can be approximated to a linear harmonic oscillator, whose frequency of vibration can be calculated on the classical lines using Newton’s equation of motion [3] . A rigid diatomic molecule is shown in Figure 1.
If we suppose the bond distorted from its equilibrium length re to a new length r. Restoring forces on each atom of a diatomic molecule can be calculated as.
 (1)
(1)
We know that  Hook’s law. Or
 (2)
(2)
Here k is known as force constant and it is a measure of the stiffness of the bond.
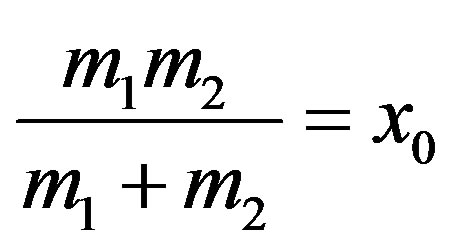
r1 and r2 are the positions of atom 1 and 2 relative to the Centre of Mass (C. M.) of the molecule.
We have consider a diatomic molecule with an internuclear distance r0. The molecule has a natural rotation about the axis through its centre of gravity C. The moment of inertia of the molecule is given here.
 (3)
(3)
Now we can write
 (4)
(4)
and
 (5)
(5)
using Equation (3) and Equation (4) we can calculate
 (6)
(6)
and
 (7)
(7)
Substituting the values of r1 and r2 in Equation (3)
 (8)
(8)
 (9)
(9)
 is reduced mass and defined as
 (10)
(10)

Figure 1. A rigid diatomic molecule treated as two masses m1 and m2 joined by a rigid base of length r0 = r1 + r2.
Substituting the value of r1 from Equation (6) in Equation (1), we get
 (11)
(11)
Since re is constant its differentiation with respect to t will be zero. We can write
 (12)
(12)
Substituting the value of  from Equation (12) in Equation (11) and we get
 (13)
(13)
If we put  and
and
using Equation (11).
Here x represent the displacement of the bond length from its equilibrium position.
Now we can write Equation (11) as
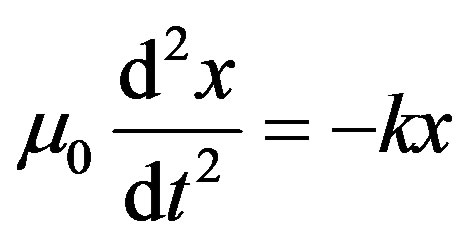
or
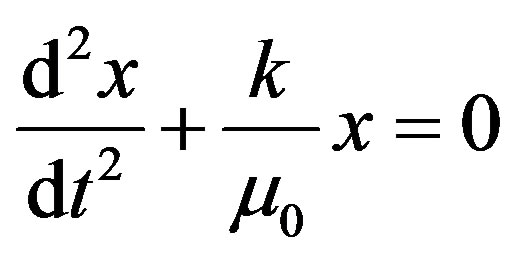
or
 (14)
(14)
Equation (14) is the Equation of Simple Harmonic Motion (S.H.M.) with frequency of vibration can be expressed in cm−1. It is called wave number.
Now
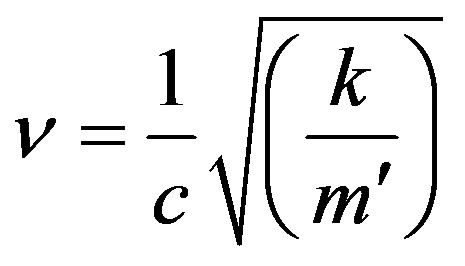

 (15)
(15)
Vibrational energies, like other molecular energies are quantised. These are permitted energies for any particular system. It can be calculated from Schrödinger eqn. The eigen values for the energy of a linear harmonic oscillator are given here.
 (16)
(16)
u is known as vibrational quantum number.
The force constant can be calculated as
 (17)
(17)
Stuart, B. [4] has studied biological applications of infrared spectroscopy and lot of calculations made regarding the specifications of a particular bond.
By measuring at specific frequency over time, changes in the character or quantity of a particular bond can be measured. Schmit, J. et al. [5] have applied this technique to microbiol and material analysis and given the information regarding the functional groups within the sample. It will absorb the infrared radiation and vibrate in one of a number of ways, either stretching, bending, deformation or combination vibrations.
The intensities of the bands in the spectrum are proportional to the concentration of their respective functional groups.
Lambert-Beer’s law shows
 (18)
(18)
where, I0 = Incident radiation; I = Transmitted radiationA is the absorption of the band; b is the path lengthε is the molar proportionality constant called molar absorptivity. It is the characteristic of each functional groupc is the concentration of the functional group.
FTIR spectroscopy requires more sample preparation and does not have the ability of confocal imaging. The physical effect of infrared may be created by the procedure of absorption and influences the dipole and ionic bands such as O-H, N-H and C=O. This spectroscopy is due to changes in dipole moment during molecular vibration.A block diagram of FTIR spectrophotometer is shown in Figure 2.
3. Review of the Literature
Naumann, D. [6] has studied some ultra structural information on intact, living bacterial cells and related cellwall fragments by using this technique.
One of the strategies employed by the emergent science of metabolism is metabolic fingerprinting. It involves

Figure 2. A block diagram of FTIR spectrophotometer.
rapid, high-throughput global analysis to discriminate between the different biological blood samples of complex body disorders. It has been reported that whether clinical, biophysical or biochemical in nature, the clinical tests have been inconsistent and contradictory. Many clinicians thought these tests are unrealistic. Research continues for the optimum diagnostic test for the complex body disorders. FTIR was developed in order to overcome the limitations encountered with dispersive instruments. The main problem was very slow scanning process.
Naumann, D. et al. [7] have studied the rapid differentiation and identification of pathogenic bacteria using this spectroscopy and multivariate statistical analysis. They have given their views to develop a method. The method for measuring all of the infrared frequencies simultaneously was needed. The solution of this problem was developed. It is a well established and developing analytical method, which allows for rapid, high throughput, non-destructive analysis of a wide range of sample types.
Ellis, D. I. et al. [8] have studied metabolic profiling with the help of this spectroscopy and reported that the vibration in the wave number region 2800 cm–1 to 3050 cm–1 can be ascribed to CH2 and CH3 stretching vibrations from fatty acids. The vibrations in the region 1500 cm–1 to 1750 cm–1 are ascribed to C=O, N-H and C-N from proteins and peptides.
Krimm, S. et al. [9] have studied in detail the vibrational spectroscopy and provide a base for the conformation of peptides, polypeptides and proteins. Authors have given the ranges of amide bands for the conformation of the different types of proteins. They have shown that amide II band is a mixture of N-H bending vibration (40% - 60%) and from the C-N stretching vibration (18% - 40%). This band is very sensitive. Amide III and IV bands are very complex in nature resulting from a mixture of so many coordinate displacements. It has been seen that out of plane motions are found in amid V, VI and VII bands.
Amide A band is due to N-H stretching vibration. This mode of vibration does not depend on the backbone conformation but is very sensitive to the strength of a hydrogen bond. It has wave numbers between 3225 cm–1 and 3280 cm–1 for hydrogen bond lengths between 2.69 to 2.85 Ǻ.
Amide I band the most intense absorption band in proteins. It is governed by the stretching vibrations of the C=O (70% - 85%) and C-N groups (10% - 20%). Its frequency is found in the range between 1600 cm–1 - 1700 cm–1. The exact band position is determined by the backbone conformation and the hydrogen bonding pattern.
Amide II band results from the N-H bending vibration (40% - 60%) and from the C-N stretching vibration (18% - 40%). This band is conformationally sensitive. Amide III and amide IV are very complex bands resulting from a mixture of several coordinate displacements. The out of plane motions are found in amide V, VI and VI bands.
Movasoghi, et al. [10] have reviewed the literature and supplied the relevant informations regarding the peak position intensities and frequencies of the bands and provide a data base, which is useful in the field of research and industries globally.
Kong, J. et al. [11] have studied secondary structures of protein and given a detailed knowledge of spectroscopy of proteins. They have given their views as the quantitative estimation of protein secondary structures is based on the assumption that any protein can be considered as a linear sum of fundamental secondary structural elements. The percentage of every element is related to the spectral intensity. The molar absorptivity of C=O stretching vibration for each secondary structural element is same.
FTIR studies of proteins and peptides have been used in identifying characteristic frequencies and determination of relation to structures of protein molecule.
Venyaminov, S. Y. et al. [12] and Chiragadze, Y. N. et al. [13] have studied some amino acid residues such as arginine, asparagine, glutamine, aspartic and glutamic acids, lysine, tyrosine, histidine and phenylalanine. These residues have intensive absorption in the amide region using H2O solution to dissolve these residues. The quantitative estimation of amino acid side chain groups allows us to more refined analysis of secondary structures of polypeptides and proteins.
Kanagathara, N. et al. [14] have studied FTIR and UV-visible spectral study on normal blood samples and found that the characteristic bands on infrared spectrum in the frequency ranges 3100 cm–1 - 2800 cm–1, 1800 cm–1 - 1400 cm–1 and 1400 cm–1 - 900 cm–1 for lipid, protein and carbohydrates respectively. Vibration band assignment has been also carried out on infrared spectrum of sera on comparing the position relative intensity and shape of the bands with the bands of related molecules. They have also detected a considerable difference in infrared absorbance of these biomolecules.
Gunasekaran, S. et al. [15] have studied FTIR spectral study on jaundice blood samples before and after treatment and found that on the interpretation of the spectra of jaundice blood samples provide a direct link to the assessment of the state of health of healthy person with respect to jaundice patients. They have also found that there are two most intense bands in the spectra of sera samples are amide I and amide II bands. These bands in spectrum of bilirubin are very strong and intense.
Gunasekaran, S. et al. [16] have studied FTIR and UV-visible study on normal and jaundice blood samples. They have shown that the lower wave number region starts with a very intensive amide I band at 1652 cm–1. The deformation motion of the N-H group has dominant contribution in amide II band at 1543 cm–1. There are few bands at 1455 cm–1, 1403 cm–1 and 1314 cm–1 are less intensive and belong to additional vibrations of amino groups and alkyl side chains in proteins. The important band amide III for secondary structure determination is found in the region near 1300 cm–1.
Sankari, S. et al. [17] have studied serum immunoglobulins IgA, IgG and IgM of affected blood samples of multiple myeloma. They have observed that the spectral features were same as expected but the amount of absorption was decreased in IgG samples than that of normal healthy controls. They have measured five intensities ratio parameters such as R1, R2, R3, R4 and R5 among the prominent absorption peaks due to proteins. Authors concluded that the IgG and IgM have shown a decreasing pattern of level of absorption of the vibrational peaks whereas IgA exhibits increased pattern.
Choo, L. P. et al. [18] have studied neuritic plaques and neurofibrillary tangles in human brain and identification of these with FTIR spectroscopy. They have found a band at 1615 cm–1 in Alzheimer’s diseased sample. This band is a characteristic of a protein in an aggregated state. The band arises from Beta A-4 amyloid protein. They have 18q-grey matter spectra which showed increase intensity of phosphate bands in accordance with known hyperphorylation of proteins found in neurofibrillary tangles.
Shaw, R. A. et al. [19] have studied arthritis using synovial fluid as specimen for infrared spectrum analysis. Synovial fluid shows infrared absorption in 400 cm–1 to 2500 cm–1 range of frequencies. They have suggested that the near infrared spectrum of synovial fluid is sufficient to allow diagnosis of the disease affecting the joint from which the sample was drawn.
Tarbit, I. et al. [20] have examined amino acid composition of brain tissue and proved a useful examination. The change in γ-aminobutryic acid concentration was also found. It was highly increased in case of arginine. Authors have suggested that the trends toward increasing free amino acid may be related to an elevated rate of proteolysis.
Mann, D. M. A. et al. [21] have found a reduction in RNA and the volume of the nucleus indicate a decline in protein synthesis.
Benezzeddine, B. L. et al. [22] have studied validation for quantification of immunoglobulins by Fourier transform infrared spectrometry and found that there was a significant correlation between FTIR predicted concentration and the concentration obtained with the clinical reference method.
Smith, K. F. et al. [23] have studied β-sheet secondary structure of the trimeric globular domain of Clq of complement and collagen type VII and X using this spectroscopy. The Clq plays a key role in the recognition of immune complexes, due to this fact there is an initiation in the classical pathway of the complement activation. They have found that the spectrum of Clq showed two major bands at 1655 cm–1 and other at 1661 cm–1. The spectra of collagen showed a major band at 1659 cm–1. Two minor bands were also found at 1632 cm–1 and 1682 cm–1. They have concluded that the Clq globular heads contain primarily β-sheet structure.
Petibois, C. et al. [24] have studied plasma protein contents. They have analyzed albumin, glucose, fibrinogen, IgG(2), lactate, IgG(1), alpha(1)-antitrypsin, alpha(2)-macroglobulin, transferin, appolipoprotein (Apo)-A(1), urea, Apo-B, IgM, Apo C(3), IgA, IgG(4), IgG(3), IgD haptoglobin and alpha(1)-acid glycoprotein. The results were matched with the results obtained by other clinical methods.
Pistorius, A. M. et al. [25] have monitored biomass composition from microbiological sources by using this sophisticated technique. They have determined protein, lipids, carbohydrate content, creatine phosphokinase, egg phosphatidyl choline and starch hydrolysate. Protein content was found at amide II band about 1545 cm–1. Lipid content was determined due to C-H stretching vibrational frequencies between 2984 cm–1 and 2780 cm–1. Carbohydrate content was determined using this methodology and found that due to C-O and C-O-C stretching band, at 1180 cm–1 and 1133 cm–1.
Karadenizli, A. et al. [26] have applied this technique to classify slime from staphylococci. They have succeeded in classification according to species three of four S. aureus samples and four of five S. epidermidis samples.
Toubas, D. et al. [27] have studied this spectroscopy in medical mycology to differentiate Candida. They have used 3 Candida species such as C. albieans, C. glabrate and C. krusei and succeeded in discrimination with each other. These are some types of fungal infections.
Jiarong, W. et al. [28] have conformed protein secondary structure in some species of Fusarium cells under the influence of growth cultures and bodies. They have obtained the percentages of secondary structure components such as α-helix, β-sheet, turn, random coil and β-anti parallel. There was a structural diversity among different Fusarium species. Cell structure of fungi can also be studied with this sophisticated technique.
Issaksson, H. et al. [29] have used this spectroscopy to understand altered bone turnover in renal osteodystrophy. This dystrophy alters metabolic activity and remodeling rate of bone and may lead to different bone composition. They have measured ratios of phosphate to amide I, carbonate to phosphate and carbonate to amide I. Collagen cross link ratio was also measured.
Becker, K. et al. [30] have studied the dynamic changes in staphylococcus aureus small colony variants. They have used first derivative infrared spectra to calculate spectral distances; hierachical clustering based on spectral information resulted in a dendrogram with clear cut discrimination between Scvs and normal phenotypes.
Zwielly, A. et al. [31] have studied human colonic tissues and reported that the FTIR spectroscopy is a tool to discriminate the benign, premalignant and colonic polyps.
Dimitrova, M. et al. [32] have studied breast cancer tumors with the application of FTIR and reported that the quantitative analysis of the secondary structure in the amide I region showed different ratio of α-helix, β-sheet, β-turns, random coils. They have found bands in the case of muco-carcinoma in consequence of muco-glyeoprotein creation, which are characteristic bands 3400 cm–1 and 1300 cm–1.
Petibois, C. et al. [33] have studied plasma protein contents with the help of this spectroscopy. They have analyzed plasma proteins, lactate and urea and reported that their results agreed with obtained by clinical methods. They have also reported that the bands are found for different fractions of immunoglobulin G as 802 cm–1 for IgG1, 1087 cm–1 and 982 cm–1 for IgG2, 1185 cm–1 for IgG3 and 893 cm–1 for IgG4.
Cooper, E. A. et al. [34] have studied protein structure with the help of this spectroscopy. They have given their views such as this technique is very sensitive to the backbone, amide arrangement of peptide and protein molecules. The amide I band is a peculiar band which provides the most insight into secondary structure under biologically relevant conditions.
Buijs, J. et al. [35] have studied change in secondary structure of adsorbed IgG and F(ab’)2. They have shown that the adsorbed amounts decrease with an increasing net charge density on the protein for IgG. This decrease is correlated to a reduction in the β-sheet content which suggested that IgG molecules adsorb in a less compact conformation. The F(ab’)2 fragments have a higher structural stability toward adsorption than whole IgG molecule.
Marco, V. D. W. et al. [36] have studied protein conformation with the help of this technique. They have reported that changes in the amide bands in Fourier transform infrared spectra of proteins are attributed to alterations in protein secondary structure.
Their study revealed that the amid I, II and III, bands differ in their sensitivities to change in protein conformation. The bands in the region 1620 cm–1 to 1630 cm–1 and 1685 cm–1 to 1695 cm–1 were found in amide I region of aggregated protein spectra. No such type of absorption seen in amide II and III region. They concluded that amide I can be used to distinguish between intra and intermolecular β-sheet conformation.
Mackanos, M. A. et al. [37] have studied this spectroscopy for prostate cancer detection. They have found that biochemical changes associated with prostate cancer could be discriminated to classify confined and locally invasive prostate cancers.
Ebenstein, D. M. e. al. [38] have studied nanomechanical properties of calcification, fibrous, and hematoma from atherosclerotic plaques. They have used FTIR spectroscopy to quantify the amount of mineral and lipid in each tissue region. They have also shown that the stiffness of plaque tissue increases with increasing mineral content.
Jiang, Z. et al. [39] have studied urinary composition by infrared spectroscopy. They have shown that 37.4% patients were pure and 33.9% were most frequent calcium oxalate and calcium phosphate were 2.7% only. They concluded that pure stone was calcium oxalate.
Sossé, D. P. et al. [40] have studied gall stone using this technique and found that most gall stones were composed of pigment stones with relative large proportion of cholesterol stones. They have revealed that this technique is a method to determine quality and quantity of biochemical components of gall stones.
Renuga, D. T. S. et al. [41] have studied renal failure patients blood samples for FTIR analysis. They have calculated internal standard ratio among some selected specific absorption peaks. Their data were well supported by the clinical findings.
Haas, S. L. et al. [42] have studied myocardial infarction and heart failure. They have used artificial neural network algotherim with FTIR experimental findings in heart failure and myocardial infarction and concluded that FTIR spectroscopy is a tool to diagnose heart diseases from serum samples.
Malins, D. C. et al. [43] have studied progressive alterations in breast DNA with the help of this spectroscopy. They have used base model data with their spectral data and found that there is a high correlation between these two. This correlation is a predictor of breast cancer. Their results also suggest therapeutic strategies for potentially reversing the extent of DNA damage may be useful in disease prevention and treatment.
Elliolt, A. et al. [44] have studied structure of synthetic polypeptides. They have used methyl ester and found that components of C=O band with α and β forms at 1658 cm–1 and 1629 cm–1 respectively. The N-H deformation mode has two frequencies 1527 cm–1 and 1550 cm–1 showed a parallel and perpendicular dichroism corresponding to the β and α-forms.
Timasheff, S. N. et al. [45] have studied infrared investigation of the secondary structure of β-lactogobulins. They have shown that the amide I band due to C=O stretching is characterised by a sharp maxima at 1632 cm–1 and by pronounced skewness on the high frequency side, with weak but reproducible shoulders close to 1650 cm–1 and 1685 cm–1. They have also found that the centre of amide II band was 1530 cm–1. Their results indicate a prevalence of β conformation in the native structure of this protein.
Pauling, L. et al. [46] have studied configurations of polypeptide chains with favoured orientations around single bands. They have shown that 5.1 residue helix is a less stable configuration of polypeptide chains than the 3.7-residuce helix.
Susi, H. et al. [47] have studied protein structure and applied second derivative method to Fourier transform spectra of proteins such as ribonuclease A, hemoglobin and β-lactogobulins A and obtained spectra at 1350 cm–1 to 1800 cm–1. They have also shown that observed peaks were associated with the α-helix, β-strands and turns.
Krimm, S. et al. [48] have studied intermolecular interaction effects in the amide I vibrations of β polypeptides. The modification of the perturbation treatment of amide I modes has important implications for the analysis of peptide conformations in proteins by FTIR spectroscopy.
Miyazawa, T. [49] studied perturbation treatment of the characteristic vibrations of polypeptide chains in various configurations. He had pointed out that the amide I and II frequencies were derived in terms of adjacent group interactions as well as interchain and interchain hydrogen bonding interactions. Each characteristic vibration of the amide group gives rise to parallel and perpendicular bands. The parallel bands of α-helix of poly-γ- benzyl-L-glutamate were found at 1650 cm–1 (amide I), and 1516 cm–1 (amide II). The perpendicular bands were observed at 1652 cm–1 and 1546 cm–1 as amide I and II band respectively.
Byler, D. M. et al. [50] have studied secondary structure of proteins. They have studied 21 globular proteins in D2O solution. Proteins are frequently referred to as having a certain fraction of helical structure and a certain fraction of extended β structure. The secondary structure of proteins in infrared spectrum is reflected by the amide I and amide II bands. Amide I absorbs around 1620 cm–1 to 1690 cm–1. This band is associated with the stretching vibrations of peptide carbonyl groups. They have found that immunoglobulin G has 76% β structure and 9% α-helix. The protein such as α-actalbumin has 41% β structure with 33% α-helix, while β-lactogobulins has 50% β structure with 10% α-helix.
Mantsch, H. H. et al. [51] have studied resolution enhancement of the infrared spectra of biomolecules. Living things are composed of lifeless molecules. Biomolecules conform all the physical and chemical laws on isolation and individually examination. Biomolecules describe the behavior of inanimate matter. The use of infrared spectroscopy to study biomolecules in their natural aqueous environment has lagged behind that of other spectroscopic techniques. Large width of the individual absorption bands leads to highly complex band contours due to the overlap of several bands. This problem of overlapping has been solved by using FTIR spectroscopy to obtain information of biomolecules.
Proteins constitute the largest fraction of living matter in all types of cells. Most proteins serve as structural elements in cells and tissues. Many other biological functions are served by proteins, which are most versatile of all biomolecules.
Immunoglobulin G is a globular protein.
4. Materials and Methods
Blood samples of the epileptic children, migraineous, paralytic, Alzheimer’s disease and muscular dystrophy patients along with normal healthy controls were collected from the Department of Neurology, I.H.B.A.S., New Delhi after the approval of ethical committee of the hospital. 10 ml. of freshly drawn blood was collected in siliconised screw capped test tubes. Separation of IgG was done by protein A sepharose method [52] .
Samples were prepared for infrared spectroscopic measurements by taking about 1 mg of the human IgG which has been prepared in the Biotechnology laboratory of our college and 100 - 150 mg of KBr grinded together, finally dried to remove moisture and pressed at elevated temperature under high pressure into a small disc. A clear pellet is obtained. The infrared spectra of prepared samples were recorded in the range from 400 cm–1 to 4000 cm–1 with single beam Fourier transform infrared spectrophotometer, Perkin Elemer Model-1710. This instrument has the following units and features. IR source which had temperature established ceramic source operating at 1400 K. The abscissa accuracy and ordinate precision are 0.01 cm–1 and 0.1% T, respectively. This instrument has a resolution of 1 cm–1 to 64 cm–1 [1 cm–1 with a memory option fitted]. The ambient temperature and relative humidity are 15°C to 35°C and 75% max, respectively. There are three units, which are given here: 1) centre processing unit 2) cathode ray tube and 3) fast recovery deuterated triglyceride sulphate detector.
5. Results
Typical FTIR spectra of different diseases such as epilepsy, migraine, paraplegia, DMD and Alzheimer’s disease with normals are shown in Figures 3 to 8.
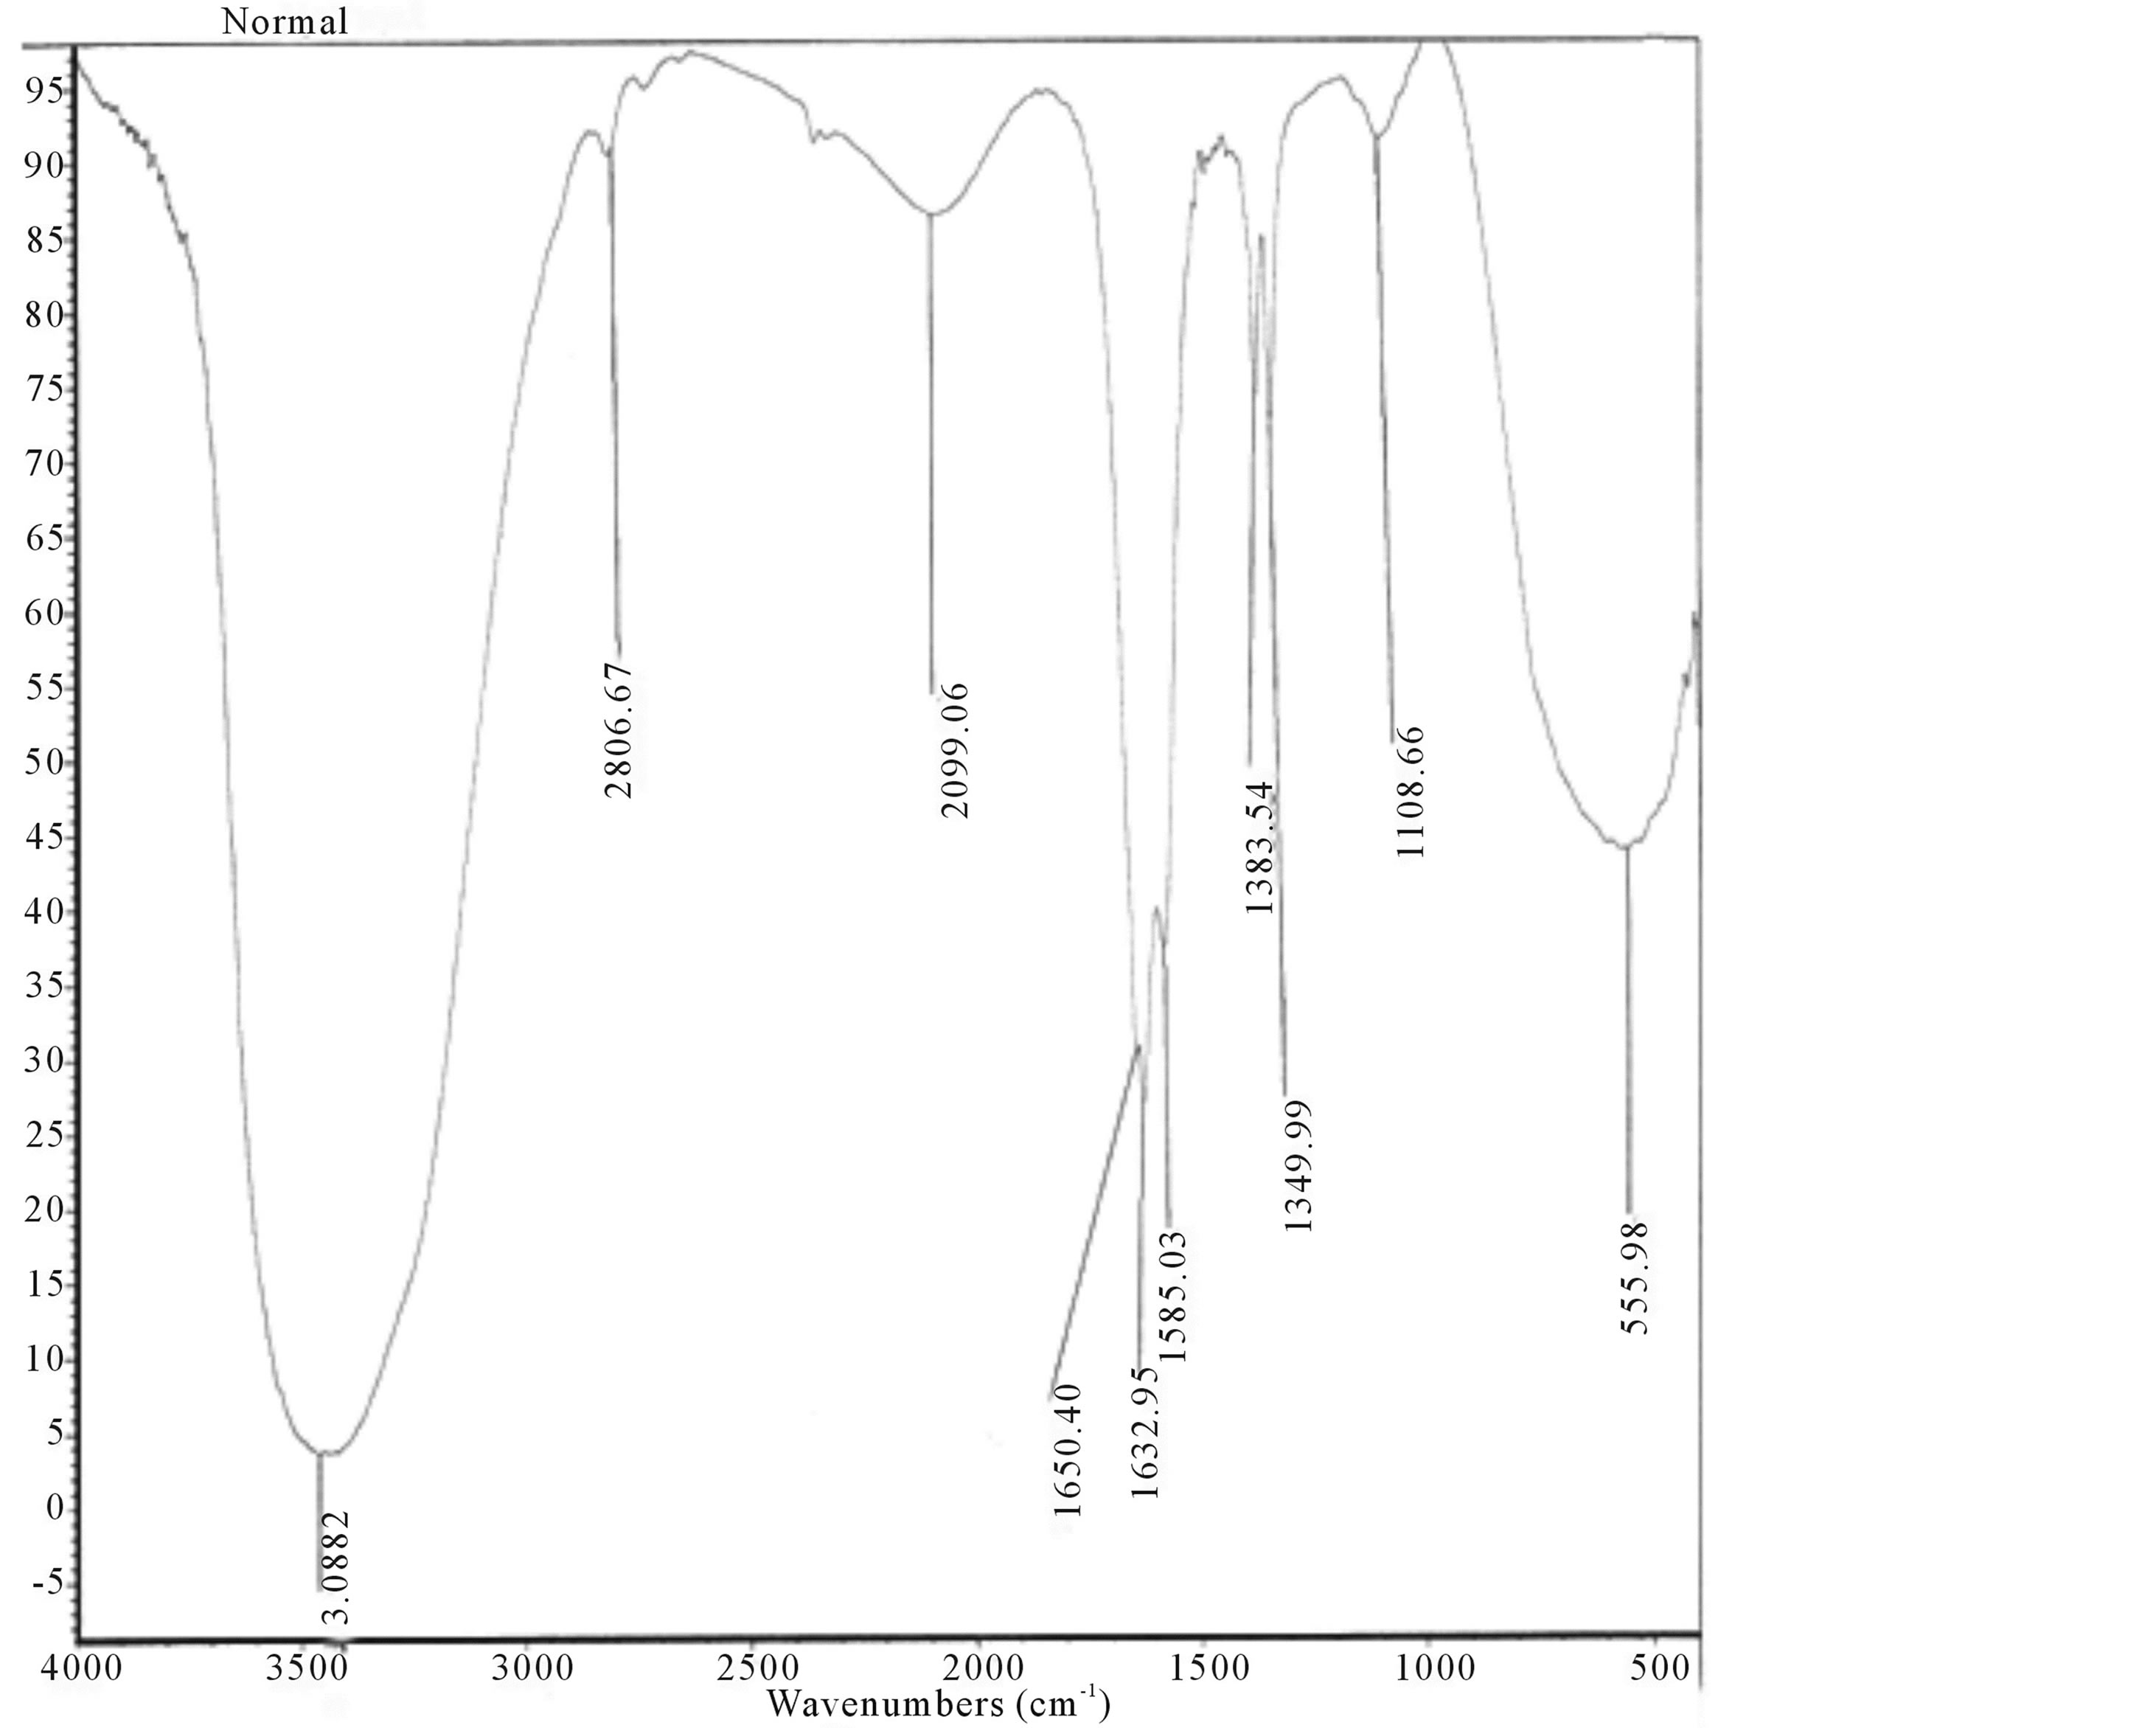
Figure 3. FTIR spectrum of normal sample.

Figure 4. FTIR spectrum of paralytic sample.
Comparative chart of the vibrational frequencies and force constants with probable assignment obtained from the different spectra of IgG of diseased and normal healthy persons is given here in Table A1 in Appendix. We are giving here some of the main features of infrared band present in the protein structure in Table A2 in Appendix. We are showing here important features of infrared band present in protein structure such as immunoglobulin G of the present work in Table A3 in Appendix. We are giving here amide I band frequency and assignments to the secondary structure of proteins by Dong, A. et al. [53] in Table A4 in Appendix. We are giving here characteristic side chain frequencies of amino acid residues by Krimm, S. et al. [9] in Table A5 in Appendix.
6. Discussion
Abaturov L. V. et al. [54] have reported the observed frequencies of four amide bands of IgG, its peptide chains and proteolytic fragments. The frequencies and the shape of the amide bands of sulfonated IgG and F(ab’)2 fragment were identical to those of the complete molecule. Position of the band maximum e.g. namely amide I, amide II, amide A and amide B in IgG, light chain of IgG and Fab fragments of IgG have been found to be 1644 cm–1, 1550 cm–1, 3295 cm–1 and 3055 cm–1 respectively.
Amide A and Amide I bands are intact and found in all diseased and normal samples. Amide II band is found in two cases of paralysis and one case of epilepsy and migraine. This band was absent in DMD, Alzheimer’s disease and controls. Amide IV band is found in some cases of DMD, Alzheimer’s disease and normal samples only. This band is absent in epilepsy, migraine and paralysis samples. Amide V band is found in some cases of paralysis and normal samples only. No trace of this band was found in epilepsy, migraine, DMD and Alzhei-

Figure 5. FTIR spectra of migraineous sample.
mer’s disease cases.
Amide VI band is found in two case of Alzheimer’s disease and normals. Amide VI band is absent in epilepsy, migraine, paralysis and DMD also. Carbide compound is found in paralysis, Alzheimer’s disease, DMD and normals only. This compound was absent in epilepsy and migraine samples. Hydrocarbon (C-H) band is found in paralysis, Alzheimer’s disease and normals only. This band is absent in DMD, epilepsy and migraine. Peroxide compound is found in all the diseases and normals. On the bases of FTIR findings we have found some bands which are completely absent in diseases compared to normal healthy persons and some bands are found in all the cases. We can say that the structure of IgG was not completely disturbed and partially damaged and many other methods of different techniques of science may be applied to maintain the structure of IgG. Some clinical and medicinal procedures may be fruitful for the safe recovery of the structure. Now further directions of research are needed to study more. The complex shape and asymmetry of Amide I band are indications of high heterogenicity of the secondary structure of IgG. The maxima of this band (1644 cm–1) arises due to irregular conformation and the shoulder (1637 cm–1) observed with the better resolution appears due to β-structure.
The inflexion at 1665 cm–1 shows the presence of an irregular and β-conformations as the major elements of the secondary structure of IgG. The band frequencies of the papain fragments of IgG are almost identical to the intact IgG molecule. However, we notice a little difference in the shape of the amide I band. This band possesses greater half-width in the infrared spectrum of the Fc fragment; compared to the full IgG and the Fab fragments. The shape of the amide II band in the infrared spectra of the Fab and Fc fragments is very near to the full IgG. There are no strong differences in the position and in the shape of the amide bands of IgG as compared with both of the papain fragments.
The technique of spectroscopy has used for study the secondary structures of polypeptides and proteins. Krimm, S. et al. [9] have given a proof of nine characteristic vibrational bands or group frequencies that arise

Figure 6. FTIR spectrum of epileptic sample.

Figure 7. FTIR spectrum of Duchenne muscular dystrophic sample.
from the amide groups of protein. Among them, the amide I band (1700 cm–1 to 1620 cm–1) is due to C=O stretching vibration of the peptide linkages that constitute the backbone structure. The another intense absorption band is amide II band (1600 cm–1 to 1500 cm–1) due to an out-of-phase combination of N-H in plane bending and C-N stretching vibrations of peptide groups has been used for determination of protein structures. There is a peculear feature is high sensitivity to small variations in molecular geometry and hydrogen bonding makes amide I band uniquely very useful for analyzing protein secondary structures and monitoring the conformational changes in proteins that involve secondary structure. Each type of secondary structure gives rise to a different C=O stretch frequency in the amide I region of the infrared spectra.

Figure 8. FTIR spectrum of Alzheimer’s disease sample.
7. Conclusions
Some amino acid residues, especially arginine, asparagines, glutamine, asparatic and glutamic acids, lysine, tyrosine, histidine and phenylaline have very fast absorption in the amide band region.
Many diseases generate specific changes in the metabolic pattern of blood or other body fluids. These changes may produce particular spectroscopic indications, which can be used for identification and classification of the diseases in seconds to minutes.
In the present work we have succeeded in identifying the basic atomic level transformations occurring in different neurological disturbances. It is possible, on the basis of our investigations to use this technique for differential diagnosis of the various pathological disorders and to some extent the stage of the disease. It has already been pointed out that the infrared spectra exhibit the presence of specific bands peculiar to a particular disease such as epilepsy, migraine, headache, paraplegia, Alzheimer’s disease and muscular dystrophy as compared to the normal samples.
The FTIR experimental findings show that the stability of the secondary structure in these neurological perturbations is completely disturbed.
Acknowledgements
The authors are thankful to Dr. P. K. Saxena, Principal, D. A. V. College, Muzaffarnagar for providing the facility of doing work. We are also thankful to Dr. V. N. Mishra, Associate Professor, I.H.B.A.S., New Delhi, for arranging the blood samples of the diseased and healthy controls. Our thanks go to Dr. Manju Chauhan, Head, Department of Biosciences, D. A. V. College, Muzaffarnagar for providing the facilities of purification of immunoglobulin G from the sera of different blood samples of the human disorders. One of the authors S.K. is thank full to University Grants Commission, New Delhi, INDIA for granting minor research project. Reference No. F.8-2(170)/2011(MRP/NRCB).
References
- Mark, B. (2002) Fourier Transform Infrared Spectroscopy. In: Practicing Oil Analysis-Fourier Transform Infrared Spectroscopy-Machinery Lubrication, Noria Publication, Tula, 1-4.
- Whiffen, D.H. (1972) Infrared Spectroscopy. In: Spectroscopy, 2nd Edition, John Wiley & Sons, Inc., New York, 92-107.
- Gupta, S.L., Kumar, V. and Sharma, R.C. (2007) Vibrational-Rotational Spectra (Near Infrared Spectroscopy). In: Elements of Spectroscopy, Pragati Prakashan, Meerut, 410-449.
- Sturat, B. (1997) Biological Applications of Infrared Spectroscopy. John Wiley & Sons, Chichester, 25-33.
- Schmit, J. and Flemming, H.C. (1998) FTIR Spectroscopy in Microbial and Material Analysis. International Biodeterioration & Biodegradation, 41, 1-11. http://dx.doi.org/10.1016/S0964-8305(98)80002-4
- Naumann, D. (1984) Some Ultrastructural Information on Intact, Living Bacterial Cells and Related Cell-Wall Fragments as Given by FTIR. Infrared Physics, 24, 233-238.
- Naumann, D., Fijala, V., Labichinski, H. and Giesbrecht, P. (1988) The Rapid Differentiation and Identification of Pathogenic Bacteria Using Fourier Transform Infrared Spectroscopic and Multivariate Statistical Analysis. Journal of Molecular Structure, 174, 165-170. http://dx.doi.org/10.1016/0022-2860(88)80152-2
- Ellis, D.I., Harrigan, G.G. and Goodcare, R. (2003) Its Role in Biomarker Discovery and Gene Function Analysis. In: Goodcare, R. and Harrigan, G.G., Eds., Kluwer Academic, Boston, 111-124.
- Krimm, S. and Bandekar, J. (1986) Vibrational Spectroscopy and Conformation of Peptides, Polypeptides and Proteins. Advances in Protein Chemistry, 38, 181-364. http://dx.doi.org/10.1016/S0065-3233(08)60528-8
- Movasaghi, Z., Rehman, S. and Ur Rehman, I. (2008) Fourier Transform Infrared (FTIR) Spectroscopy of Biological Tissues. Applied Spectroscopy Review, 43, 134-179.
- Kong, J. and Yu, S. (2007) Fourier Transform Infrared Spectroscopic Analysis of Proteins in Secondary. Acta Biochimica et Biophysica Sinica, 39, 549-559.
- Venyaminev, S.Y. and Kalmin, N.H. (1990) Quantitative IR Spectrophotometry of Peptides Compounds in Water (H2O) Solution, I, Spectral Parameters of Amino Acid Residue Absorption Bands. Biopolymers, 30, 1243-1257. http://dx.doi.org/10.1002/bip.360301309
- Chirgadze, Y.N., Fedorov, O.V. and Trushina, N.P. (1975) Estimation of Amino Acid Residue Side-Chain Absorption in Infrared Spectra of Protein Solution in Heavy Water. Biopolymers, 14, 679-694. http://dx.doi.org/10.1002/bip.1975.360140402
- Kanagathara, N., Thirunavukkarasu, M., Jeyanthi, C.E. and Shenabagarajan, P. (2011) FTIR and UV-Visible Spectral Study on Normal Blood Samples. International Journal of Pharmacy and Biological Sciences, 1, 74-80.
- Gunasekaran, S., Uthra, D., Sailatha, E. and Anita, B. (2010) FTIR Spectral Study on Jaundice Blood Samples before and after Treatment. Asian Journal of Chemistry, 22, 51-56.
- Gunasekaran, S. and Uthra, D. (2008) FTIR and UV-Visible Spectral Study on Normal and Jaundice Blood Samples. Asian Journal of Chemistry, 20, 5695-5703.
- Sankari, G., Krishnamoorthy, E., Jayakumaran, S., Gunasekaran, S., Vishnu, P.V., Subramanian, S., Subramaniam, S. and Surapaneni, K.M. (2010) Analysis of Serum Immunoglobulins Using Fourier Transforms Infrared Spectral Measurements. Biology & Medicine, 2, 42-48.
- Chou, L.P., Jackson, M., Willian, C.H. and Mantsch, H.H. (1994) Alzheimer’s Disease: Neuritic Plaques and Neurofibrillary Tangles in Human Brain Identified by FTIR Spectroscopy. Proceedings of SPIE 2089, 9th International Conference on Fourier Transform Spectroscopy, Calgary, 104. http://dx.doi.org./10.1117/12.166733.
- Show, R.A., Kotowich, S., Ecysel, H.H., Jackson, M., Thomson, G.T. and Mantsch, H.H. (1995) Arthritis Diagnosis Based upon the Near-Infrared Spectrum of Synovial Fluid. Rheumatology International, 15, 159-165. http://dx.doi.org/10.1007/BF00301774
- Tarbit, I., Perry, E.K., Perry, R.H., Blessed, G. and Tomlinson, B.E. (1980) Hippocampal Freo Amino Acid in Alzheimer’s Disease. Journal of Neurochemistry, 35, 1246-1249. http://dx.doi.org/10.1111/j.1471-4159.1980.tb07883.x
- Mann, D.M.A. and Sinclair, K.G.A. (1971) The Quantitative Assessment of Lipofusion, Cytoplasmic RNA and Molecular Volume in Senile Dementia. Neuropathology and Applied Neurobiology, 4, 129-135. http://dx.doi.org/10.1111/j.1365-2990.1978.tb00553.x
- Benezzeddine, B.L., Cazorla, G. and Melin, A.M. (2009) Validation for Quantification of Immunoglobulins by Fourier Transform Infrared Spectra. Clinical Chemistry and Laboratory Medicine, 47, 83-90.
- Smith, K.F., Haris, P.I., Chapman, D., Reid, K.B. and Perkins, S.J. (1994) Beta-Sheet Secondary Structure of the Trimeric Globular Domain of Clq of Complement and Collagen Type VII, and X by Fourier Transform Infrared Spectroscopy and Averaged Structure Predictions. Biochemical Journal, 301, 249-256.
- Petibois, C., Cazoria, G., Cassaigne, A. and Déldris, G. (2001) Plasma Protein Contents Determined by Fourier Transform Infrared Spectrometry. Clinical Chemistry, 47, 730-738.
- Pistorius, A.M., De Grip, W.J. and Egerova-Zachemyuk, T.A. (2009) Monitoring of Biomass Composition from Microbiological Sources by Means of FTIR Spectroscopy. Biotechnology and Bioengineering, 103, 123-129. http://dx.doi.org/10.1002/bit.22220
- Karadenizli, A., Kolayli, F. and Ergen, K. (2007) A Novel Application of Fourier Transfered Infrared Spectroscopy: Classification of Slime from Staphylococci. Biofouling, 23, 63-71.
- Toubas, D., Essendoubi, M., Adt, I., Pinon, J.M., Manfait, M. and Sockalingum, G.D. (2007) FTIR Spectroscopy in Medical Mycology: Applications to the Differentiation and Typing of Candel. Analytical and Bioanalytical Chemistry, 387, 1729-1737. http://dx.doi.org/10.1007/s00216-006-1005-1
- Tiarang, W., Liv, Y., Lan, L., Yan, G., Ming, N.I.E. and Zhou, J. (2009) Conformational Study of Protein in Some Species of Fubarium by FTIR Spectroscopy. Annals of Microbiology, 58, 169-171.
- Isa Ksan, H., Turunen, M.J., Rieppo, L., Saarakkala, S., Tanminen, I.S., Rieppo, J., Kröger, H. and Jurvelin, J.S. (2010) Infrared Spectroscopy Indicates Altered Bone Turnover and Remodeling Activity in Renal Osteodystrophy. Journal of Bone and Mineral Research, 25, 1360-1366. http://dx.doi.org/10.1002/jbmr.10
- Becker, K., Lahnam, N.A., Fegeler, W., Proctor, R.A., Peters, G. and Van Eift, C. (2006) Fourier Transform Infrared Spectroscopic Analysis Is a Powerful Tool for Studying the Synamic Changes in Staphylacoccusaureus Small-Colony Variants. Journal of Clinical Microbiology, 44, 3274-3278. http://dx.doi.org/10.1128/JCM.00847-06
- Zwielly, A., Mordechai, S., Sinielnikav, I., Salman, A., Bagomotny, E. and Argev, S. (2010) Advanced Statistical Techniques Applied to Comprehensive FTIR Spectra on Human Colonic Tissues. Medical Physics, 37, 1047-1055. http://dx.doi.org/10.1118/1.3298013
- Dimitrova, M., Ivanova, D., Karamancheva, I., Mileu, A. and Dobreu, I. (2009) Application of FTIR Spectroscopy for Diagnosis of Breast Cancer Tumors. Journal of University of Chemical Technology and Metallurgy, 44, 297-300.
- Petibois, C., Cazerla, G., Cassaigne, A. and Déléris, G. (2001) Plasma Protein Contents Determined by Fourier Transform Infrared Spectrometry. Clinical Chemistry, 47, 730-738.
- Cooper, F.A. and Knutson, K. (1995) Fourier Transform Infrared Spectroscopy Investigations of Protein Structure. Pharmaceutical Biotechnology, 7, 101-143. http://dx.doi.org/10.1007/978-1-4899-1079-0_3
- Buijsand, J. and Nerde, W. (1996) Changes in the Secondary Structure of Adsorbed IgG and F(ab’)2 Studied by FTIR Spectroscopy. Langmuir, 12, 1605-1613. http://dx.doi.org/10.1021/la950665s
- Marco, V.D., Parvez, I.H., Wim, E.H. and Daan, J.A.C. (2001) Fourier Transform Infrared Spectrometric Analysis of Protein Conformation: Effect of Sampling Method and Stress Factors. Analytical Biochemistry, 297, 160-169. http://dx.doi.org/10.1006/abio.2001.5337
- Mackanos, M.A. and Contag, C.H. (2009) FTIR Micro Spectroscopy for Improved Prostate Cancer Diagnosis. Trends in Biotechnology, 27, 661-663. http://dx.doi.org/10.1016/j.tibtech.2009.09.001
- Ebestein, D.M., Coughlin, D., Chapman, J. and Licand Pruitt, L.A. (2009) Nonmechanical Proterties of Calcification, Figrous Tissue, and Hematoma from Atherosclerotic Plaques. Journal of Biomedical Materials Research Part A, 91, 1028-1037. http://dx.doi.org/10.1002/jbm.a.32321
- Zhang, J., Wang, G.Z., Jiang, N., Yang, J.W., Gu, Y. and Fang, Y. (2010) Analysis of Urinary Calculi Composition by Infrared Spectroscopy: A Prospective Study of 625 Patients in Estern China. Urological Research, 38, 111-115. http://dx.doi.org/10.1007/s00240-010-0253-x
- Sossé, D.P., Aké, M.A., Tiahov, G., Koffi, G., CisséCamara, M., Diohan, F., Yapo, E., Kassayou, S., Peuchant, E., Essiagne, S.D. and Mannet, D. (2010) Gall Stone Biochemical Characteristics Using Fourier Transform Infrared Spectroscopy Method. Annales de Biologie Clinique (Paris), 68, 39-42.
- Renuga, D.T.S., Gunasekaran, S., Hudson, J.W. and Joybell, I.S.A. (2009) Analysis of Renal Failure Patients Blood Samples: Characterization and Efficacy Study. Indian Journal of Science and Technology, 2, 46-50.
- Haas, S.L., Möller, R., Fernandes, A., Dzeyk-Boycheva, K., Wörl, S., Hohmann, J., Hemberger, S., Elmas, E., Brökhmann, M., Bugert, P. and Backhaus, J. (2010) Spectroscopic Diagnosis of Myocardial Infarction and Heart Failure by Fourier Transforms Infrared Spectroscopy in Serum Samples. Applied Spectroscopy, 64, 262-267. http://dx.doi.org/10.1366/000370210790918508
- Malins, D.C., Polissar, N.L., Niohikila, K., Holmes, E.H., Gardner, H.S. and Gunselman, S.J. (1995) The Etiology and Prediction of Breast Cancer. Fourier Transform Infrared Spectroscopy Reveals Progressive Alterations in Breast DNA Leading to a Cancel-Like Phemotype in a High Proportion of Normal Woman. Cancer, 75, 503-517. http://dx.doi.org/10.1002/1097-0142(19950115)75:2<503::AID-CNCR2820750213>3.0.CO;2-0
- Elliott, A. and Ambrose, E.J. (1950) Structure of Synthetic Polypeptides. Nature, 165, 921-922. http://dx.doi.org/10.1038/165921a0
- Timasheff, S.N. and Susi, H. (1966) Infrared Investigations of the Secondary Structure of β-Lactoglobulins. Journal of Biological Chemistry, 241, 249-251.
- Pauling, L. and Corey, R.B. (1951) Configurations of Polyplptide Chains with Favored Orientations around Single Bonds: Two New Pleated Sheets. Proceedings of the National Academy of Sciences of the United States of America, 37, 729-740. http://dx.doi.org/10.1073/pnas.37.11.729
- Susi, H. and Byler, D.M. (1983) Protein Structure by Fourier Transform Spectroscopy: Second Derivative Spectra. Biochemical and Biophysical Research Communications, 115, 391-397. http://dx.doi.org/10.1016/0006-291X(83)91016-1
- Krimm, S. and Yasuaki, A. (1972) Intermolecular Interaction Effects in the Amide I Vibrations of β-Poly Peptides. Proceedings of the National Academy of Sciences of the United States of America, 69, 2788-2792. http://dx.doi.org/10.1073/pnas.69.10.2788
- Miyazawa, T. (1960) Perturbation Treatment of the Characteristic Vibrations of Polypeptide Chains in Various Configurations. Journal of Chemical Physics, 32, 1647-1656. http://dx.doi.org/10.1063/1.1730999
- Byler, D.M. and Susi, H. (1986) Examination of the Secondary Structure of Proteins by Deconvolved FTIR Spectra. Biopolymers, 25, 469-487. http://dx.doi.org/10.1002/bip.360250307
- Mantsch, H.H., Heetor, L.C. and Tones, R.N. (1986) Resolution Enhancement of Infrared Spectra of Biological Systems. In: Clark, R.J.H. and Hester, R.E., Eds., Spectroscopy of Biological System, Advances in Spectroscopy, Vol. 13, John Willey & Sons, New York, 16-45.
- Hudson, L. and Hay, F.C. (1980) Practical Immunology. 2nd Edition, Blackwell Scientific Publications, Oxford, 222.
- Dong, A., Huang, P. and Caughey, W.S. (1990) Protein Secondary Structures in Water from Second-Derivative Amide I Infrared Spectra. Biochemistry, 29, 3303-3308. http://dx.doi.org/10.1021/bi00465a022
- Abaturov, L.V., Nezlin, R.S., Vengerova, T.I. and Varshavsky Jr., M. (1969) Conformational Studies of Immunoglobulin Gand Its Sub Units by the Method of Hydrogen-Deutrium Exchange and Infrared Spectroscopy. Biochimica et Biophysica Acta, 194, 386-396. http://dx.doi.org/10.1016/0005-2795(69)90099-3
Appendix

Table A1. FTIR spectra of IgG in normal and pathological samples. E: Epilepsy, M: Migraine, P: Paralysis, DMD: Duchenne Muscular dystrophy) and A: Alzheimer’s Disease.
Continued
Continued
Continued
Continued
Continued
Continued
Continued
Table A2. Main features of infrared band present in protein structure.
Table A3. Main features of infrared band present in protein structure of the present work.
Table A4. Amide I band frequencies and assignments to the secondary structure of proteins.
Table A5. Characteristic side-chain frequencies.
NOTES

*Corresponding author.