Natural Resources
Vol.4 No.6(2013), Article ID:37953,8 pages DOI:10.4236/nr.2013.46054
Assessment of Water Quality in Tigris River-Iraq by Using GIS Mapping
![]()
Environmental Research Center, University of Technology, Baghdad, Iraq.
Email: ajk_mjk@yahoo.com
Copyright © 2013 Abbas J. Kadhem. This is an open access article distributed under the Creative Commons Attribution License, which permits unrestricted use, distribution, and reproduction in any medium, provided the original work is properly cited.
Received July 14th, 2013; revised August 27th, 2013; accepted September 16th, 2013
Keywords: Tigris River; Water Quality; GIS
ABSTRACT
In this study, 96 water samples were collected from the Tigris River within Baghdad city. These samples were used for studying the physical and chemical parameters by using a geographical information system GIS (spatial analysis). The analytical results show high concentration of total dissolved solid (TDS), electric conductivity (EC), total hardness, Sulphate (SO4), Chloride (Cl) and Iron (Fe), which indicates signs of deterioration. On the other hand, the values of pH, calcium (Ca), Magnesium (Mg), and fluoride (F) are within permissible limits as per World Health Organization (WHO) and Iraqi Criteria.
1. Introduction
Water is the most precious gift of nature, the most crucial for sustaining life and is required in almost all the activities of man—for drinking and municipal use, irrigation to meet the needs of growing food, industries, power generation, navigation, and recreation [1]. However, water quality in many large rivers has deteriorated significantly worldwide due to anthropogenic activities in the past 2 - 3 decades [2,3].
It is also widely accepted that discharges from sewage treatment plants provide the major rivers sources of Phosphorus (P) and Nitrogen (N), predominantly in populated urban areas [2,4,5]. A continuous monitoring of water quality is very essential to determine the state of pollution in River [6]. Over large parts of the world, Rivers and Lakes show increasing trends of water pollution. This holds especially for developing countries under economic expansion and increasing population sizes. Evaluation of the physical, chemical, and biological water pollution is essential for the abatement of freshwater pollution.
The Tigris River is one of the largest rivers in Iraq, and is considered the main source of drinking water for Baghdad, which is the largest city in the country and the second largest city in the Arab world with a population estimated by 7.5 million [7,8].
In this study, a geographical information system (GIS) was used, in order to compare water quality data and related information collected for water quality in Tigris River, and display the distribution of contamination in the river in easily viewed maps that can be used by the public and decision makers.
2. Materials and Methods
2.1. Study Area
The Tigris River is one of the largest rivers in the Middle East, stretching for over 1900 km, of which 1415 km are within Iraq, the catchment area reach to 235,000 km². Tigris River sharing with Euphrates River the main source for man uses, especially for drinking water since they pass the major cities in the country [6]. The River enters Baghdad city at coordinates 44˚24' E, 33˚36' N and divides the city into two parts (Karkh & Risafa). The length of the river along Baghdad city is about 110 km.
2.2. Chemical Analysis
Eight locations were selected for this study. The locations included east Tigris (site 1), Al wathbah (site 2), Al karamah (site 3), Al Qadisiya (site 4), AD Dawrah (site 5), AR Rashid (site 6), Al Wahdah (site 7) and Diyala Bridge (Site 8). The locations of sampling points are shown in Figure 1. These locations were chosen to cover all the distance of Tigris River within Baghdad city.

Figure 1. The sampling sites at Tigris River, Baghdad.
The water samples were collected in good quality polyethylene bottles during Jun-Dec 2008. Physical parameters such as pH and EC were determined at the site by using digital portable water (PH, EC meter), while other examinations were done according to standard specifications presented by the American public health association [9]. For Determination of major cations, anions and heavy metals were made in the laboratory using the analytical methods shown in Table 1.
2.3. Geographic Information System (GIS) Analysis
Geographical Information system (GIS) is a computerbased technology for handling geographical data in digital form. It is designed to capture, store, manipulate, analyze, and display diverse sets of spatial or geo-referenced data [10,11]. Coordinates of sampling points were recorded by mobile GPS (Etrax). The results of the chemicals analysis (mean value per sampling point) were then used as input data in ArcGIS 9.2. The sampling locations were integrated with the water data for the generation of spatial distribution maps. The present study used the Inverse Distance Weighted (IDW) method for spatial interpolation of water parameters. IDW determines cell values using a liner-weighted combination set of sample points. The weight assigned is a function of the distance of an input point from the output cell location. The greater the distance, the less influence the cell has on the output value [12].
3. Result and Discussion
Table 2 illustrates the mean value of 17 water quality parameters which compared with three standard WHO [13], CCME [14], Iraqi standard [15].
3.1. Power of Hydrogen (pH)
The pH value of aquatic system is an important indicator

Table 1. Estimation of various physicochemical parameters by different methods.

Table 2. Iraqi and international standards.
of the water quality and the extent pollution in the water shed areas [6,16]. The pH for the water samples varied from 7.91 to 8.1 with an average value 8.02, which indicates that water is slightly alkaline in nature. Figure 2 shows that all the water samples are within permissible limit prescribed by WHO [14].
3.2. Electric Conductivity & Total Dissolved Solid
Salinity is determined by measuring the ability of water to conduct an electrical current. Salinity is expressed in

Figure 2. Average pH value in water sample.

Figure 3. Average EC values in water sample.
two different ways, either as electrical conductivity (EC) or as total dissolved salts (TDS). The values of Conductivity varied from 793.42 to 1189.76 µs/cm, TDS values ranged from 519.17 to 787.67 mg/L with an average value of 700.77 mg/L shown in Figures 3 and 4 respec-

Figure 4. Average TDS values in water sample.
tively. The most desirable limit of TDS in drinking water is 500 as per WHO standard, and all the samples exceed this limit.
Irrigation water is classified into four categories represented in Table 3, based on salinity hazard, which considers the potential source for damaging the plants and the level of management needed for utilization as an irrigation source [17]. Water with EC readings of less than 750 µs/cm is generally suitable for irrigation without problems. Successful use of water with EC values above 750 µs/cm depends upon soil conditions and plant tolerance to salinity. Generally, higher salinity levels can be used on sandy soils where salts can be easily flushed compared to similar values on poorly draining clay soils, which may cause problems. Under typical summer stress growing conditions, EC for irrigation water should ideally not exceed 1250 µs/cm soluble salts. Salinity levels above 3000 µs/cm are unsuitable for any length of time as an irrigation source [18]. According to the classification of Table 3 that showed below, the water of this study area fall in high saline category.
3.3. Turbidity & Total Suspended Solid
Turbidity refers to water clarity. The greater the amount of suspended solids in the water, the murkier it appears, consequently the turbidity values will be higher. Turbidity values ranged from a minimum of 24.58 to a maximum of 33.22 with an average value of 28.06 (NTU) while the lowest TSS value was 38.83mg/L and the highest was about 73.45 mg/L as shown in Figures 5 and 6

Table 3. Classification of water according to EC and TDS.

Figure 5. Average Turb. values in water sample.
respectively. According to drinking water standard (WHO) and Canadian water Quality Guidelines for the Protection of Aquatic Life (CCME) are listed in Table 2, turbidity in Tigris River was not acceptable.

Figure 6. Average TSS values in water sample.
3.4. Cation (Total Hardness, Ca, Mg)
Based on the General guidelines for classification of hardness water as calcium carbonate; 0 to 60 mg/L is classified as soft; 61 to 120 mg/L as moderately hard; 121 to 180 mg/L as hard and more than 180 mg/L as very hard. So, Figure 7 shows that most water in Tigris River is very hard. Most of the Ca (mg/L) shows higher concentrations than the Iraqi standards [15] which are listed in Table 2, where the maximum value was 136.67 mg/L and the minimum value was 69.38 mg/L as shown in Figure 8. While Figure 9 shows that the Mg (mg/L) concentrations in all sites are within the Iraqi Standards. Dissolved calcium and magnesium in water are the two most common mineral that make water “hard” [16].
3.5. Anion (CL, F, SO4, NO3, NO2, NH3, PO4)
All sites of Tigris River for CL, F, NO3, NO2, NH3, PO4 were within the WHO standard for drinking Water and for CCME for aquatic life, listed in Table 2, which are represent in Figures 10-15. Most of the sites in Tigris River had SO4 concentrations exceeding the Permissible WHO standard as shown in Figure 16. The highest levels of SO4 were in southern part of the river at site (7 and 8) 354.17 mg/L, while the average concentration is 303.17 mg/L.
Chloride concentration in Figure 10 corresponded to EC. The lowest value of CL was 64.25 mg/L whereas the highest value was 100.92 mg/L. Chloride meeting the

Figure 7. Average TH. values in water sample.

Figure 8. Average Ca. values in water sample.

Figure 9. Average Mg. values in water sample.

Figure 10. Average CL values in water sample.

Figure 11. Average F. values in water sample.

Figure 12. Average NO3 values in water sample.

Figure 13. Average NO2 values in water sample.

Figure 14. Average NH3 values in water sample.

Figure 15. Average PO4 values in water sample.

Figure 16. Average SO4 values in water sample.
CCME standard for aquatic life was found in all sites except the site (6) which is located near the petroleum refinery of AD Dwara.
3.6. Heavy Metals (AL, Fe)
Total concentration of AL (mg/L) was detected in all Sites of Tigris River at a concentration lower than the WHO standard as shown in Figure 17. While Figure 18 shows that the lowest value of Fe (mg/L) is greater than the WHO standard. The average concentration of Al and Fe in Tigris River were 0.11 and 0.77 mg/L, respectively.
4. Conclusions
1) No Site in Tigris River meets the WHO drinking water standard; therefore it is not safe for human consumption.
2) According to the classification of water for irrigation as a dependent of EC and TDS, the water of the study area falls in the high saline category which causes damage to plants with low tolerance to salinity.
3) The general guidelines for classification of hardness water explain that most water in Tigris River is very hard.
4) All sites of Tigris River for CL, F, NH3, NO3, NO2, PO4 were within permissible limits as per WHO and CCME for aquatic life.
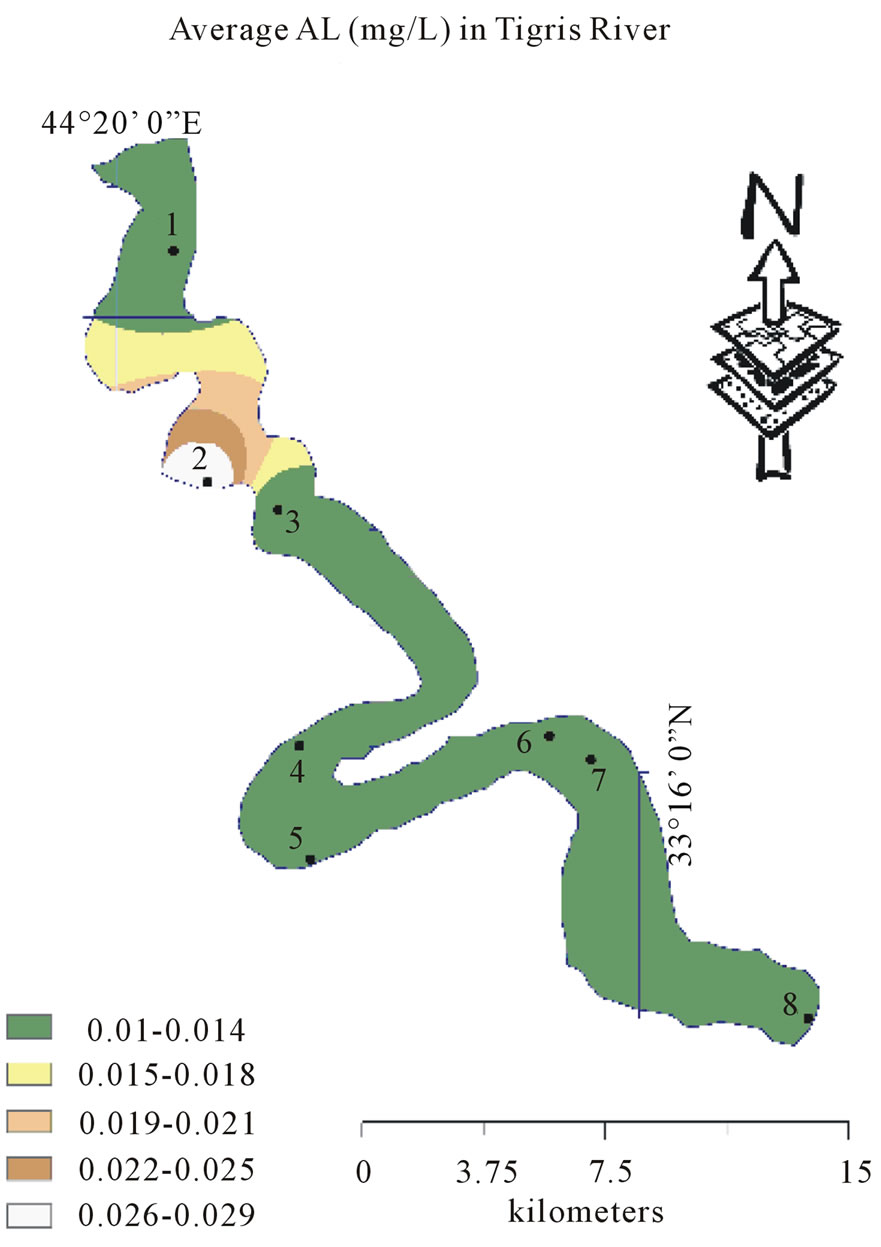
Figure 17. Average AL values in water sample.

Figure 18. Average Fe values in water sample.
5. Acknowledgements
The author gratefully acknowledges Prof. Abdul Hameed M. Jawad Alobaidy, director, Environmental Research Center, University of Technology, for his support and encouragement. Many thanks to Mr. Khalid H. R. ALGharrawi and Ms. Zahraa Zahraw for their efforts.
REFERENCES
- K. S. Kannan and V. Ramasubramanian, “Assessment of Fluoride contamination in Ground Water Using GIS, Dharmapuri District, Tamilnadu, India,” International journal of Engineering Science and Technology (IJEST), Vol. 3, No. 2, 2011, p. 1077.
- O. Altansukh and G. Davaa, “Application of Index Analysis to Evaluate the Water Quality of the Tuul River in Mongolia,” Journal of Water Resources and Protection, Vol. 3, No. 6, 2011, pp. 398-414. http://dx.doi.org/10.4236/jwarp.2011.36050
- R. C. Ferrier et al., “Water Quality of Scottish Rivers: Spatial and Temporal Trends,” The Science of the Total Environment, Vol. 265, No. 1-3, 2001, pp. 327-342. http://dx.doi.org/10.1016/S0048-9697(00)00674-4
- C. Neal, et al., “Water Quality of Treated Sewage Effluent in a Rural Area of the Upper Thames basin, Southern England and the Impacts of Such Effluents on Riverine Phosphorus Concentrations,” Journal of Hydrology, Vol. 304, No. 1-4, 2005, pp. 103-117. http://dx.doi.org/10.1016/j.jhydrol.2004.07.025
- H. P. Jarvie, C. Neal and P. J. A. Withers, “Sew-AgeEffluent Phosphorus: A Greater Risk to River Eutrophication than Agricultural Phosphorous?” Science of the Total Environmental, Vol. 360, No. 1-3, 2006, pp. 246- 253. http://dx.doi.org/10.1016/j.scitotenv.2005.08.038
- A. M. Rabee, B. M. Abdul-Kareem and A. S. Al-Dhamin, “Seasonal Variations of Some Ecological Parameters in Tigris River Water at Baghdad Region, Iraq,” Journal of Water Resource and Protection, Vol. 3, No. 4, 2011, pp. 262-267. http://dx.doi.org/10.4236/jwarp.2011.34033
- G. Burnham, R. Lafta, S. Doocy and L. Roberts, “Mortality after the 2003 Invasion of Iraq: A Cross-Sectional Cluster Sample Survey,” Lancet, Vol. 368, No. 9545, 2006, pp. 1421-1428.
- K. W. AL-Janabi, F. N. Alazawi, M. I. Mohammed, A. A. Kadhum and A. B. Mohamad, “Chlorophenols in Tigris River and Drinking Water of Baghdad, Iraq,” Bulletin of Environmental Contamination and Toxicology, Vol. 87, No. 2, 2011, pp. 106-112.
- APHA (Americans Public Health Association), “Standard Methods for Examination of Water and Wastewater,” 20th Edition, APHA, Washington DC, 1998.
- V. P. Singh and M. Fiorentino, “Geographic Information System in Hydrology,” Kluwer Academic Publishers, Dordrecht, 1996.
- Y. Saeedrashed and A. Guven, “Estimation of Geomorphological Parameters of Lower Zab River-Basin by Using GIS-Based Remotely Sensed Image,” Water Resources Management, Vol. 27, No. 1, 2013, pp. 209-219. http://dx.doi.org/10.1007/s11269-012-0179-x
- C. Childs, “Interpolation Surfaces in ArcGIS Spatial Analyst,” ESRI Education Services, 2004. www.seri.com
- WHO (World Health Organization), “Guidelines for Drinking Water Quality,” 3rd Edition, WHO, Geneva, 2006.
- Canadian Council of Ministries of the Environment (CCME), “Scientific Criteria Document for the Development of the Canadian Water Quality Guidelines for the Protection of Aquatic Life,” 2012. http://ceqg-rcqe.ccme.ca/
- Ministry of Environment, “System Maintenance of River and Public Water Pollution in Iraq,” 1998. http://www.moen.gov.iq
- J. Yisa and T. Jimoh, “Analytical Studies on Water Quality Index of River Land-zu,” American Journal of Applied Sciences, Vol. 7, No. 4, 2010, pp. 453-458.
- J. Camberato, “Irrigation Water Quality,” Clemson University, Clemson, 2001.
- B. Shomar, S. A. Fakher and A. Yahya, “Assessment of Groundwater Quality in the Gaza Strip, Palestine Using GIS Mapping,” Journal of Water Resource and Protection, Vol. 2, No. 2, 2010, pp. 93-104. http://dx.doi.org/10.4236/jwarp.2010.22011