Open Journal of Soil Science
Vol.4 No.4(2014), Article ID:45094,10 pages DOI:10.4236/ojss.2014.44018
Water Deficit Stress Effects on Corn (Zea mays, L.) Root:Shoot Ratio
J. G. Benjamin*, D. C. Nielsen, M. F. Vigil, M. M. Mikha, F. Calderon
Central Great Plains Research Station, USDA-ARS, Akron, USA
Email: *Joseph.Benjamin@ars.usda.gov
Copyright © 2014 by authors and Scientific Research Publishing Inc.
This work is licensed under the Creative Commons Attribution International License (CC BY).
http://creativecommons.org/licenses/by/4.0/


Received 4 March 2014; revised 4 April 2014; accepted 11 April 2014
ABSTRACT
A study was conducted at Akron, CO, USA, on a Weld silt loam in 2004 to quantify the effects of water deficit stress on corn (Zea mays, L.) root and shoot biomass. Corn plants were grown under a range of soil bulk density and water conditions caused by previous tillage, crop rotation, and irrigation management. Water deficit stress (Dstress) was quantified by the number of days when the water content in the surface 0.3 m deviated from the water content range determined by the Least Limiting Water Range (LLWR). Root and shoot samples were collected at the V6, V12, and R1 growth stages. There was no significant correlation between Dstress and shoot or root biomass at the V6 growth stage. At the V12 and R1 growth stages, there were negative, linear correlations among Dstress and both root biomass and shoot biomass. The proportional decrease of shoot biomass was greater than the proportional decrease in root biomass, leading to an increase in the root:shoot ratio as water deficit stress increased at all growth stages. Determining restrictive soil conditions using the LLWR may be useful for evaluating improvement or degradation of the soil physical environment caused by soil management.
Keywords:Shoot Ratio, Least Limiting Water Range, Water Stress, Corn Root Development, Soil Environment

1. Introduction
There are mixed reports in the literature on the effects of water deficit stress on crop production, and how different plants respond to water deficits by changing root:shoot ratios. Amos and Walters [1] summarized the effects of several soil environmental variables on corn root:shoot ratios. They found that the average root:shoot ratio varied from 0.68 at plant emergence to 0.16 at physiological maturity for unstressed plants.
Environmental stresses on the plant generally decreases both root growth and shoot growth. In field studies, Allmaras and Nelson [2] and Allmaras and Nelson [3] showed little difference in corn root distribution caused by differences in soil matric suction in a Nicollet soil in southwestern Minnesota, but the differences in matric suction were minimal among treatments. In their studies, the hydraulic head was greater than −40 kPa for all observations and only varied between −40 and −10 kPa during the two years of the study. Kondo et al. [4] measured a decrease in root:shoot ratio as corn experienced greater water stress. Gregory [5] concluded that dry soils induce plants to develop a more extensive root system and include deeper rooting, greater total weight, and greater total root length when compared with well-watered plants.
Water deficit and excessive soil strength are two factors that affect plant growth. In a growth chamber study using a silty clay loam soil, King and Greer [6] found that, at physiological maturity, a low water regime had no significant effects on root biomass but the plants had lower shoot growth compared with a fully watered regime. Calculations of soil environmental conditions from information given in the paper indicated that the plants were grown in a soil with a bulk density (ρb) of 0.61 g∙cm−3 and the initial volumetric water content (θv) was 0.35 cm3∙cm−3. Water stress was imposed by not replacing all the water transpired by the plant, but no specific θv measurements during the study were given in the report.
High soil ρb, an indicator of high soil strength, may also limit root growth. In a growth chamber study using a sandy loam soil, Tubeileh et al. [7] showed the effects of high soil ρb on root and shoot growth, even under adequate soil water conditions. In their study, both root growth and shoot growth were reduced due to higher soil ρb. Root growth decreased more, proportionately, to shoot growth so that they observed a 13% decrease in root:shoot ratio as ρb increased from 1.3 to 1.45 Mg∙m−3. Measurements of total CO2 assimilation were similar under both bulk densities. More of the assimilated CO2 was found in microbial biomass, indicating that the roots growing under high ρb exuded more of the C allocated to root by the plant.
It is difficult to quantify the response of root systems of many species to water deficit stress in the field because soil θv and soil strength are inexorably linked. One method to link plant growth with soil physical conditions is to define soil physical quality of a particular management scheme in terms of the Least Limiting Water Range (LLWR). The LLWR combines the soil physical conditions of soil water holding capacity, soil aeration, and soil strength into a numerical range that estimates the soil water contents that minimize physical limitations on plant growth [8] .
The objective of this study was to determine the effects of deficit water stress on corn root distribution, corn root surface area density, and root:shoot ratio using the LLWR as the criteria to evaluate water deficit stress.
2. Materials and Methods
The study was conducted at the USDA-ARS Central Great Plains Research Station near Akron, Colorado. The station lies at 40.15˚N lat and 103.15˚W long. The elevation of the station is 1384 m above mean sea level. The research station location is within a semi-arid climate with approximately 400 mm annual precipitation. The soil is a Weld silt loam (fine, smectitic, mesic Aridic Paleustolls). This soil has a silt loam Ap horizon from about 0 to 120 mm with fine granular structure. A silty clay loam Bt1 horizon with fine to medium subangular blocky structure extends from about 120 to 240 mm with a smooth boundary to a silty clay loam Bt2 horizon, also with fine to medium subangular blocky structure to about 410 mm. A silty clay loam Btk horizon with fine to medium subangular blocky structure extends to about 640 mm.
The irrigation-tillage-crop rotation experiment started in 2001. The experiment was organized as a split-plot design with three replications. The main plot was an irrigation treatment of either full irrigation or delayed irrigation. Irrigation treatments in 2001 to 2003 included a fully irrigated treatment that supplied water based on the evapotranspiration (ET) demand for the crop grown and a delayed irrigation treatment that used no irrigation during the vegetative portion of the growth cycle and then added irrigation water equivalent to the fully irrigated plots during the reproductive stage of the crop grown. All plots were fully irrigated in 2004.
Crop rotation and tillage subplots were randomized within the main irrigation plots. Two levels of tillage were used. A no-till (NT) system consisted of directly planting into the previous crop residues. A chisel tillage system (CT) consisted of a fall chisel plow operation 0.35 m deep with a parabolic shank deep ripper. The shanks on the ripper had 0.6-m centers. Chisel tillage was followed in the spring by one or two passes with a mulch treader to break up clods and smooth the soil surface in preparation for planting. Depth of operation of the mulch treader was approximately 50 mm. Two crop rotations were used in a factorial arrangement with tillage. One consisted of continuous corn production (CC). The other was a crop rotation (Rot) of red kidney bean (Phaseolus vulgaris L.) in 2001, spring barley (Hordeum vulgare L.) in 2002, sunflower (Helianthus annuus L.) in 2003 and corn in 2004. Details of the cropping history and management leading to the 2004 crop year are shown in Table 1. Plot size and machinery working widths are such that the wheel tracks for field operations follow a controlled wheel traffic pattern.
The least limiting water range was determined for this soil using the methods described in Benjamin, et al. [8] . The θv at field capacity was determined by removing undisturbed cores and placing the cores in individual water desorption chambers to equilibrate at 33 kPa pressure potential. Water content at wilting point was determined by placing disturbed samples in a pressure chamber equilibrated to 1500 kPa pressure potential. Measurements of cone penetration resistance, θv and ρb were made in each plot to determine the strength characteristics of the soil. Water contents defining the upper limit of the LLWR (θUL) and the lower limit of the LLWR (θLL) were determined for the range of ρb found in the field based on limitations of aeration, soil strength and water holding capacity.
Irrigation was applied to supplement natural rainfall. Irrigation was applied weekly based on evapotranspiration demand (Figure 1). Soil θv measurements were taken during the 2004 growing season with a neutron probe. Water measurements were taken from the center of a row at 0.3 m, 0.6 m, 0.9 m, 1.2 m, 1.5 m, and 1.8 m depths. Water content measurements were taken immediately before irrigation and as soon after irrigation as field entry was possible.
A simple method to quantify soil environmental stress experienced by the plant was used. The θUL and θLL for each sampling position were averaged across the row and also averaged for the 0 to 22.5 cm and 22.5 to 45 cm

Figure 1. Precipitation and irrigation amounts applied to all plots in 2004. Sampling dates for the V6, V12, and R1 growth stages are indicated by the arrows.

Table 1. Details of cropping history for rotations, 2003 to 2004.
depth increments. The θv at each measurement time during the growing season was determined to either lie within the LLWR or lie outside the LLWR. Each day that the soil θv in the 0 to 30 cm depth was outside the LLWR was considered one day of water stress. When θv for one water content measurement lay within the LLWR and the next θv lay outside the LLWR, a linear change in θv was assumed and the stress days were calculated accordingly. The days of stress were summed from planting until the date of sampling to determine the total number of days of soil physical stress (Dstress) experienced by the plant.
Soil samples to determine root distribution were collected at the V6 (June 30), V12 (July 26) and R1 (August 8) growth stages. Corn growth stages were determined from the description in Ritchie and Hanway [9] . A hydraulic probe with a sampling tube 75 mm in diameter and 1.125 m long was used for sampling. A corn plant was selected in the plot that had no wheel traffic on either side of the plant. The plant material was clipped level with the soil surface and removed before sampling. Any loose plant residue on the soil surface was also brushed away from the sampling site. The probe was positioned directly over the corn plant for sampling. A second probe taken in the same hole produced samples to a 1.8-m depth. Additional samples were taken 150 mm on each side of the same plant. Each core was sectioned into 0- to 0.225-, 0.225- to 0.45-, 0.45- to 0.675-, 0.675- to 0.9-, 0.9- to 1.125-, 1.125- to 1.35-, 1.35- to 1.575-, and 1.575- to 1.8-m lengths. The sample was weighed for ρb determination and a small subsample was removed to determine soil θv. The sample was then placed in a plastic, sealable bag and the bags placed in a polystyrene cooler for transport from the field. After each half day’s sample collecting, the samples were placed in refrigerated storage until washing the next day. Roots were washed from the soil cores and root surface area measurements were made using digital image analysis techniques as described in Benjamin and Nielsen [10] .
A subset of the root samples were used to determine root weight-root surface area relationships. Roots and debris were separated manually by placing the sample in a tray and examining the sample with the aid of a 3X lighted magnifier. All roots, including large primary roots, were included in the sample. Scans were made with an Agfa SnapscanTM E40 flatbed scanner at 118 pixels per cm (300 dpi). A grid overlay technique was used to determine root surface area [10] . After scanning, the roots were removed from the sample tray, dried and weighed.
Root surface area density (Rden, m2∙m−3) for each sampling position was calculated by:
 (1)
(1)
where Rsam is the total root surface area in the sample (m2) and Vsam is the sample volume (m3). The representative soil volume (Vrep) for each sample was considered to be 0.25 m wide, 0.225 m deep, and 1 m in length along the row. Total root surface area (Rpos) at each sample location was calculated by:
 . (2)
. (2)
Total roots per unit area (Rtot, m2∙m−1) was calculated by adding the root contents from the 24 sampling positions by
 (3)
(3)
where 1.33 converts the representative surface area of sampling to m2.
Four representative whole plants were collected at each root sampling time. The shoots were dried at 60˚C and weighed to give above-ground biomass production. Total average shoot density (TSavg) was calculated by
 (4)
(4)
where Savg is the average shoot weight per plant (kg), P is the plant population in each plot (plant∙m−2) and A is the area of land surface (m2).
An analysis of variance was conducted using a mixed statistical analysis in SAS. The F-test of main effect of irrigation was tested using the rep by irrigation error term. The F-test for interactions with irrigation was tested using the rep by interaction error term. Soil depth was treated as a repeated measure so the F-test for depth was determined using the rep by depth error term. The F-test for interactions with depth was tested using the rep by interaction error term. Least squares means were used to determine specific treatment differences when there was a significant F-test. Analyses of variance were conducted to determine irrigation, crop rotation, and tillage effects on total root density under a plant and root density in each layer. A protected LSD test was used to determine treatment differences. The LSD was used to distinguish treatment effects only if the F-test was significant at the 0.05 probability level. Regression analysis was used to correlate Dstress with root and shoot production.
3. Results
The plots receiving CT had lower ρb than the NT plots in the 0- to 0.225-m depth (Table 2), but not in the 0.225- to 0.45-m depth. Lower ρb in the CT plots was evident at all sampling times. The CT tillage had less root surface area in the 1.8 m soil profile than the NT plots at the V6 growth stage (Table 3), while previous irrigation or
Table 2. Tillage effects on bulk density (ρb) distribution. NT denotes the no till system and CT denotes the chisel tillage system. Means followed by the same letter within growth stage and depth increment are not significantly different at P = 0.05.
Table 3. Total root surface area in a 1.8 m soil profile for corn at V6, V12, and R1 growth stages as affected by previous irrigation history, previous cropping rotation and tillage system. Within each growth stage, treatment means followed by the same letter are not significantly different at the 0.05 probability level.
†The test for significance of previous irrigation effects on total roots used the irrigation × rep interaction for the error term, crop × irrigation effects were tested using the irrigation × crop × rep interaction for the error term and tillage × irrigation effects were tested using the irrigation × tillage × rep interaction for the error term.
previous crop had no significant effect on total root surface area. There was less root surface area with delayed irrigation at the V12 growth stage in the surface 1.8 m soil profile than the full irrigation, while tillage or previous crop had no significant effect on total root surface area. At the R1 growth stage, plots with the previous crop as sunflower had less root surface area than the CC plots, while previous irrigation or tillage had no significant effect.
Previous irrigation history and crop rotation resulted in different water environments in the 0- to 0.3-m depth for root growth during the 2004 growing season (Figure 2). The average initial water contents of Rot were approximately 0.04 m3∙m-3 less than the average water contents in the CC plots at the 0.3 m depth. As the growing season progressed, the treatment differences in θv decreased, but significant differences between Rot and CC continued throughout the growing season.
The combination of different ρb and water contents in the 0- to 0.3-m layer resulted in differences of Dstress during the growing season (Figure 3). Plants grown under conditions of Rot and delayed irrigation in 2003 had greater Dstress in 2004 at each sampling time than plants grown under conditions of CC and full irrigation in 2003, even though all plots were irrigated the same in 2004. Plants grown in plots with Rot with full irrigation in 2003 and CC with delayed irrigation in 2003 showed intermediate Dstress in 2004 compared with the other treatments.
The correlation between root weight and root surface area did not change due to growth stage of the crop (Figure 4). There was no difference in slope or intercept at the p = 0.05 level so all data were combined to estimate the relationship between root weight and surface area for subsequent analysis of root:shoot ratios.
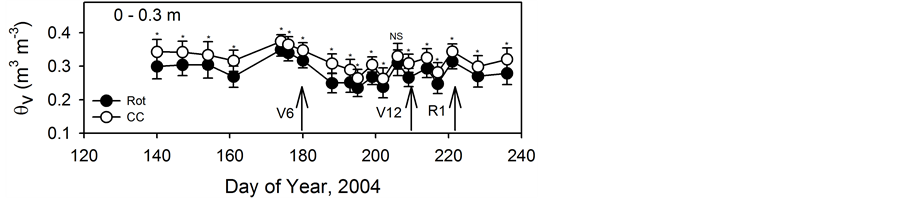
Figure 2. Mean soil volumetric water content (θv) in the 0- to 0.3-m depth interval during the growing season for the rotation (Rot) and continuous corn (CC) treatments. * indicates a significant difference between treatment means at p = 0.05. NS indicates no significant difference between treatment means at p = 0.05. Dates of sampling at the V6, V12, and R1 growth stages are indicated by the arrows.

Figure 3. Effects of multi-crop (Rot) and continuous corn (CC) rotations and delayed and full irrigation in 2003 on cumulative days of water stress (Dstress) in 2004. Dates of sampling at the V6, V12, and R1 growth stages are indicated by the arrows.

Figure 4. Correlation between measured root surface area and root weight for selected samples at the V6, V12, and R1 growth stages.
Root biomass was linearly correlated with Dstress at the V12 and R1 growth stages, but not at the V6 growth stage (Figure 5). The slope of the regression of root biomass to Dstress at the V6 growth stage was not significantly different (p = 0.22) from zero. The slope of the regression of root biomass to Dstress at the V12 growth stage was significantly different (p = 0.02) from the slope at the V6 growth stage and indicated a linear decline of root biomass as stress increased. The slope of the regression of root biomass to Dstress at the R1 growth stage was not significantly different (p = 0.75) from the slope at the V12 growth stage, however, the intercepts were different (p < 0.0001) as total root biomass increased with time.
Shoot biomass was linearly correlated with Dstress at the V12 and R1 growth stages, but not at the V6 growth stage (Figure 6). The slope of the regression of shoot biomass to Dstress at the V6 growth stage was not significantly different (p = 0.09) from zero. The slope of the regression of shoot biomass to Dstress at the V12 growth stage was significantly different (p = 0.003) from the slope at the V6 growth stage and indicated a linear decline of shoot biomass as stress increased. The slope of the regression of shoot biomass to Dstress at the R1 growth stage was not significantly different (p = 0.95) from the slope at the V12 growth stage, however, the intercepts were different (p = 0.004) as total shoot biomass increased with time.
The calculated root:shoot ratio declined as the plant developed (Figure 7). The root:shoot ratio for unstressed plants decreased from 0.5 at the V6 growth stage to 0.21 at the V12 growth stage, indicating more shoot growth relative to root growth at later growth stages. The lowest root:shoot ratio occurred at the V12 growth stage relative to the other measurement times. At the V12 growth state the root, shoot ratio was about 0.21 for unstressed plants and the root:shoot ratio increased slightly to 0.27 at the R1 growth stage.
The calculated root:shoot ratio increased as Dstress increased at all growth stages. The root:shoot ratio at the V6 growth stage increased from about 0.5 at no stress to 0.63 with 35 days of stress. The root:shoot ratio at the V12 growth stage increased from 0.21 for unstressed plants to 0.47 for plants with 55 days of stress. The root:shoot ratio at the R1 growth stage increased from 0.27 for unstressed plants to 0.47 for plants with 65 days of water stress.
4. Discussion
Many studies have shown that the root:shoot ratio of unstressed plants decreases as the plant develops. The root:shoot ratio of unstressed plants from this study was similar to those found by Allmaras et al. [11] , and Mengel and Barber [12] for field root studies on corn. In the Allmaras et al. [11] study, soil monoliths were excavated and whole root systems were extracted. No growth stage information was given in the paper, but the root:shoot ratio of 0.40 at 59 days after planting was similar to the 0.50 found in this study at the V6 growth stage. The root:shoot ratio of 0.25 at 73 days after planting was similar to the root:shoot ratio of 0.21 found at the V12 growth

Figure 5. Correlation between root biomass (RB) and days of water stress (Dstress) at the V6, V12, and R1 growth stages. Root biomass at the V6 growth stage was RB = 42.7 - 0.34 Dstress, r2 = 0.14. Root biomass at the V12 growth stage was RB = 135.6 - 1.58 Dstress, r2 = 0.69. Root biomass at the R1 growth stage was RB = 266.4 - 1.73 Dstress, r2 = 0.74.

Figure 6. Correlation between shoot biomass (SB) and days of water stress (Dstress) at the V6, V12, and R1 growth stages. Shoot biomass at the V6 growth stage was SB = 84.0 - 1.0 Dstress, r2 = 0.25. Shoot biomass at the V12 growth stage was SB = 135.6 - 9.8 Dstress, r2 = 0.72. Shoot biomass at the R1 growth stage was SB = 1014.0 - 10.6 Dstress, r2 = 0.64.
stage in this study. In the Mengel and Barber [12] study, no growth stage information was given except the date of the R1 growth stage. In the first year, the root:shoot ratio was 0.13 at 23 days after planting and 0.15 at 49 days after planting. The root:shoot ratio the second year was 0.64 at 34 days after planting and 0.40 at 42 days after planting. In this study, the root:shoot ratio at the V6 growth stage (40 days after planting) was 0.51. In the Mengel and Barber [12] study, the root:shoot ratio at the R1 growth stage was 0.10 the first year and 0.19 the second year. In this study, the root:shoot ratio was 0.26 at R1 for unstressed plants. Differences in soil temperature, corn hybrid, insect activity, or possible other reasons may account for differences in root:shoot ratios found among the studies.
There are few studies that measured the change of root biomass or shoot biomass under gradients of water deficit stress. Durieux et al. [13] measured about two thirds to one half the root weight in the surface 0.6 m from corn plants experiencing visual water stress symptoms than plants that indicated no water stress at the R1 growth stage. In this study, plants with long-term stress conditions, as indicated by days of water contents outside the

Figure 7. Calculated root:shoot ratios at the V6, V12, and R1 growth stages.
LLWR, had about 60% of the root biomass as unstressed plants, with a linear decline as water stress increased. Using Dstress as criteria for adverse soil environmental conditions appears useful for estimating the decline in both root and shoot growth.
Stress, as measured by Dstress, affected shoot growth and root growth to different degrees. Shoot growth was more affected by water deficit stress than root growth, leading to an increase in the root:shoot ratio. The percentage change of root:shoot ratio caused by Dstress was very similar among the growth stages, except for plants with high Dstress. At the V6 growth stage, the root:shoot ratio increased by 5% with 10 Dstress, by 11% with 20 Dstress and by 20% with 30 Dstress. At the V12 growth stage, the root:shoot ratio increased by 4% with 10 Dstress, by 10% with 20 Dstress, by 18% with 30 Dstress, but increased by 70% with 50 Dstress. At the R1 growth stage, the root:shoot ratio increased by 4% with 10 Dstress, by 9% with 20 Dstress, by 16% with 30 Dstress, and increased by 39% with 50 Dstress. Estimates of root biomass based on shoot biomass measurements may be more accurate if the changing root:shoot ratio caused by water deficit stress were considered.
These results are at odds with those of Kondo et al. [4] who showed a decrease of root:shoot ratio as water stress increased. The differences in the studies may lie in the way water stress was estimated. In the Kondo [4] study, water stress was imposed by limiting the amount of irrigation water to replenish water use by the crop. Water content measurements showed that there were differences in soil water matric potential between the two treatments, but the time the plant was under a specific stress was not noted. Using an estimate of the cumulative stress encountered by the plant by a means such as Dstress may improve our understanding of the effects of poor environmental conditions on plants.
5. Conclusion
This study showed a linear response of decreasing root growth and shoot growth to water deficit stress as indicated by days of water contents outside the LLWR. Shoot growth was proportionately more affected than root growth, leading to an increased root:shoot ratio as stress increased. The criteria for determining restrictive soil conditions defined by the LLWR may be useful for evaluating improvement or degradation of the soil physical environment caused by soil management. With rain fed agricultural management, soil management schemes that result in a larger LLWR have the potential for growing plants under soil water conditions that are less restrictive than soils with a smaller LLWR. Under irrigated management schemes, care should be taken to maintain soil water contents within the LLWR for the greatest root and shoot growth.
References
- Amos, B. and Walters, D.T. (2006) Maize Root Biomass and Net Rhizodeposited Carbon: An Analysis of the Literature. Soil Science Society of America Journal, 70, 1489-1503. http://dx.doi.org/10.2136/sssaj2005.0216
- Allmaras, R.R. and Nelson, W.W. (1971) Corn (Zea mays L.) Root Configuration as Influenced by Some Row-Interrow Variants of Tillage and Straw Much Management. Soil Science Society of America Journal, 35, 974-980. http://dx.doi.org/10.2136/sssaj1971.03615995003500060034x
- Allmaras, R.R. and Nelson, W.W. (1973) Corn Root-Configuration Response to Soil Temperature and Matric Suction. Agronomy Journal, 65, 725-730. http://dx.doi.org/10.2134/agronj1973.00021962006500050015x
- Kondo, M., Murty, M.V.R. and Aragones, D.V. (2000) Characteristics of Root Growth and Water Uptake from Soil in Upland Rice and Maize under Water Stress. Soil Science and Plant Nutrition, 46, 721-732. http://dx.doi.org/10.1080/00380768.2000.10409137
- Gregory, P.J. (2006) Roots and the Physico-Chemical Environment. In: Gregory, P.J., Ed., Plant Roots: Growth, Activity, and Interaction with Soils, Blackwell Publishing, Oxford, 131-173.
- King, K.M. and Greer, D.H. (1986) Effects of Carbon Dioxide Enrichment and Soil Water on Maize. Agronomy Journal, 78, 515-521. http://dx.doi.org/10.2134/agronj1986.00021962007800030025x
- Tubeileh, A., Groleau-Renaud, V., Plantureux, S. and Guckert, A. (2003) Effect of Soil Compaction on Photosynthesis and Carbon Partitioning within a Maize-Soil System. Soil and Tillage Research, 71, 151-161. http://dx.doi.org/10.1016/S0167-1987(03)00061-8
- Benjamin, J.G., Nielsen, D.C. and Vigil, M.F. (2003) Quantifying Effects of Soil Conditions on Plant Growth and Crop Production. Geoderma, 116,137-148. http://dx.doi.org/10.1016/S0016-7061(03)00098-3
- Ritchie, S.W. and Hanway, J.J. (1982) How a Corn Plant Develops. Special Report No. 48, Iowa State University of Science and Technology, Cooperative Extension Service.
- Benjamin, J.G. and Nielsen, D.C. (2004) A Method to Separate Plant Roots from Soil and Analyze Root Surface Area. Plant and Soil, 267, 225-234. http://dx.doi.org/10.1007/s11104-005-4887-3
- Allmaras, R.R., Nelson, W.W. and Voorhees, W.B. (1975) Soybean and Corn Rooting in Southwestern Minnesota: II. Root Distributions and Related Water Inflow. Soil Science Society of America Journal, 39, 771-777. http://dx.doi.org/10.2136/sssaj1975.03615995003900040046x
- Mengel, D.B. and Barber, S.A. (1974) Development and Distribution of the Corn Root System under Field Conditions. Agronomy Journal, 66, 341-344. http://dx.doi.org/10.2134/agronj1974.00021962006600030002x
NOTES

*Corresponding author.