Advances in Materials Physics and Chemistry
Vol. 2 No. 4 (2012) , Article ID: 25966 , 6 pages DOI:10.4236/ampc.2012.24032
Organometallic Titanium Oxides Obtained by Low-Pressure Plasmas of Water on Titanium Tetrapropoxide
1Departamento de Física, Instituto Nacional de Investigaciones Nucleares, Carretera México-Toluca, Ocoyoacac, México
2Departamento de Posgrado, Instituto Tecnológico de Toluca, Metepec, México
3Posgrado en Ciencia de Materiales, Facultad de Química, Universidad Autónoma del Estado de México, Toluca, México
Email: *guadalupe.olayo@inin.gob.mx
Received September 21, 2012; revised October 25, 2012; accepted November 9, 2012
Keywords: Particles; Titanium Oxide; Plasma; Synthesis; Titanium Tetrapropoxide
ABSTRACT
This work describes the synthesis of organometallic titanium oxides using low-pressure plasmas of water on titanium tetrapropoxide (TTP) in solid phase with glow discharges in the 0.3 - 0.9 mbar, 100 - 150 W and 60 - 240 min intervals. The accelerated particles in the plasma promoted chemical reactions which produced the partial separation of organic and inorganic parts of TTP with the consequent formation of TiO in organometallic films and particles with photosensitivity. These compounds could hardly be obtained by conventional chemical synthesis. The size of particles was calculated in the 50 - 414 nm interval. The elemental analysis of the titanium oxides indicates that the C/Ti and O/Ti atomic ratios are in the 0.63 - 0.54 and 1.89 - 1.96 intervals respectively, depending on the conditions of synthesis, which suggests that the organic residues are approximately half of the inorganic content. This proportion affects the X-ray diffraction of the organometallic compounds making them essentially amorphous; however, they may have overlapped arrangements resembling some faces of anatase, at 25.3˚ and 32.5˚, and rutile, at 43˚, phases. The electrical conductivity of TiO between 20˚C and 100˚C was from 10–10 to 10–12 S/m with activation energy in the 0 - 2.12 eV interval with 3 tendencies associated with temperature.
1. Introduction
Titanium oxide nanoparticles have been produced by solgel, hydrolysis, precipitation or micro-emulsion processes [1-4]. The syntheses are usually carried out in two stages: nucleation from the first chemical reactions with the precursor and growth in which agglomerations of molecules appear. Both can occur in one phase, usually liquid, or combined with vapor or solid phases. The resulting compounds are particles of Ti oxides and residues of the chemical reactions, which depend on the initial precursors. The choice of a precursor, organic or inorganic, to obtain TiO depends on the synthesis route. The most popular precursors are: Titanium tetrachloride (TiCl4), Titanium butoxide (IV) (Ti(OBu)4), Titanium acetyl acetonate (AAT), Titanium tetraisopropoxide (TTIP) and Titanium tetrapropoxide (TTP). The route used in the synthesis of TiO using TTIP is sol-gel, however, it has the disadvantage of needing long synthesis time.
Techniques using accelerated particles in plasmas may be an option for obtaining TiO in less time and with similar morphologies to those obtained by the traditional routes. Low energy plasmas have proven to be very active in the degradation of organic materials and in the formation of polymer nanoparticles with particle size between 35 and 350 nm [5]. On its part, high energy plasmas have been used in the preparation of TiO in amorphous or crystalline phases, as anatase and rutile. The morphology of TiO obtained by plasma has been mainly as partially crystalline thin films with O/Ti atomic ratios between 1.92 and 2.7 [6]. TiO coexists in crystalline and amorphous phases with surfaces up to approximately 79 m2×g−1 for crystalline states and up to 385 m2·g−1 in the amorphous phases [7]. The thermal stability can reach up to 900˚C, depending on the combinations of phases and on the organic content.
The superficial properties of TiO and its derivatives are related to its, intense white color, thermal stability and its ability to absorb and reflect an incident light. When absorbing light, the incident energy can be transferred to other materials on its surface through a photochemical potential. The photo-activity of TiO can be applied to oxidize molecules or to create free radicals or OH groups. This activity can be combined with the large active area of nanospheres to degrade molecules, in the sorption of pollutants [8,9] and in small-scale semiconductor devices [10-12].
In this context, this work has the objective of studying the synthesis of TiO particles with a TTP precursor in plasma glow discharges of water. This precursor is formed with Oxygen atoms around the Ti atom and chains of 3-C hydrocarbon segments attached to each O atom, see Figure 1(a). The accelerated ions in the plasma have the role of removing the organic part of TTP molecules, the 3-C chains, to leave the metal oxide fraction, O-Ti-O, see Figure 1(b). To do this, it is important to balance the synthesis conditions between particles and films.
2. Synthesis of TiO
The syntheses of TiO were made in a vacuum tubular glass reactor of 1500 cm3 with stainless steel flanges and electrodes, 6.5 cm diameter separated 8 cm, see Figure 2. The electric discharges were produced at 13.56 MHz with resistive coupling. TTP was spread on sample holders, frozen with liquid nitrogen and placed inside the reactor, between the electrodes. The degradation of TTP to produce TiO was obtained with water vapor plasmas.
The syntheses were made in the following intervals: 0.3 - 0.9 mbar, 100 - 150 W and 60 - 240 min. Depending on the electric field applied to the reactor, the particles ionize and accelerate in the plasma to form a rain of ions and electrons, which in similar experimental arrangements, the electronic density and energy have been calculated in the order of 108 part/cm3 and 15 eV, respectively [13,14]. In these conditions, the atomic bonds of
 (a)
(a) (b)
(b)
Figure 1. Illustration of collisions of plasma particles on TTP molecules. (a) TTP. TTP molecule. Ti is the central atom; the red circles around it are oxygen atoms. The branches are composed of 3-C hydrocarbon segments; (b) TTP and particles. A TTP molecule interacting with plasma particles. The smaller dots represent accelerated charged particles.
 (a)
(a) (b)
(b)
Figure 2. Images of the reactor used in the synthesis of TiO with glow discharges in resistive coupling. (a) Lateral view of the reactor, electrodes and glow discharge; (b) Sample holders with the precursor on the surface; see the position between the electrodes.
TTP molecules, whose energies do not exceed 10 eV, break in multiple points. This effect produces the partial separation of organic and inorganic parts of TTP with the consequent formation of TiO.
The inorganic fraction remains on the sample holder. The smallest organic molecules evaporate and leave the surface of the holders. However, the fragments react among them to form large complex molecules that are difficult to evaporate. No attempts were made to separate the TiO fraction from the organic components in the final products. For this reason, there are traces of the organic content in the TiO powder. This combination is studied calculating the O/Ti and C/Ti atomic ratios in the final products.
3. Results
3.1. Elemental Analysis
The elemental analysis of the organometallic TiO compounds synthesized with two different conditions was done by X-ray energy dispersive spectroscopy (EDS) with an Oxford 7279 probe coupled with a scanning electron microscope and is shown in Table 1. The elements of the analysis were C, O and Ti, see Figure 3. This analysis does not consider the participation of H atoms.
Comparing these numbers with the elemental content of the precursor, it was found that the percentage of C reduced almost 5 times, since the participation in the precursor was 70.6% and decreased to 15.6% in the final compounds. A similar analysis can be applied to the Ti content which increased about 5 times. On its part, the O content increased twice, however this number has the additional contribution of the water added to the synthesis.
These data suggest that in the process some small organic molecules are released, but that the rest remain with the Ti oxides in the final compounds. The C/Ti atomic ratio was reduced by approximately 20 times from the precursor, 11.98, to 0.63 and 0.54 in the final compounds. This ratio suggests that the organic residues are half of the inorganic content. On the other hand, the O/Ti atomic ratio was reduced from 4 in the precursor to 1.96 and 1.89 in the final compounds. These relationships are very close to the typical Ti oxide, 2, (TiO2).
3.2. Crystallography
Figure 3 shows the X-ray diffraction of TiO synthesized by plasma at 100 W and 60 min, the other conditions used generated similar diffraction patterns. The spectra

Table 1. EDS Atomic percentage of TiO powder. The participation of H was not considered.

Figure 3. Deconvoluted diffractogram of TiO powder synthesized by plasma at 100 W and 60 min. Lines labeled as A and R represent diffraction angles of Anatase and Rutile, respectively.
were performed on a Siemens D5000 diffractometer in the 2θ range between 10˚ and 55˚. The spectrum shows a large dispersion of data, in black, with a red line indicating the central tendency. The blue curves inside the central tendency represent deconvoluted patterns of the diffraction. In vertical lines, the plot has the position of the main diffraction angles of TiO2 crystalline phases: Rutile (R) (2θ = 27˚, 36˚, 41˚, 44˚) in dotted dark red lines, and Anatase (A) (2θ = 25˚, 33.5˚, 37˚, 48˚) in dashed green lines, to compare with the TiO diffraction of this work.
The spectrum has two amorphous tendencies, the first and widest has centroid at 27˚ and the second and smallest one has centroid at 43˚. Both angles are similar to two rutile diffraction angles. The wide interval of angles suggests that the material does not have dominant diffraction planes, but many small structures that diffract the incident beam in a large range of angles. As the material is formed with TiO and hydrocarbon structures, the TiO diffaction could be overlapped with the diffraction of the other organic contributors generating this amorphous scheme.
The general diffraction was decomposed into smaller regions to study if it is the sum of small individual diffractions of the known anatasa or rutile phases. The result is the interior blue curves, which indicates that the overall trend could be due to 3 internal diffractions with centroid at 25.3˚, 32.5˚ and 43.2˚ [15], FWHM = 12.4˚, 9.4˚ and 2.16˚, respectively. These centroids are close to the intense diffraction peaks corresponding to anatase, 25˚ and 33.5˚, and to rutile, 44˚. Note how the curves assigned to anatase are separated from that assigned to rutile suggesting separated phases.
However, the FWHM parameters indicate that the curves inside are too wide to be networks of pure Ti-O arrangements. One possibility is that the curves include both, Ti-O and Ti-O-C semi-ordered arrangements. Pure Ti-O arrangements generate intense diffraction peaks, but not Ti-O-C segments, which are part of the TTP structure used as precursor in this work. The crystallite size calculated with the Sherrer equation,  , for the deconvoluted segments with anatasa tendency is 6.35 Å.
3.3. Morphology
The material obtained in the synthesis is powder with small white particles and large agglomerates in the form of transparent glassy flakes. The materials were formed on the surface of the sample holders and on the inner reactor surface. Figure 4 shows 4 images of powder and agglomerates taken at 230× magnification. The images were taken with a Dino-Lite AMU13 digital microscope. Each image shows the same area but with different illumination. Materials absorb and/or reflect an incident electromagnetic beam with different intensity depending on its photo-sensitivity and wavelength.
In Figure 4(a) the powder was illuminated with visible light. It shows a dark background with white areas and semi-transparent regions with material of different composition. White areas contain the smallest particles. The organic fraction is composed of carbon and oxygen, so it tends to absorb an incident beam in the red and infrared region, see Figure 4(b) whose surface was illuminated with a red laser beam, 630 - 689 nm. The red light is partially absorbed by the organic fraction, enlightening comparatively the inorganic components, which are formed with Ti oxides.
However, as the wavelength reduces, other details of the sample appear. This can be seen in the photograph illuminated in the blue region, 403 nm. In the blue and ultraviolet region, the beam interacts with deeper electron orbitals revealing that some of the bright spots observed with the red illumination are spherical particles; see Figure 4(c). In the green laser lit photograph, 532 nm, the brightness is more intense and shows a combination of all the above areas, see Figure 4(d).
An important point to note is that the semitransparent flakes, bottom left of Figure 4(a) can only be observed with white light. Figure 5 shows 4 images of scanning electron microscopy of TiO synthesized in the 100 - 150 W interval during 240 min. The micrographs were obtained with a Jeol 5900 LV microscope. The images show films and agglomerates in several configurations of semispherical particles with diameters between 155 and 413 nm.
Figure 5(a) shows agglomerates of hemispherical particles with diameters between 155 and 191 nm joined in random groups. Monolayers of particles surfaces in two dimensions are shown in Figure 5(b). Irregular films of compacted stacked layers with apparent pore diameter below 500 nm can also be observed, see Figure 5(c). They were obtained at 240 min and 150 W.
3.4. Electric Conductivity
The electric conductivity was calculated measuring the resistance of TiO between two Cu electrodes with an OTTO MX-620 multimeter as a function of temperature in the 25˚C - 100˚C interval. The samples were heated to release humidity and low molecular weight residues originated in the synthesis. After that, the samples were left to cool in the atmosphere. The conductivity (σ) was calculated along both, the heating and cooling routes [16]. The electronic activation energy (Ea) was calculated with the linearized Arrhenius Equation (2) [17].
 (1)
(1)
 (2)
(2)
where k is the Boltzmann constant and T is absolute temperature.
 (a)
(a)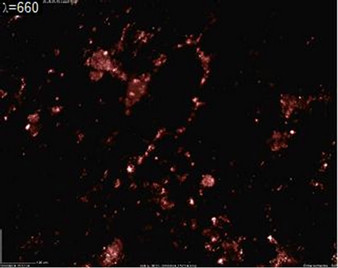 (b)
(b) (c)
(c) (d)
(d)
Figure 4. 230× magnification digital-optical photographs of TiO synthesized by resistive plasma. Note the different details that can be observed at each wavelength. (a) TiO illuminated with visible light; (b) TiO illuminated with a 660 nm laser; (c) TiO powder illuminated with a 403 nm laser; (d) TiO illuminated with a 532 nm laser.
 (a)
(a) (b)
(b) (c)
(c) (d)
(d)
Figure 5. Morphology of TiO obtained at: (a) and (b) 100 W and 240 min. (c) and (d) 150 W and 240 min. Note the variety of morphology due to the organometallic precursor. (a) Random agglomerates of semispherical particles; (b) Monolayers of agglomerates of particles; (c) Porous film with spherical particles of different diameter; (d) Closer view of porous and particles on the surface.
The global conductivity of TiO was calculated in the 10−12 - 10−10 S/m interval in which it has more than one tendency as a function of temperature, see Figure 6. The hysteresis of conductivity during the heating and cooling steps can be attributed to the influence of moisture and to the residual volatile organic content, which are released during the heating step, affecting the conductivity in the cooling segment. In these conditions, the values can be considered the volumetric intrinsic conductivity.
In the heating segment, conductivity increases from 10−11 to 10−10 S/m in the 25˚C - 45˚C interval with an Ea = 0.83 eV. The second tendency appears from 45˚ to 90˚C in which conductivity does not change significantly, Ea ≈ 0. This is the maximum conductivity of TiO, 8 × 10⁻¹⁰ S/m. After that, conductivity has a slow reduction to 4 × 10⁻¹⁰ S/m from 90˚C to 100˚C. After this point, without the influence of humidity during the cooling step, the intrinsic conductivity of TiO can be calculated.
During the cooling step, conductivity is practically constant, 3 × 10⁻¹⁰ S/m, between 100˚C and 80˚C with Ea ≈ 0. After this point, conductivity reduces to 7 × 10⁻¹¹ S/m at 47˚C with Ea = 0.37 eV. After that, conductivity reduces to 2 × 10⁻¹² S/m at 32.7˚C with a different tendency associated with Ea = 2.12 eV, which is the highest Ea for TiO. In the last step of this work, conductivity has another reduction with Ea = 1.01 eV.
From a global point of view, TiO behaves as an insulator because of its level of conductivity, but considering the electronic activation energy, TiO behaves as a semiconductor with Ea depending on temperature, from approximately 0 to 2.12 eV. One important change of tendency happens at 47˚C which is remarkably noted during both, heating and cooling steps. At higher temperatures, Ea reduces to practically 0. This behavior suggests a combination of thermally activated mechanisms.

Figure 6. Conductivity in the Arrhenius scheme and activation energy of TiO. Right y-axis and upper x-axis are approximated.
In other titanium oxide flakes, the electrical conductivity thermally activated at 300˚C was calculated as 10−6 S/m, with activation energy of 0.87 eV [18]. In TiO films, conductivity was calculated as 10−9 S/m with activation energy in the 0.76 - 1.55 eV interval [19]. The combination of organic compounds may reduce the conductivity of the TiO powder obtained in this work.
4. Conclusions
Titanium oxides were synthesized with glow discharge plasmas of water and titanium tetrapropoxide obtaining films and agglomerates of particles in organometallic compounds resulting from the degradation of TTP. The particles have spherical geometry with diameters between 50 and 414 nm grouped in random and mono-layered arrangements of several micrometers. The films had a porous morphology with apparent diameters below 500 nm.
Both, films and particles absorb and/or reflect light with different wavelength indicating photo-sensitivity. It is known that crystalline TiO compounds present photosensitivity based on alternated Ti-O sequences in 3D networks, however, this effect can also be reached with different magnitude in organometallic compounds like those of this work.
The C/Ti atomic ratio was used to reflect the participation of the organic and metallic fractions. C/Ti was 12 in TTP, indicating a great organic content, and reduced to 0.63 and 0.54 in the final compounds, suggesting that the organic fraction reduced to approximately half of the inorganic content. On the other hand, the O/Ti atomic ratio was reduced from 4 in the precursor to 1.96 and 1.89 in the final compounds, indicating that this ratio was less affected than C/Ti. O/Ti is very close to the typical ratio (2) in TiO2 crystalline oxides. However, the diffraction pattern of organometallic TiO does not have dominant planes, but two amorphous tendencies with centroids at 27˚ and 43˚. Both angles are similar to two rutile diffraction angles. The first amorphous diffraction was decomposed in two interior curves with centroids near positions where anatase phase diffracts, 25.3˚ and 32.5˚ respectively. These results suggest that the organometallic TiO overlapped amorphous pattern has arrangements that resemble some planes of anatase and rutile phases separately.
The electrical conductivity of plasma TiO was in the 10−10 - 10−12 S/m interval with activation energy between practically 0 to 2.12 eV with 3 tendencies in the 20 - 100˚C interval showing that as temperature increases, the activation energy decreases. The electronic activation energy locates the TiO obtained in this work in the semiconductor materials with thermally activated mechanisms.
5. Acknowledgements
The authors acknowledge DGEST for the partial financial support to this work with the projects 004-09-02-PIA and 3402.10-P, and to CONACYT with the projects 130190 and 154757 and to Jorge Perez for the assistance in the electron microscopy analysis. F. Gonzalez acknowledges also CONACYT for the M.S. fellowship received to carry out this work.
REFERENCES
- H. Porthault, F. Le Crasa and S. Franger, “Synthesis of LiCoO2 Thin Films by Sol/Gel Process,” Journal of Power Sources, Vol. 195, No. 19, 2010, pp. 6262-6267. doi:10.1016/j.jpowsour.2010.04.058
- C. Jin, R. Y. Zheng, Y. Guo, J. L. Xie, Y. X. Zhu and Y. C. Xie, “Hydrothermal Synthesis and Characterization of Phosphorous-Doped TiO2 with High Photocatalytic Activity for Methylene Blue Degradation,” Journal of Molecular Catalysis A: Chemical, Vol. 313, No. 1-2, 2009, pp. 44-48. doi:10.1016/j.molcata.2009.07.021
- R. Kripal, A. K. Gupta, S. K. Mishra, R. K. Srivastava, A. C. Pandey and S. G. Prakash, “Photoluminescence and Photoconductivity of ZnS:Mn2+ Nanoparticles Synthetized via Co-Precipitation Method,” Spectrochimica Acta, Part A, Molecular and Biomolecular Spectroscopy, Vol. 76, No. 5, 2010, pp. 523-530. doi:10.1016/j.saa.2010.04.018
- L. Chen, K. Rahme, J. D. Holmes, M. A. Morris and N. K. H. Slater, “Non-Solvolytic Synthesis of Aqueous Soluble TiO2 Nanoparticles and Real-Time Dynamic Measurements of the Nanoparticle Formation,” Nanoscale Research Letters, Vol. 7, No. 1, 2012, pp. 276-297. doi:10.1186/1556-276X-7-297
- G. J. Cruz, M. G. Olayo, O. G. Lopez, L. M. Gomez, J. Morales and R. Olayo, “Nanospherical Particles of Polypyrrole Synthesized and Doped by Plasma,” Polymer, Vol. 51, No. 19, 2010, pp. 4314-4318. doi:10.1016/j.polymer.2010.07.024
- R. Valencia, R. Lopez, S. R. Barocio, A. Mercado, R. Peña, A. Muñoz, E. A. de la Piedad and J. M. de la Rosa, “TiO2 Films in the Rutile and Anatase Phases Produced by Inductively Coupled RF Plasmas,” Surface & Coatings Technology, Vol. 204, No. 18-19, 2010, pp. 3078- 3081. doi:10.1016/j.surfcoat.2010.02.059
- F. Gonzalez-Salgado, M. G. Olayo, G. J. Cruz and L. M. Gomez, “Synthesis of Titanium Oxide Nanoparticles by Plasma,” Superficies y Vacio, Vol. 25, No. 1, 2012, pp. 56-59.
- R. Szabova, L. Cernakova, M. Wolfova and M. Cernak, “Coating of TiO2 Nanoparticles on the Plasma Activated Polypropylene Fibers,” Acta Chimica Slovaca, Vol. 2, No. 1, 2009, pp. 70-76.
- S. Pavasupree, S. Ngamsinlapasathian, M. Nakajima, Y. Susuki and S. Yoshikawa, “Synthesis, Characterization, Photocatalytic Activity and Dye-Sensitized Solar Cell Performance of Nanorods/Nanoparticles TiO2 with Meso Porous Structure,” Journal of Photochemistry Photobiology A: Chemistry, Vol. 184, No. 1-2, 2006, pp. 163-169. doi:10.1016/j.jphotochem.2006.04.010
- Y. Xiaodan, W. Qingyin, J. Shicheng and G. Yihang, “Nanoscale ZnS/TiO2 Composites: Preparation, Characterization, and Visible-Light Photocatalytic Activity,” Materials Characterization, Vol. 57, No. 4-5, 2006, pp. 333-341. doi:10.1016/j.matchar.2006.02.011
- D. L. Liao, G. S. Wu and B. Q. Liao, “Zeta Potential of Shape-Controlled TiO2 Nanoparticles with Surfactants,” Colloids Surfaces A, Physicochemical and Engineering Aspects, Vol. 348, No. 1-3, 2009, pp. 270-275. doi:10.1016/j.colsurfa.2009.07.036
- S. H. Lin, C. N. Chen and R. S. Juang, “Structure and Thermal Stability of Toxic Chromium(VI) Species Doped onto TiO2 Powders through Heat Treatment,” Journal of Environmental Management, Vol. 90, No. 5, 2009, pp. 1950-1955. doi:10.1016/j.jenvman.2008.12.013
- M. G. Olayo, J. Morales, G. J. Cruz, R. Olayo, E. Ordonez and S. R. Barocio, “On the Influence of Electron Energy on Iodine-Doped Polyaniline Formation by Plasma Polymerization,” Journal of Polymer Science, Part B: Polymer Physics, Vol. 39, No. 1, 2001, pp. 175- 183. doi:10.1002/1099-0488(20010101)39:1<175::AID-POLB160>3.3.CO;2-R
- M. G. Olayo, J. Morales, G. J. Cruz, S. R. Barocio and R. Olayo, “Numerical and Experimental Analysis of the Plasma in the Synthesis of Polyaniline,” Journal of Polymer Science, Part B: Polymer Physics, Vol. 41, No. 13, 2003, pp. 1501-1508. doi:10.1002/polb.10493
- J. M. Hernandez, L. A. Garcia and B. H. Zeifert, “Sintesis y Caracterizacion de Nanoparticulas de N-TiO2-Anatasa,” Superficies y Vacio, Vol. 21, No. 4, 2008, pp. 1-5.
- J. Morales, M. G. Olayo, G. J. Cruz and R. Olayo, “Synthesis by Plasma and Characterization of Bilayer AnilinePyrrole Thin Films Doped with Iodine,” Journal of Polymer Science Part B: Polymer Physics, Vol. 40, No. 17, 2002, pp. 1850-1856. doi:10.1002/polb.10254
- J. Morales, M. G. Olayo, G. J. Cruz, M. M. CastilloOrtega and R. Olayo, “Electronic Conductivity of Pyrrole and Aniline Thin Films Polymerized by Plasma,” Journal of Polymer Science Part B: Polymer Physics, Vol. 38, No. 24, 2000, pp. 3247-3255. doi:10.1002/1099-0488(20001215)38:24<3247::AID-POLB60>3.0.CO;2-U
- R. Asmatulu, A. Karthikeyan, D. C. Bell, S. Ramanathan and M. J. Aziz, “Synthesis and Variable Temperature Electrical Conductivity Studies of Highly Ordered TiO2 Nanotubes,” Journal of Materials Science, Vol. 44, No. 17, 2009, pp. 4613-4616. doi:10.1007/s10853-009-3703-5
- M. Stamate, G. Lazar and I. Lazar, “Dimensional Effects Observed for the Electrical, Dielectric and Optical Properties of TiO2 DC Magnetron Thin Films,” Journal of Materials Science: Materials in Electronics, Vol. 20, No. 2, 2009, pp. 117-122. doi:10.1007/s10854-008-9644-y
NOTES
*Corresponding author.