 Journal of Behavioral and Brain Science, 2013, 3, 137-149 http://dx.doi.org/10.4236/jbbs.2013.31013 Published Online February 2013 (http://www.scirp.org/journal/jbbs) Qualitative Comparison between Rats and Humans in Quadrupedal and Bipedal Locomotion Taisei Hosoido1, Futoshi Mori2*, Keita Kiyoto2, Takashi Takagi2, Yukari Sano2, Megumi Goto2, Katsumi Nakajima3, Naomi Wada2 1Osaka Veterinary Referral Center, Osaka, Japan 2Laboratory of Veterinary System Science, Yamaguchi University, Yamaguchi, Japan 3Department of Physiology, Kinki University School of Medicine, Osaka-Sayama, Japan Email: *morif@yamaguchi-u.ac.jp Received December 10, 2012; revised January 10, 2013; accepted January 17, 2013 ABSTRACT Bipedal (Bp) locomotion is one of the most characteristic motor behaviors in human beings. Innate quadrupedal (Qp) four-legged animals also often walk bipedally. The walking posture, however, is significantly different between the two. This suggests that although both hav e a potential to walk bipedally, however, the human has a body scheme suitable for Bp locomotion, probably its sk eletal system. The skeletal system includes the lumbar lordosis, sacral kyphosis, a round pelvis, a large femur neck angle, short feet, and so on. To verify this hypoth esis, we compared kinematic and EMG ac- tivities between rats and humans during Qp and Bp locomotion on a treadmill belt. The rat is a representative Qp animal, but it is able to acquire Bp walkin g cap ability with motor learning. Although th e mobile ranges of th e hind limb jo int are different during each locomotor pattern between rats and humans, both showed replicable flexion and extension excur- sion patterns fo r each joint depending on the locomotor phase. There are many phase-locked EMG bursts between rats and humans during the same walking task and these are observed in the proximal rather than the distal muscles. This suggests that both rats and humans utilize similar neuronal systems for the elaboration of Qp and Bp locomotion. It was interesting that both subjects showed more muscle activities during non-natural locomotor patterns; Qp < Bp for rats and Bp < Qp for humans. This indicates that rat Bp and human Qp walking need more effort and we may be able to find its reason in their skeletal system. Keywords: Human; Rat; Evolution; Posture; Locomotion; Bipedal; Quadrupedal 1. Introduction Most terrestrial vertebrates walk with the limbs on the ground and terrestrial locomotion can be divided into quadrupedal (Qp) and bipedal (Bp) locomotion. The ma- jority of mammals walk quadrupedally, while humans walk bipedally. As Aristotle and Darwin showed, the up- right standing posture and Bp walking are the most basic and essential features of human beings. For this, we have developed a unique skeletal system including the lumbar lordosis, sacral kyphosis, a round pelvis, large femur neck angle; short feet, and so on. The lumbar lordosis in humans is a critical component in the ability to achieve upright and bipedal locomotion [1]. It is shown that such skeletal adaptation suitable for human like Bp walking was evolved relatively recent [2]. As a result, humans are a unique mammal that can adapt their Bp walking pat- terns to the various walking circumstances. However, many other innate Qp four-legged animals (Qp animals) can also stand upright and walk bipedally without the skeletal characteristics observed in humans. Bears and even cats and dogs can stand on their hindlimbs and walk bipedally if trained for a circus attraction. It is also well known that some species of genetically Qp nonhuman primates walk bipedally in the wild. In this sense, the Bp locomotion itself is by no means limited to humans or some nonhuman primates. What are the triggers for bipedalism? During Qp walk- ing, the forelimbs are needed. Therefore, Qp animals sup- port their body weight, maintain body balance and pro- duce propulsive force with their limbs. Ho wever, Qp ani- mals often use their forelimbs not only for the execution of locomotion, but also for other purposes. These include gripping and collecting food, hanging from branches, digging up soil to find food and nestin g. These functio nal usages of the forelimb may have already existed when mammals appeared on the earth (Jurassic period) and reinforced the different functional roles between fore- limbs and hindlimbs. The functional differences are often *Corresponding a uthor. C opyright © 2013 SciRes. JBBS  T. HOSOIDO ET AL. 138 observed in the morphology. In this sense, one can easily observe skeletal differences between forelimbs and hind- limbs in the most primitive mammals, Monotr emes , on earth. These are also observed in other relatively old mammals such as the Insectivora and Marsupials. For further development of such specific forelimb function, the forelimbs must be freed from locomotion by standing up. It has been considered that human beings evolved from Qp animals. Because locomotor control mainly consists of skeletomuscular and neuronal systems in both Qp mammals and Bp human, the evolutional transition from Qp to Bp walking may be primarily found in the changes in these systems [3]. Human infants start walking quad- rupedally and then acquire stable Bp capability as they grow up. One possible reason why the walking pattern of human infants smoothly transfers from Qp to Bp walking is that the infants already have a skeletomuscular sys- tem suitable for Bp walking at birth. It is interesting that infants develop lordo sis around th e time that they acquire bipedal locomotion. Furthermore, the facts described above suggest that reorganization of the central nervous system (CNS) for bipedalism is not essentially required at birth in human beings. Moreover, nonhuman primates including chimpanzees cannot fully extend their hip and knee joints when they walk bipedally, and have a “bent- hip and bent-knee” walking posture [4]. This is because the skeletal structure around their ischia is not adequate for full extension of the hip joint. These observations strongly suggest th at innately Qp mammals d o not have a skeletal system suitable for the elaboration of Bp walking, but use a inherent neuronal system similarly for both Qp and Bp locomotion. However, the defining factor in the shift from Qp walking to Bp walking remains to be elu- cidated. Here, we test the hypothesis that four legged mammals and humans have their similar inherent neu- ronal systems for the elaboration of both Qp and Bp walking. To do this, we compared their kinematic char- acteristics and recorded electromyographic activities from different types of muscles during Qp and Bp walking. Rats are originally Qp animals, but we had showed that they are able to acquire Bp walking capability by train ing [5]. 2. Materials and Methods 2.1. Subjects Twenty-five rats, of both sexes were used and 5 healthy male, human subjects with no history of motility disor- ders volunteered for this study. We established rat Bp walking model (RBWM) to study the neuronal control mechanisms of Bp walking and the effects of Bp walking on the central nervous system [5,6]. One of the charac- teristic features in our model is that the forelimbs, which are often amputated when establishing a Bp animal mo- del, were preserved. The detailed bipedal training method was described elsewhere [5]. Briefly, 3 weeks after birth, the rats were housed in a large rectangular glass contai- ner that required them to use an upright posture to reach water for 2 to 3 week s. Water was provided throu gh drip bottles that were placed on the top of the container. Then, they began training using a bipedal-walking training de- vice. This device moves the drip bottle at a constant speed, and the rat follo ws the bottle to obtain water while maintaining an u pright posture. Each rat underwent train- ing for 30 mins/day and 7 days/week for at least 3 months . Water was given to the rats from the drip bottle installed on the bipedal-walking training device or treadmill dur- ing the training periods. All procedures confirmed to the guidelines of the Animal and Human Investigation Com- mittee and the Ethics Committee at Yamaguchi Univer- sity. Informed, written consent was obtained from each human subject. The experiments were performed accord- ing to the Declaration of Helsinki. 2.2. Behavioral Task and Data Analysis 2.2.1. Qp and Bp Wal k ing Tasks The RBWM and humans participated in the following two walking tasks. Qp walking: Both RBWM and human subjects walk ed on the treadmill belts quadrupedally at a comfortable speed for at least one minute. Each collection consisted of 5 - 10 stable consecutive strides as a minimum number. For humans, all subjects were instructed to walk on their hands and feet and were given time to adapt to this Qp walking pattern on the treadmill belt before recording. Bp walking: Both subjects walked on a treadmill belt bipedally at a comfortable speed for at least a half minute. In RBWM, each collection consisted of at least 3 - 5 sta- ble consecutive strides as a minimum number. For hu- man subjects, all subjects were given time to adapt their Bp walking on the treadmill belt before recording. 2.2.2. D ata Recordi ng The right side lateral views of the Qp and Bp walking in both RBWM and humans were recorded using a high speed video-camera with sampling rates of 200 f/s (HAS- 220) and 2000 - 1000 f/s, respectively. These frames were captured and stored on a computer and used for fur- ther analyses (Movias Pro, NAC, Japan). Prior to all re- cording sessions, circle markers were placed on each rat and human’s skin at the vertebrae at L3 (a), hip (b), knee (c), ankle (d), and metatarsal joints (e), and the hip, knee, and ankle joints were defined as follows, hip joint: angle a-b-c, knee joint: angle b-c-d, ankle joint: angle c-d-e (Figure 1). Copyright © 2013 SciRes. JBBS  T. HOSOIDO ET AL. Copyright © 2013 SciRes. JBBS 139 a a a a d e e c d e d e d c c c A-1 B-1 B-2 A-2 2.2.3. Data Analysi s Stick figures, which connected the circle marks on the skin and eye, ear and toe, were made from each frame. From these images, the onsets of swing (SW) and stance (ST) phases were determined by visual inspection. The hip, knee, and ankle joints were measured for the angle excursion graphs and angle-angle cyclographs. Raw ki- nematic data were averaged for ~10 step cycles. EMG data were synchronized with a high speed camera using a 200 Hz signal. Raw EMG bursts were rectified and aver- aged for 10 - 15 step cycles and averaged EMG wave- forms were made for each muscle to compare the EMG activity patterns to the locomotor cycle. EMGs recorded from humans were also rectified and averaged. The an- gular excursion graphs and the duration of EMG bursts were demonstrated as % of cycle; onset of the SW phase (=0%) and termination of the ST phase of the right hind- limb (=100%). To detect commonly observed EMG ac- tivity patterns between Qp and Bp in a single subject, and between RBWM and humans for the same walking pat- tern, the qualitative EMG comparison was made. For this, we focused mainly on the temporal component such as the onset and/or the duration of EMG activity during a step. Figure 1. The position of circle markers and joint angles of RBWM (A) and humans (B) during Qp (1) and Bp (2) walking. The arrows indicate the position of the virtual COG and its direction. Electromyographic (EMG) activity was recorded with video recordings. For RBWM, 6 paired bipolar wire electrodes (AM Systems Inc, USA) with 0.5 - 1.0 mm recorded area were implanted into muscles on both sides from the Longissimus lumborum (L) at L1-3, the gluteus medius (Gm), the rectus femoris of the quadriceps (Q), the semitendinosus of the Hamstring (H), the lateral head of the gastrocnemius (Gs), and the tibialis anterior (TA) under anesthesia with Ketamin-HCl (initial injection: 40 - 60 mg/kg, additional injections: 15 - 25 mg/kg/h) or Isoflurane mixed with oxygen gas. The position of the EMG electrodes was confirmed by electrical stimulation of the appropriate electrodes. The wire electrodes were connected with bio-amplifiers via a cable and amplified (30 - 3000 KHz, ×2000; Nihon Koden, Japan). In hu- mans, the EMGs were recorded from the same muscles as those recorded in the rats. EMG bursts were recorded using bipolar surface electrodes placed on the skin (Ni- hon Koden, Japan). In both RBWM and human subjects, EMGs during Qp and Bp walking were recorded alter- nately in a same recording session. 3. Results Both RBWM and humans could walk seamlessly on the treadmill belt. Figures 2 and 3 show serial drawings of a single step cycle of Qp and Bp walking in RBWM and humans, respectively. The tail of RBWM was not drawn in Figure 2. 3.1. Angular Changes at the Hip, Knee and Ankle Joints in RBWM and Human Figure 4 shows representative serial angular excursions during three step cycles in the hip, knee and ankle joints of RBWM (A) and humans (B) during Qp (1) and Bp (2) walking on a level treadmill belt. All three joints in both RBWM and humans showed replicable across step cycles, but the angular excursion graphs of the same joint in the two grou ps were quite d i ff erent. 1 2 3 4 5 6 7 8 A 1 2 3 4 5 6 7 8 B Figure 2. Seri al drawings of Qp (A) and Bp (B) walking in RBWM during a single step cycle. The numbers on each drawin g indicate the order of the steps.  T. HOSOIDO ET AL. 140 1 2 3 4 5 6 7 8 A 1 2 3 4 5 6 7 8 B Figure 3. Serial drawings of Qp (A) and Bp (B) walking in human subjects during a single step cycle. The numbers on each drawing indicate the order of the steps. A-1 A-2 B-1 (deg) (deg) (deg) B-2 hip knee ankle 180 150 120 90 60 rH 180 150 120 90 60 rH Figure 4. Repr esentative three step cycl e angular changes in hip, knee and ankle joints in RBWM (A) and humans (B) during Qp (1) and Bp (2) walking. Gait diagrams of the right hindlimb are shown at the bottom of each graph; the swing phase is shown by white bars and stance phase by gr ay bar s. 3.1.1. Qp Wa lking in RBWM (Figure 4A-1) Hip joint showed smoo th flexion and ex tension tran sition during a single step cycle. The maximum flexion and ex- tension were observed during the early and late ST phase, respectively. The mean mobile range of this joint was about 75˚ - 90˚. From the initiation of the SW phase, knee joint continued to move toward extension until the transition period to ST phase and showed maximum ex- tension. It then moved toward flex ion until the end of the ST phase. The mean mobile range of this joint was ab out 50˚ - 100˚. Ankle joint had a wider mobile range than other two joints throughout the single step cycle. From the late SW phase, this joint moved toward extension until the early ST phase. Th en, it flex ed fo r a short period and again moved toward extension until the late part of the ST phase, making two humps at the beginning (small) and the late part (large) of the ST phase, after which it started to flex toward the SW phase. The mean mobile range of this joint was about 50˚ - 105˚. 3.1.2. Qp Walking in Human (Figure 4B-1) From the end of SW phase, hip joint moved toward ex- tension until the end of the ST phase, making a small hump at the beginning of this phase. It then rapidly flexed until the end of SW. The mean mobile range of this joint was 80˚ - 150˚. Knee joint showed a basically similar angular excursion pattern to that of the hip joint. The maximum flexion and extension of this joint were observed at the mid to late SW phase and at the late ST phase, respectively, and these appeared earlier than those of the hip. At the end of the ST phase, it started quick flexion until the mid SW. The mean mobile ran ge of this joint was about 80˚ - 145˚. Ankle joint moved through a single step cycle similar to that during Bp walkin g. There were two humps, i.e., a small one at the early and a large one at the late phase of ST, and these were similarly ob- served in RBWM Qp walking. Between these humps during the ST phase, this joint first moved toward flexion until the mid ST phase an d then extend ed until the end of the ST phase. The mean mobile range of this joint was about 85˚ - 110˚. 3.1.3. Bp Walking in RBWM (Figure 4A-2) Hip joint showed a small range of movement during a Copyright © 2013 SciRes. JBBS 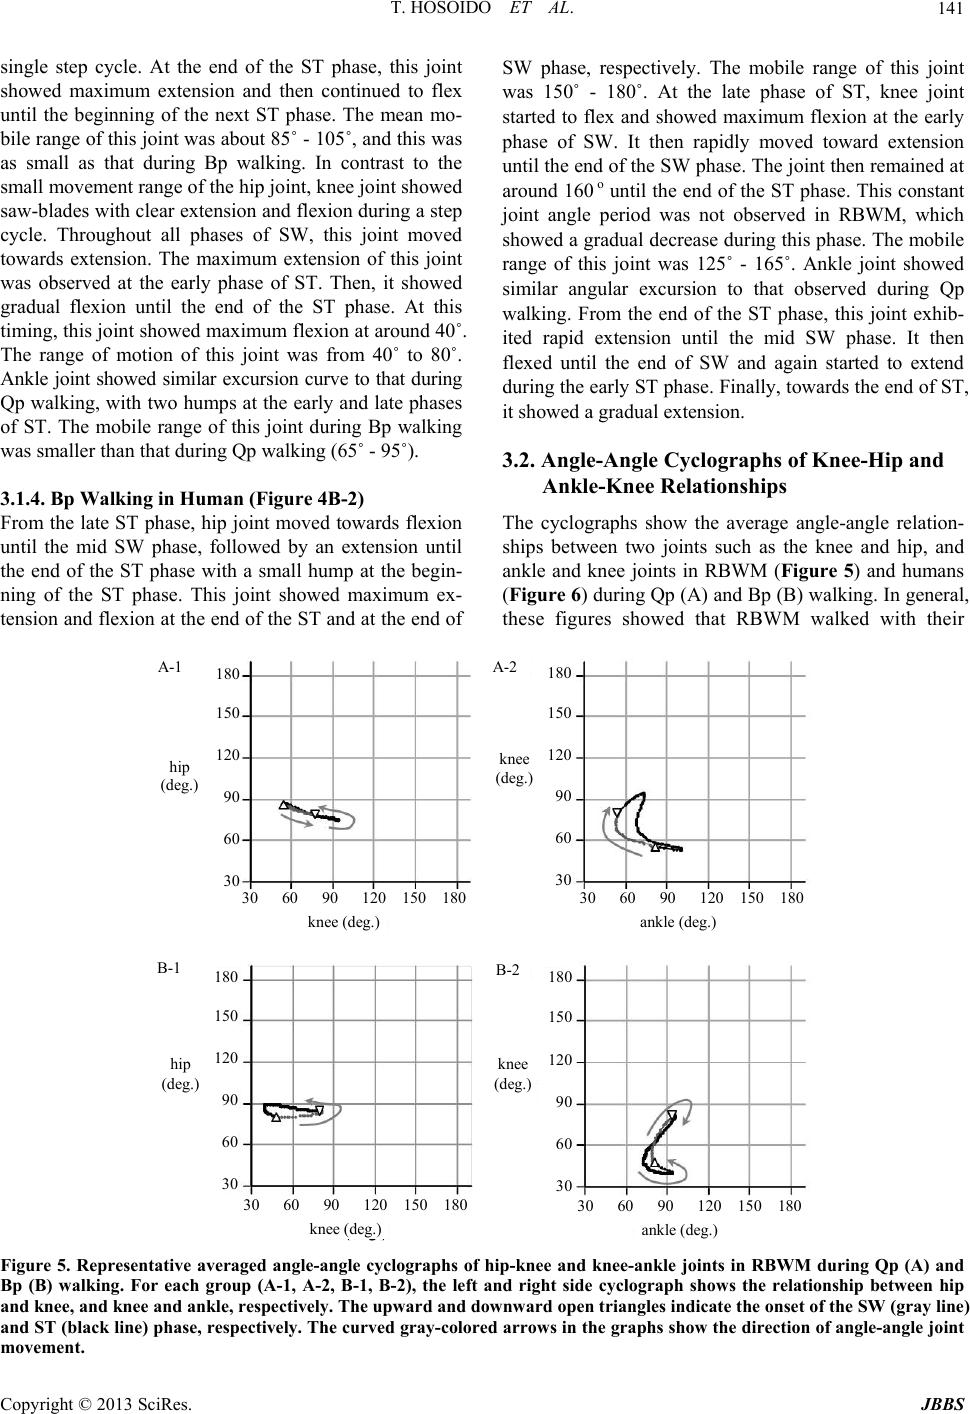 T. HOSOIDO ET AL. 141 single step cycle. At the end of the ST phase, this joint showed maximum extension and then continued to flex until the beginning of the next ST phase. The mean mo- bile range of this joint was about 85 ˚ - 105˚, and this was as small as that during Bp walking. In contrast to the small movement range of the hip joint, knee joint showed saw-blades with clear extension and flexion during a step cycle. Throughout all phases of SW, this joint moved towards extension. The maximum extension of this joint was observed at the early phase of ST. Then, it showed gradual flexion until the end of the ST phase. At this timing, this joint showed maximum flexion at around 40˚. The range of motion of this joint was from 40˚ to 80˚. Ankle joint showed similar excursion curve to that during Qp walking, with two humps at the early and late phases of ST. The mobile range of this joint during Bp walking was smaller than that during Qp walking (65˚ - 95˚). 3.1.4. Bp Walking in Human (Figure 4B-2) From the late ST phase, hip joint moved towards flexion until the mid SW phase, followed by an extension until the end of the ST phase with a small hump at the begin- ning of the ST phase. This joint showed maximum ex- tension and flexion at the end of the ST and at the end of SW phase, respectively. The mobile range of this joint was 150˚ - 180˚. At the late phase of ST, knee joint started to flex and showed maximum flexion at the early phase of SW. It then rapidly moved toward extension until the end of th e SW phase. The joint then remained at around 160 o until the end of the ST phase. This constant joint angle period was not observed in RBWM, which showed a gradual decrease during this phase. The mobile range of this joint was 125˚ - 165˚. Ankle joint showed similar angular excursion to that observed during Qp walking. From the end of the ST phase, this joint exhib- ited rapid extension until the mid SW phase. It then flexed until the end of SW and again started to extend during the early ST phase. Finally, towards the end of ST, it showed a gradua l extension. 3.2. Angle-Angle Cyclographs of Knee-Hip and Ankle-Knee Relationships The cyclographs show the average angle-angle relation- ships between two joints such as the knee and hip, and ankle and knee joints in RBWM (Figure 5) and humans (Figure 6) during Qp (A) and Bp (B) walking. In general, these figures showed that RBWM walked with their A-1 A-2 B-1 B-2 hip (deg.) 180 150 120 90 60 30 180 150 120 90 60 30 knee (deg.) 180 150 120 90 60 30 180 150 120 90 60 30 hip (deg.) knee (deg.) 30 60 90 120 150 18030 60 90 120 150 180 ankle (deg.) knee (deg.) 30 60 90 120 150 18030 60 90 120 150 180 ankle (deg.) knee (deg.) Figure 5. Representative averaged angle-angle cyclographs of hip-knee and knee-ankle joints in RBWM during Qp (A) and Bp (B) walking. For each group (A-1, A-2, B-1, B-2), the left and right side cyclograph shows the relationship between hip and knee, and knee and ankle, respectively. The upward and downward open triangles indicate the onset of the SW (gray line) and ST (black line) phase, respectively. The curved gray-colored arrows in the graphs show the direction of angle-angle joint movement. Copyright © 2013 SciRes. JBBS 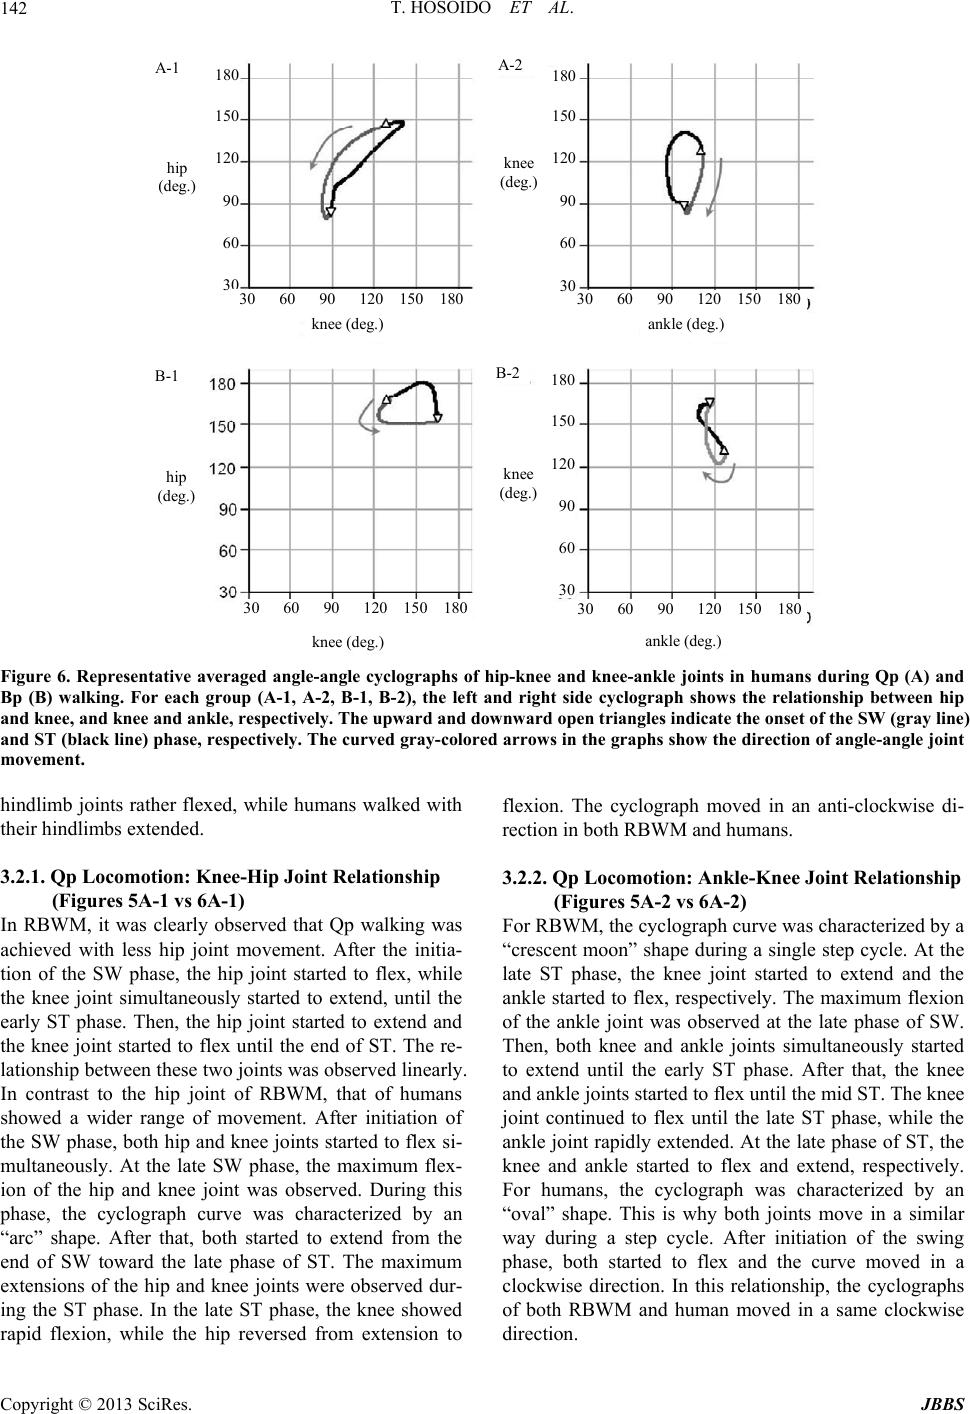 T. HOSOIDO ET AL. 142 A-1 A-2 B-1 B-2 hip (deg.) knee (deg.) 180 150 120 90 60 30 180 150 120 90 60 30 hip (deg.) knee (deg.) 30 60 90 120 150 18030 60 90 120 150 180 ank l e ( deg.)knee (deg.) 30 60 90 120 150 18030 60 90 120 150 180 ank l e ( deg.) knee (deg.) 180 150 120 90 60 30 Figure 6. Representative averaged angle-angle cyclographs of hip-knee and knee-ankle joints in humans during Qp (A) and Bp (B) walking. For each group (A-1, A-2, B-1, B-2), the left and right side cyclograph shows the relationship between hip and knee, and knee and ankle, respectively. The upward and downward open triangles indicate the onset of the SW (gray line) and ST (black line) phase, respectively. The curved gray-colored arrows in the graphs show the direction of angle-angle joint movement. hindlimb joints rather flexed, while humans walked with their hindlimbs extended. 3.2.1. Q p Locom ot i on: Knee-Hip Joint Relation s h i p (Figures 5A-1 vs 6A -1) In RBWM, it was clearly observed that Qp walking was achieved with less hip joint movement. After the initia- tion of the SW phase, the hip joint started to flex, while the knee joint simultaneously started to extend, until the early ST phase. Then, the hip joint started to extend and the knee joint started to flex until the end of ST. The re- lationship between th ese two join ts was o bserved lin early. In contrast to the hip joint of RBWM, that of humans showed a wider range of movement. After initiation of the SW phase, both hip and knee joints started to flex si- multaneously. At the late SW phase, the maximum flex- ion of the hip and knee joint was observed. During this phase, the cyclograph curve was characterized by an “arc” shape. After that, both started to extend from the end of SW toward the late phase of ST. The maximum extensions of the hip and knee joints were observed dur- ing the ST phase. In the late ST phase, the knee showed rapid flexion, while the hip reversed from extension to flexion. The cyclograph moved in an anti-clockwise di- rection in both RBWM and humans. 3.2.2. Qp Locomotion: Ank l e-Knee J oi nt Rel a ti ons hi p (Figures 5A-2 vs 6A -2) For RBWM, the cyclograph curve was characterized by a “crescent moon” shape during a single step cycle. At the late ST phase, the knee joint started to extend and the ankle started to flex, respectively. The maximu m flexion of the ankle joint was observed at the late phase of SW. Then, both knee and ankle joints simultaneously started to extend until the early ST phase. After that, the knee and ankle joints started to flex until the mid ST. The knee joint continued to flex until the late ST phase, while the ankle joint rapidly extend ed. At the late phase of ST, the knee and ankle started to flex and extend, respectively. For humans, the cyclograph was characterized by an “oval” shape. This is why both joints move in a similar way during a step cycle. After initiation of the swing phase, both started to flex and the curve moved in a clockwise direction. In this relationship, the cyclographs of both RBWM and human moved in a same clockwise direction. Copyright © 2013 SciRes. JBBS  T. HOSOIDO ET AL. 143 3.2.3. Bp Locomotion: Knee-Hip Joint Relationship (Figures 5 B -1 vs 6B-1 ) In RBWM, the cyclograph showed a “flat oval” shape with a longer horizontal (knee) axis. This shape was made by the rapid extension-flexion movement of the knee joint with less that of the hip joint. After initiation of the SW phase, the knee joint showed exten sion for th is period, while the hip joint was weakly extended. Then, the knee joint started to flex until the late part of the ST phase, with weak hip extension. In humans, the cyclo- graph curve was characterized by a “triangle” shape dur- ing a one step cycle. This triangle shape cyclograph in- dicated that both the hip and knee joints showed similar flexion and extension cycles throughout a single step cycle. At the early SW phase, both hip and knee joints simultaneously flexed. During mid to late SW phase, the hip joint remained constant and the knee joint was ex- tended. From the beginning of the ST phase, the hip joint showed gradual extension, while the extended knee joint was preserved. Then, at the late ST phase, both the hip and knee joints showed gradual flexion until the initia- tion of the SW phase. In both RBWM and human sub- jects, the cyclograph directions were anti-clockwise. 3.2.4. Bp Locomotion: Ankle-Knee Joint Relationship (Figures 5 B -2 vs 6B-2 ) The cyclograph curve in RBWM was expressed by a “figure of eight”. During the SW phase, the knee joint rapidly extended, while the ankle joint showed gradual extension. After the onset of the ST phase, both the knee and ankle joint started to flex up to two-thirds of the ST phase. Then, the ankle began to extend, while the knee joint maintained flexion in the late ST phase. For humans, the cyclograph between the knee and ankle showed a “figure of eight” shape which was similar to that observed during RBWM Bp walking. At the early phase of SW, both the knee and ankle were flexed. Then, the knee joint was rapidly extended, while the ankle joint remained co n- stant. Subsequently, both the knee and ankle started to flex at the beginning of ST. During the late ST phase, the knee showed flexion while the ankle showed extension. 3.3. EMG Burst Patterns between RBWM and Humans in Qp and Bp Walking Figure 7 illustrates ensemble-averaged EMG waveforms through a single step cycle between different subjects in the same walking pattern. As in Figure 7, EMG compo- nents showing similar onset and/or duration between RBWM and humans during Qp and Bp walking are indi- cated by the black and white arrows in each averaged EMG. 3.3.1. Longissimus Lumborum Although no common EMG bursts were observed in ei- ther RBWM or humans during Qp walking, a burst at the early ST phase was observed in both RBWM and hu- mans during Bp walking. 3.3.2. Gluteus M ed ius During Qp walking, this muscle showed small and large bursts at the end of SW and at the late phase of ST, re- spectively, in both RBWM and humans. During Bp Qp-RBWM Gm 0 50 100% L 50 100%0 50 100% 50 100% Bp-RBWM Bp-Human Qp-Hu man L Gm Q Q HH GsGs TATA 0.05V Figure 7. Ensemble-averaged EMG waveforms through a single step cycle in RBWM (n = 5) and humans (n = 3) during Qp and Bp walking. The vertical black bar on the right of each graph shows an amplitude of 0.05 V. L: Longissimus lumborum at L1-3, Gm: gluteus medius, Q: rectus femoris of the quadriceps, H: semitendinosus of the Hamstring, Gs: lateral head of the gastrocnemius, TA: tibialis anterior. Copyright © 2013 SciRes. JBBS  T. HOSOIDO ET AL. 144 walking, there was a burst EMG activity at the mid-ST in both RBWM and humans. 3.3.3. Quadric e p s During Qp walking, two bursts were observed at the tran- sition period from SW to ST and at the late phase of ST, however, the amplitudes were different. 3.3.4. Hamstrings During Qp walking, the burst EMG activity was detected at the late ST phase in both RBWM and human subjects, while a burst component was found at the early phase of ST during Bp walking. 3.3.5. G astroc n em ius In both RBWM and humans, there were burst activities at the late phase of ST. During Bp walking, an in- creased EMG activity was observed at the mid ST in both RBWM and humans. 3.3.6. Tibialis Anterior This muscle showed a variety of activity patterns be- tween RBWM and human subjects in either Qp or Bp walking. 3.4. EMG Activity between Qp and Bp Walking in RBWM and Humans Figure 8 was prepared to detect common features of EMG activity during Qp and Bp walking in RBWM and humans, respectively. Overall, these results show that the muscle activities during the subject’s natural walking pattern were less active than those during the non-essen- tial walking pattern, i.e. Qp < Bp for rat and Bp < Qp for human. 3.4.1. Longissimus Lumborum In Qp-RBWM, there seem to be two burst activities dur- ing a single step cycle. They were observed at the transi- tion period from the SW to ST phase and at the late part of ST. In Bp-RBWM, the EMG showed tonic activity during a step cycle with three burst activities. A burst EMG was obtained at the transition period from the SW to ST phases in both Qp and Bp walking. In human Qp, this muscle showed basically tonic activity with three bursts. One of these bursts was observed at the SW phase, and the other two were seen during the ST phase, respec- tively. The burst observed at the early ST phase during Bp walking was also obtained during Qp walking. 3.4.2. Gluteus M ed ius In Qp-RBWM, this muscle showed small and large bursts at the en d of SW and at the transition period from ST to SW phase, respectively. Except for these active periods, this muscle was rather silent. In Bp walking, this muscle showed three EMG bursts during a single step cycle. These were observed at the transition period from SW to ST, the mid-ST and the late ST phases. The burst at the late ST phase during Qp and Bp were similarly observed in RBWM. In humans, there were two burst activities and one burst activity during Qp and Bp walk- ing, respectively. The onset timing and the duration were different. 3.4.3. Quadric e p s In RBWM, the EMG burst activities were different be- tween Qp and Bp walking. During Qp walking, two burst activities were observed at the end of the SW (larger) and the mid-ST (smaller) phases. This muscle was activated at the end of ST during Bp walking. In human Qp, there were two bursts; one during SW and the other during the ST phase. A small burst was observed at the early phase of ST during Bp walking. This muscle showed different burst patterns and duration in humans. 3.4.4. Hamstrings In RBWM during Qp walking, two EMG bursts were clearly observed at the late SW and at the end of ST phases, respectively. There were EMG bursts activated at the same timing during Bp walking. In humans, there were two EMG burst activities during Qp walking, while there was no clear burst during Bp walking. 3.4.5. G astroc n em ius In Qp-RBWM, there were two bursts at the transition from SW to ST phases and during ST phase. On the other hand, there were three burst activities du ring Bp walking . These were observed at the transition period from the SW to ST, the mid-ST and the end of the ST phases. The first and the last ones were activated at the same timing in Qp-RBWM. In humans, two bursts were observed during Qp walking, while a single burst was seen during Bp walking. This burst was activated at the same timing during a step cycle (early phase of ST) during Qp walk- ing. 3.4.6. Tibialis Anterior In RBWM, this muscle showed a simple burst at the end of ST during both Qp and Bp walking. In humans, there were two burst activities in both Qp and Bp walking. The burst which appeared at the transition from the SW to ST phase was observed in both Q p an d B p wa lking. 3.5. Comparison of Averaged EMG Activity during Qp and Bp Waling in RBWM and Human To compare each muscle activity during a single step Copyright © 2013 SciRes. JBBS 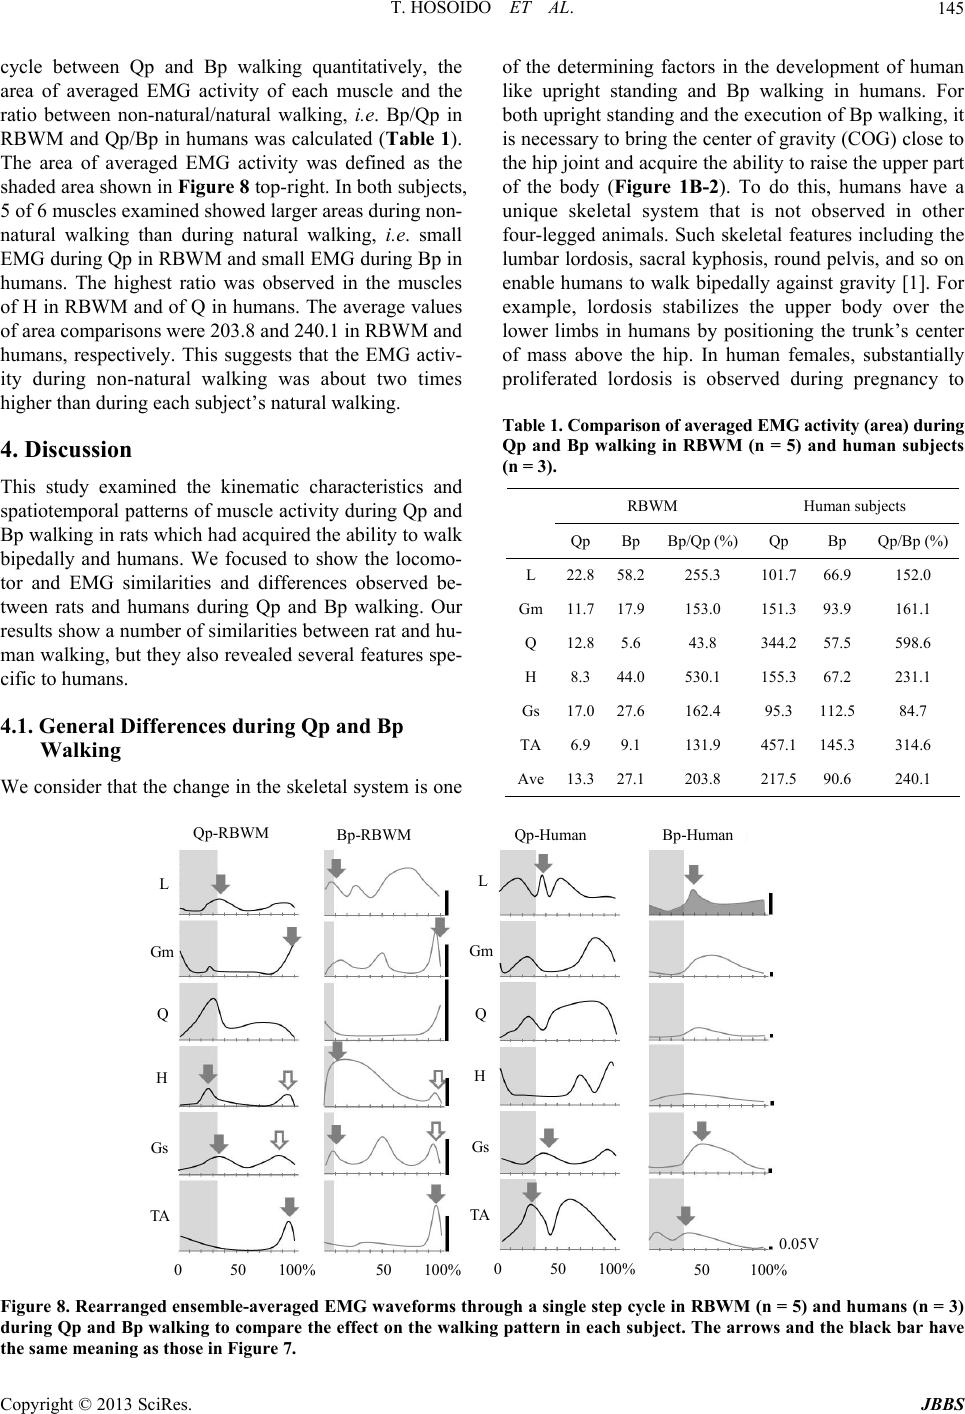 T. HOSOIDO ET AL. 145 cycle between Qp and Bp walking quantitatively, the area of averaged EMG activity of each muscle and the ratio between non-natural/natural walking, i. e. Bp/Qp in RBWM and Qp/Bp in humans was calculated ( Table 1). The area of averaged EMG activity was defined as the shaded area shown in Figure 8 top-right. In both subjects, 5 of 6 muscles examined showed larger areas dur ing non- natural walking than during natural walking, i.e. small EMG during Qp in RBWM and small EMG during Bp in humans. The highest ratio was observed in the muscles of H in RBWM and of Q in humans. The average values of area comparisons were 203.8 and 240.1 in RBWM and humans, respectively. This suggests that the EMG activ- ity during non-natural walking was about two times higher than during each subject’s natural walking. 4. Discussion This study examined the kinematic characteristics and spatiotemporal patterns of muscle activ ity during Qp and Bp walking in rats which had acquired the ability to walk bipedally and humans. We focused to show the locomo- tor and EMG similarities and differences observed be- tween rats and humans during Qp and Bp walking. Our results show a number of similarities between rat and hu- man walking, but they also revealed several features spe- cific to humans. 4.1. General Differences during Qp and Bp Walking We consider that the change in the skeletal system is one of the determining factors in the development of human like upright standing and Bp walking in humans. For both upright standing and the execution of Bp walking, it is necessary to bring the center of gravity (COG) close to the hip joint and acqu ire the ability to raise the upp er part of the body (Figure 1B-2). To do this, humans have a unique skeletal system that is not observed in other four-legged animals. Such skeletal features including the lumbar lordosis, sacral kyphosis, round pelvis, and so on enable humans to walk bipedally against gravity [1]. For example, lordosis stabilizes the upper body over the lower limbs in humans by positioning the trunk’s center of mass above the hip. In human females, substantially proliferated lordosis is observed during pregnancy to Table 1. Comparison of averaged EMG activity (area) during Qp and Bp walking in RBWM (n = 5) and human subjects (n = 3). RBWM Human subjects QpBpBp/Qp (%) Qp Bp Qp/Bp (%) L 22.858.2255.3 101.7 66.9 152.0 Gm11.717.9153.0 151.3 93.9 161.1 Q 12.8 5.643.8 344.2 57.5 598.6 H 8.344.0530.1 155.3 67.2 231.1 Gs17.027.6 162.4 95.3 112.5 84.7 TA6.99.1131.9 457.1 145.3 314.6 Ave13.327.1203.8 217.5 90.6 240.1 Qp-RBWM Gm 0 50 100% L 50 100%0 50 100%50 100% Bp-RBWM Bp-Human Qp-Human L Gm QQ H H Gs Gs TA TA 0.05V Figure 8. Rearranged ensemble-averaged EMG waveforms through a single step cycle in RBWM (n = 5) and humans (n = 3) during Qp and Bp walking to compare the effect on the walking pattern in each subject. The arrows and the black bar have the same meaning as those in Figure 7. Copyright © 2013 SciRes. JBBS  T. HOSOIDO ET AL. 146 compensate for the fetal load [7]. From these facts, it should be emphasized that these skeletal characteristics help such spatial body orientation for upright body pos- ture. The typical Qp ungulates are not able to walk bi- pedally. This is because their COGs are always main- tained at around the front of the animal’s body during walking and this position is cl early different from that of humans. Therefore, the bipedalism must strongly relate with the position of COG. In this sense, humans are a unique mammal which can adapt their Bp walking to various circumstances while maintaining the COG di- rectly at the hip joint. It is well known that primates can acquire the ability to walk bipedally and even clear obstacles on a walking path with motor learning [8-10]. This indicates that they are able to bring their COG near to the hip joint due to their acquired skeletal similarities to humans such as the lordosis in various situations [10-12]. However, their walking posture is not exactly the same as that of humans. This is due to the characteristic flexed body posture and called “bent-hip and bent-knee” walking posture [4]. As a result, their upper bodies are rather forward-bent. In our rat model, the rats could walk bipedally, but their body axis orientation was forwardbent, suggesting that the COG is not exactly on the hip joint (Figures 1A-2 and 2B). This walking posture surprisingly resembles to that of chimpanzees and other nonhuman primates. Why do they walk with such a posture? There are many kinds of four-legged mammals in nature and they have adapted their body structures su itable to their liv ing environments during evolution. From this point of view, it is possible that their bodies are not suitable for erect posture due to skeletal constraints such as the different orientation of the ischium between primates and humans [13]. Substan- tially, the key to the skeletal structure for human-like walking posture can be found at around the pelvic girdle [14]. 4.2. Motor Patterns during Qp Walking in Rats and Humans Qp walking is a natural locomotor pattern for the rat, but it may be a challenging locomotor task for humans [15- 17]. In this locomotor task, our findings revealed both similarities and differences between rats and humans. Among the similarities is the rhythmical and replicable hindlimb movement across consecutive step cycles whic h reflect the existence of a common rhythm generating sys- tem in both subjects [18]. The cyclographs showed that both knee-hip and ankle-knee relationships during Qp walking were in anti-clockwise and clockwise directions, respectively, in rats (Figure 5) and humans (Figure 6). These results suggest that the rhythmical hindlimb mo- tion and its alignment were similarly controlled between rats and humans for the smooth and seamless execution of Qp walking. We also found several differences in the mobile range of the hindlimb joint and the amplitude of each muscle during walking. The mobile ranges of the hip and knee joints during Qp walking in RBWM (Qp-RBWM) were smaller than that during Qp walking in humans (Qp- Human), and these two joints were generally flexed (Figure 4). On the other hand, the range of ankle in Qp- RBWM was lar ger th an that in Qp-Hu man. Ank le p lanta r flexion during Qp-RBWM and Qp-Human was observed twice in a single step cycle. This angular excursion was well coupled with the EMG burst observed in Gs, which is the ankle plantar flexor muscle (Figure 4). The Q mu- scle in both RBWM and humans showed EMG bursts during the extension phase of the ipsilateral hindlimb knee joint and these bursts were observ ed during the SW phase of the same limb during Qp walking. Moreover, the burst activities observed in Gm and H were common between RBWM and humans, suggesting the proximal muscles are also used in a similar manner in both rats and humans (Figure 7). These results suggest that both sub- jects recruited common motor patterns in the hindlimbs during Qp walking, while having their own mobile range of hindlimb joints. 4.3. Motor Patterns during Bp Walking in Rats and Humans RBWM showed stable BP walking, but the Bp walking pattern was not exactly the same as that of humans (Fig- ure 2B). In this locomotor task, a clear difference was observed at the shortened period of the SW phase in RBWM. The ratio between the period of the SW:ST phases during Bp walking was about 1:9 in RBWM and 3:7 in humans; however, the ratio itself was preserved with replicable angular excursions which reflect the ex- istence of a rhythm generator in rats and humans (Figure 4, [18]). Conversely to Qp walking, many muscles were highly activated during Bp walking in RBWM (Figures 7 and 8). However, it should also be indicated that all of these muscles were phase-dependently activated [16]. For ex- ample, in Q muscle during Bp walking, the activity was transiently observed from the end of ST to the SW phases and this was for both extension of knee joints and flexion of hip joints in RBWM. In contrast to the RBWM Q EMG activity, that of humans was seen from the end of SW to the mid-ST phase, and seems to be used for knee extension and maintenance. In fact, Q is a bi-func- tional muscle used to flex the hip and extend kne e joints, and these results suggest that both rat and human subjects could use this muscle for Bp walking. The activity o f the H muscle in Bp-RBWM was maintained throughout the Copyright © 2013 SciRes. JBBS  T. HOSOIDO ET AL. 147 ST phase (early > late), while human H muscle showed a different activity pattern during the same period. This H muscle activity and the lower activity of Q muscle caused knee flexion in RBWM during the ST phase. This knee flexion lowered the COG of Bp walking rats and may have forcibly terminated stable Bp walking on the treadmill belt. Certainly, the knee joint gradually flexed during the ST phase in RBWM (Figure 4A-2). To cor- rect this walking posture, it is necessary to bring the lowered COG higher to the proper level. The small EMG burst activity of the H muscle observed at the end of the ST phase in the ipsilateral limb must be recruited for this. Continuous knee flexion during the ST phase also forced initiation of the SW phase of the contralateral limb and the short SW phase was indispensable for the next step cycle. It was interesting that the activity pattern of this H muscle was not exactly the same between RBWM and human subjects during Bp walking, but the largest EMG amplitude of this muscle was observed at the transition from the SW to ST phase. The same EMG activity com- ponent is present in other muscles such as the L, Gm and Gs. Four of six muscles examined, showed surprisingly similar activation patterns and/or components during Bp walking in both rats and human sub j ects. Moreover, three of these muscles are activated in both Qp and Bp walking. These results may indicate that both subjects have a similar control system for the different walking patterns. 4.4. Motor Patterns between Qp and Bp Walking in Rats and Humans Between Qp and Bp walking, we also found many simi- larities and differences in the characteristic EMG bursts in both RBWM and human subjects, respectively (Fig- ure 8). The Gm muscle is the extensor of the hip joint. The largest EMG burst of this muscle was mainly ob- served at the end of the ST phase in both locomotor patterns. This reflected that the ipsilateral hindlimb is pushing the walking surface before toe off. The hip joint excursion in both Qp and Bp walking was quite small (Figure 4) and this seems to reflect the smaller EMG burst activity of this muscle in RBWM. During Bp walk- ing, the other two bursts were observed at the beginning of ST and the mid-ST phases and were probably recrui- ting for the extension of the hip joint and the main- tenance of its joint angle during Bp walking. In humans, the EMG activities of the Gm muscle in both Bp and Qp walking resemble those of the Q muscle. This suggests that these two muscles are co-functioning in humans. In Bp walking, Gm muscle bursts observed during the ST phase extended the angle of the hip joint from 165˚ to 180˚. It was noteworthy that the Gm EMG burst was terminating when the ipsilateral knee started to flex to- gether with hip flexion. On the other hand, during Qp walking, Gm EMG bursts were observed twice at the end of SW and the ST phase, respectively. This pattern was similarly observed in the Q muscle, suggesting the Gm muscle co-activates with the Q muscle. The latter activity was observed during extension of the ip silateral hip joint. The former was observed when the hip joint showed flexion and the kn ee jo in t started to ex tend. It see med un- likely to be related to hip joint extension, but this might be a characteristic EMG burst observed when human subjects are walking on a treadmill belt quadrupedally (hand-foot crawling). A clear difference was also observed in the Q muscle in humans. The burst of this muscle mainly corresponded to the flexion of the knee joint. It is considered that the Q muscle EMG burst during the ST phase of the ipsilateral hindlimb inhibits excessive knee flexion during Qp walk- ing. EMG bursts of Q in Bp-human were small and mainly observed during early ST phase. During Qp walk- ing, the Q EMG burst was also observed at the ST phase and had large amplitude. However, the function of this EMG burst during Qp walking seems to be different. The EMG burst during Bp maintained the angle of the knee joint at around 165˚, while Q EMG bursts during the ST phase in Qp walking were observed during the extension phase of the ipsilateral knee joint. These facts indicate that the human subjects could appropriately recruit each muscle’s functional role for different walking patterns. Between Qp and Bp walking, five of six and three of six muscles showed similar EMG burst activities in rats and humans, respectively. In rats, this result suggests that their Qp and Bp walking is achieved by similar muscular activations. In contrast to the results from rats, humans tend to use each muscle selectively to fit different walk- ing patterns. This may be due to the recruitment of vo- luntary control in Qp walking that is not a natural pattern for adult hu mans [16]. 4.5. Expected Energy Consumption between Qp and Bp in Rats and Humans For rats and adult humans, the Bp and Qp walking pat- terns were not natural, respectively. The general high ac- tivation of each muscle during Bp-RBWM and during Qp-Human in the present study implies that RBWM and humans need a lot of energy during their Bp and Qp walking, respectively. In fact, the EMG amplitude during Qp-RBWM was smaller than that during Bp-RBWM, and that during Bp-human was smaller than that during Qp-human (Figure 8). It is not possible to calculate energy consumption from EMG activity, however, it might be possible to argue that the increased activation should increase the cost. From this point, we had cal- culated the area of averaged each muscle EMG activity as shown in Figure 8 (top right dark shaded area). The Copyright © 2013 SciRes. JBBS  T. HOSOIDO ET AL. 148 results are summarized in Table 1 . Five of six muscles in both RBWM and humans showed about a 1.5 to 6 times larger area in Bp and Qp walking, respectively. The ave- rage comparison showed about a 2 to 2.4 times larger area in the non-natural walking patterns. Although the areas of Q in RBWM and Gs in humans were smaller during the non-natural walking patterns, the majority of the muscles that underwent EMG recording showed si- milar trends. This suggests that the non-natural walking patterns was made by a lot of efforts and probably re- quired more energy than for the natural walking pat- terns. The smaller areas in Q and Gs, however, indicate that these are probably not necessary or are less affected in both Bp and Qp in RBWM and humans. This is be- cause a clear EMG burst was observed in both muscles and this burst induced clear joint movement during dif- ferent walking patterns. Nakatsukasa et al. [19,20] showed that Bp-trained nonhuman primates consume less meta- bolic energy during their natural Qp walking than Bp. This suggests that RBWM Bp and human Qp walking may demand more precise neuronal control, such as cor- tical control, for unfamiliar body posture requirements and/or intersegmental coordination as compared to their habitual quadrupedal and bipedal walking patterns. As described above, energy consumption is the one of the key determinants in th e selection of a walkin g pattern for animals [21]. Sockol et al. [13] investigated the cost of transport in five chimpanzees between Qp and Bp walking. They found that an individual comparison showed a significant difference between Qp and Bp walking in both juvenile males (n = 2) and adult females (n = 3). For two juveniles, the cost of transport was sig- nificantly lower during Qp walking and one of the adult chimpanzees showed a similar result. Surprisingly, one of the other two female adults showed a significantly lower cost of transport during Bp walking (Bp lower energy consumption chimpanzee). They also compared the kinematic characteristics and found that the Bp lower energy consumption chimpanzee extended her hips and knees to a similar degree during Qp and Bp walking, while the others showed more flexed limb orientation during Bp walking. Even this chimpanzee, however, bent her body axis rather forward and this suggests that the body axis, or at least th e hip an d knee joints, functio nally interlock during walking as in a hinge. The anatomical difference in ischium between chimpanzee and human is clear; the former is oriented distally, while the latter is dorsally oriented. This spatial d ifference redu ces the abi- lity of the hamstring, which produces an extensor mo- ment when the femur is extended, relative to the p elvis in chimpanzees. This biomechanical constraint seems to be one of the main reasons preventing chimpanzees from walking like humans. From these, it was also suggested that slight kinematic changes induce large differences in walking cost and are consistent with previous studies showing that differences in posture can affect cost [22, 23]. For pregnant human females, the fetal load moves her COG forward and thus bends her posture forward. This destabilized Bp standing posture is usually com- pensated by enhanced lumbar lordosis and translating the COG backward [7]. Without this skeletal compensation, such an instable posture must be counteracted by the back and proximal lower limb muscles, requiring much more energy than a stable posture. This is reasonable be- cause the energy consumption must be smaller when the COG is on the hip joint than when it is far from the hip. From these facts, it is clear that the skeletal system also affects the energy consumption during walking for indi- vidual animals. 5. Conclusion Overall, this study provides new data on EMG activities and kinematics during Qp and Bp walking in both rats and humans. Rats that acquired Bp walking capability and humans showed several common kinematics and EMG burst patterns during the same walking task. This suggests that they share common neuronal control sys- tems, at least at the spinal cord level. The differences in posture during Bp walking may be due to the skeletal constraints that do not allow four-legged mammals in- cluding nonhuman primates to extend their hip and knee joints and even the body axis. Due to this skeletal char- acteristic, the elaboration of Bp walking requires a lot more energy than for Qp walking in rat. 6. Acknowledgements We thank all the student members of our laboratory for their dedicated daily rat training and technical support. This work was partly supported by Grants-in-Aid for Priority Areas “Emergence of Adaptive Motor Function through Interaction between Body, Brain and Environ- ment” and challenging Exploratory Research from the Ministry of Education, Culture, Sports, Science and Tech- nology Japan to Mori F. REFERENCES [1] J. T. Robinson, “Early Hominid Posture and Locomo- tion,” University of Chicago Press, Chicago, 1973. [2] D. Schmitt, “Insights into the Evolution of Human Bipe- dalism from Experimental Studies of Humans and Other Primates,” Journal of Experimental Biology, Vol. 206, No. 9, 2003, pp. 1437-1448. doi:10.1242/jeb.00279 [3] D. C. Dunbar, F. B. Ho rak, J. M. Macpher son, D. S. R u sh- mer, “Neural Control of Quadrupedal and Bipedal Stance: Implications for the Evolution of Erect Posture,” Ameri- can Journal of Physical Anthropology, Vol. 69, No. 1, 1986, pp. 93-105. doi:10.1002/ajpa.1330690111 Copyright © 2013 SciRes. JBBS  T. HOSOIDO ET AL. Copyright © 2013 SciRes. JBBS 149 [4] J. T. Stern Jr. and R. L. Susman, “The Locomotor Anat- omy of Australopithecus Afarensis,” American Journal of Physical Anthropology, Vol. 60, No. 3, 1983, pp. 279-317. doi:10.1002/ajpa.1330600302 [5] N. Wada, Y. Toba, W. Iwamoto, M. Goto, H. Miyata, F. Mori and F. Morita, “Investigation and Characterization of Rat Bipedal Walking Models Established by a Training Program,” Brain Research, Vol. 1243, 2008, pp. 70-77. doi:10.1016/j.brainres.2008.09.034 [6] T. Hosoido, M. Goto, Y. Sano, F. Mori, K. Nakajima, F. Morita and N. Wada, “Hoffman Reflex in a Rat Bipedal Walking Model,” Neuroscience Letters, Vol. 505, No. 3, 2011, pp. 263-267. doi:10.1016/j.neulet.2011.10.035 [7] K. K. Whitcome, L. J. Shapiro and D. E. Lieberman, “Fetal Load and the Evolution of Lumbar Lordosis in Bi- pedal Hominins,” Nature, Vol. 450, No. 7172, 2007, pp. 1075-1078. doi:10.1038/nature06342 [8] E. Hirasaki, N. Ogihara, Y. Hamada, H. Kumakura and M. Nakatsukasa, “Do Highly Trained Monkeys Walk Like Humans? A Kinematic Study of Bipedal Locomotion in Bipedally Trained Japanese Macaques,” Journal of Hu- man Evolution, Vol. 46, No. 6, 2004, pp. 739-750. doi:10.1016/j.jhevol.2004.04.004 [9] F. Mori, K. Nakajima, A. Tachibana, C. Takasu, M. Mori, T. Tsujimoto, H. Tsukada and S. Mori, “Reactive and An- ticipatory Control of Posture and Bipedal Locomotion in a Nonhuman Primate,” Progress in Brain Research, Vol. 143, 2004, pp. 191-198. doi:10.1016/S0079-6123(03)43019-7 [10] A. Tachibana, F. Mori, C. A. Boliek, K. Nakajima, C. Takasu and S. Mori, “Acquisition of Operant-Trained Bi- pedal Locomotion in Juvenile Ja panese Monke ys (Macaca Fuscata): A Longitudinal Study,” Motor Control, Vol. 7, No. 4, 2003, pp. 388-410. [11] S. Hayama, M. Nakatsukasa and Y. Kunimatsu, “Monkey Performance: The Development of Bipedalism in Trained Japanese Monkeys,” Acta Anatomica Nipponica, Vol. 67, No. 3, 1992, pp. 169-185. [12] H. Preuschoft, S. Hayama and M. M. Günther, “Curva- ture of the Lumbar Spine as a Consequence of Mechani- cal Necessities in Japanese Macaques Trained for Biped- alism,” Folia Primatologica (Basel), Vol. 50, No. 1-2, 1988, pp. 42-58. doi:10.1159/000156333 [13] M. D. Sockol, D. A. Raichlen and H. Pontzer, “Chim- panzee Locomotor Energetics and the Origin of Human Bipedalism,” Proceedings of National Academy of Sci- ences of United States of America, Vol. 104, No. 30, 2007, pp. 12265-12269. doi:10.1073/pnas.0703267104 [14] M. W. Grabowski, J. D. Polk and C. C. Roseman, “Di- vergent Patterns of Integration and Reduced Constraint in the Human Hip and the Origins of Bipedalism,” Evolu- tion, Vol. 65, No. 5, 2011, pp. 1336-1356. doi:10.1111/j.1558-5646.2011.01226.x [15] M. Hildebrand, “Symmetrical Gaits of Primates,” Ameri- can Journal of Physical Anthropology, Vol. 26, No. 2, 1967, pp. 119-130. doi:10.1002/ajpa.1330260203 [16] M. J. MacLellan, Y. P. Ivanenko, G. Cappellini, F. S. La- bini and F. Lacquaniti, “Features of Hand-Foot Crawling Behavior in Human Adults,” Journal of Neurophysiology, Vol. 107, No. 1, 2012, pp. 114-125. doi:10.1152/jn.00693.2011 [17] W. A. Sparrow, “Creeping Patterns of Human Adults and Infants,” American Journal of Physical Anthropology, Vol. 78, No. 3, 1989, pp. 387-401. doi:10.1002/ajpa.1330780307 [18] N. Dominici, Y. P. Ivanenko, G. Cappellini, A. d’Avella, V. Mondi, M. Cicchese, A. Fabiano, T. Silei, A. Di Paolo, C. Giannini, R. E. Roppele and F. Lacquaniti, “Locomo- tor Primitives in Newborn Babies and Their Develop- ment,” Science, Vol. 334, No. 6058, 2011, pp. 997-999. doi:10.1126/science.1210617 [19] M. Nakatsukasa, N. Ogihara, Y. Hamada, Y. Goto, M. Yamada, T. Hirakawa and E. Hirasaki, “Energetic Costs of Bipedal and Quadrupedal Walking in Japanese Ma- caques,” American Journal of Physical Anthropology, Vol. 124, No. 3, 2004, pp. 248-256. doi:10.1002/ajpa.10352 [20] M. Nakatsukasa, E. Hirasaki and N. Ogihara, “Energy Expenditure of Bipedal Walking Is Higher than That of Quadrupedal Walking in Japanese Macaques,” American Journal of Physical Anthropology, Vol. 131, No. 1, 2006, pp. 33-37. doi:10.1002/ajpa.20403 [21] K. Steudel, “The Work and Energetic Cost of Locomotion. I. The Effects of Limb Mass Distribution in Quadrupeds,” Journal of Experimental Biology, Vol. 154, No. 1, 1990, pp. 273-285. [22] T. S. Carey and R. H. Crompton, “The Metabolic Costs of ‘Bent-Hip, Bent-Knee’ Walking in Humans,” Journal of Human Evolution, Vol. 48, No. 1, 2005, pp. 25-44. doi:10.1016/j.jhevol.2004.10.001 [23] R. H. Crompton, L. Yu, W. Weijie, M. Günther and R. Savage, “The Mechanical Effectiveness of Erect and ‘Bent-Hip, Bent-Knee’ Bipedal Walking in Australopith- ecus Afarensis,” Journal of Human Evolution, Vol. 35, No. 1, 1998, pp. 55-74. doi:10.1006/jhev.1998.0222
|