Paper Menu >>
Journal Menu >>
 Technology and Investment, 2013, 4, 1-5 Published Online February 2013 (http://www.SciRP.org/journal/ti) Copyright © 2013 SciRes. TI A Multiple Regression Analysis on Influencing Factors of Urban Services Growth in China Yuan Gao, Phd Candidat1, ABDUL Razak bin Chik2 1School of Economics, Finance &Banking, COB, University Utara Malaysia Sintok , Kedah, Malaysia 2College of Economics, HeBei University, 071000, BaoDing, , HeBei, China Email: michelle811@126.com, arc@uum.edu.my Received 2012 ABSTRACT The indicator of urban success is the success of its urban services. Although much research on services have been made, there is major gap with regard to the regional services, especially on urban services within a country. As for urban ser- vices, there are few research on factors influencing urban services and its effect on regional growth. In reaction to this, the government intend to accelerate the development of urban services and regional economy in the present Twelfth Five -Year Plan 2011-2015.Thus, the main purpose of this paper is to investigate the factors that influence urban servic- es growth from demand , supply, institutional environment and spatial agglomeration side. By using cross-section mul- tiple regression analysis, the study examine the factors influencing urban services growth in China .The model indicated that except for urbanization, division of labor , other independent variables have contributed positively towards urban services growth in China. Keywords: Urban Services; Influencing Factors; Services Growth 1. Introduction Since reform and opening up, China has made remarka- ble economic achievements. In the growing process, its economic structure has also undergone a transformation, and its industrial structure has been gradually optimized and deepened. One important manifestation is the status of services in China's economy has been greatly en- hanced that their role in promoting economic develop- ment has been growing(Cheng,2003).Urban are the main carrier for services’ development(Ji,2004.In 2009, 71% of value added services in China was created by 285 ci- ties at prefecture level. (Source of data: China statistical Yearbook, 2010). Most of the cities have formed a ser- vice -oriented industrial structure. At present, China has entered into the post-industrial period, Chinese govern- ment had already come out with policies to promote ur- banization process as early as on the Eleventh Five Year Plan. In the Eleventh National Congress in 2011,Chinese government stressed once again to accelerate the interac- tive development of urban services and urban economy in the Twelfth Five-Year Plan(2011-2015) .The symbol of urban success is the development level of urban ser- vices, especially level of knowledge-intensive services. Urban services are playing an increasingly important role in the sustained and rapid growth of Chinese economy, but problems of inadequate total output, inferior internal structure , apparent regional disparities , have become major resistance in urban services’ growth. Especially, the expanding regional gap in services is bound to affect its sustainable development as well as enlarge the im- balance in regional economies. In this case, probing the factors influencing urban services growth have practical significance for the entire countr y as well as the regional gro wth. 2. Development of Research Hypotheses As to factors influencing urban services growth, they will be classified into demand, supply, the institutional envi- ronment and services’ spatial concentration side. 2.1. Demand factors and Urban Services Growth Per capita income and urbanization level are main factors affecting demand for consumer services. The influence of Per capita income levels on service is only effective on consumer services. According to Engel's law and Maslow's hierarchy of needs theory, human needs are hierarchical. People will always shift to higher level needs only after meeting the low-level needs. Urbanization has brought the concentration of popula- tion. The concentrated population can generate a huge mutual demand for services, thereby create necessary conditions for services’ survival .  Y. GAO ET AL. Copyright © 2013 SciRes. TI Industrialization level, division of labor are main de- mand factors of producer services’ growth. The urban with well developed secondary industries is easy to at- tract the service enterprises to enter, bringing the saving of transaction costs and the increasing opportunities of servi ce’s business. The division and specialization of labor affect servic- es’ growth in two ways: First, the division of labor be- tween service and other industries or within services can increase labor productivity.. Social division of labor makes a number of industries or sectors differentiated from other industries or sectors, becoming the indepen- dent service sectors. It is, therefore, posited that: Hypothesis 1: There is a positive relationship be- tween demand factors and urban ser- vices growth Hypothesis 1a: There is a positive relationship be- tween per capita disposable income and urban services growth Hypothesis 1b: There is a positive relationship be- tween urbanization level and the ur- ban services growth. Hypothesis1c: There is a positive relationship between industrialization and urban services growth Hypothesis 1d There is a positive relationship between division of labor and the urban services growth . 2.2. Supply Factors and Urban services Growth According to new-classical economics, which is supply oriented and emphasizes factor accumulation and tech- nical progress in economic growth, the amount of physi- cal capital and labor input in services are directly related to its output. The higher proportion of physical capital and labor input in services, the more helpful to promote services’ growth. Besid es, the endogenous growth theory, which empha- sizes the role of human capital accumulation and exter- nalities, human capital has become an important source of technological progress and economic growth. The Structural economists, such as Clark& Fisher [6] and Chenery [5], found that the economic or industrial structure was the main force affecting growth. Then, the hypothesis will be Hypothesis2: There is a positive relationship between the supply factors and urban services growth . Hypothesis2a: There is a positive relationship between the input of physical capital and urban services growth. Hypothesis2b: There is a positive relationship between the input of human capital and urban services growth. Hypothesis2c: There is a positive relationship between the input of labor force and urban ser- vices growth Hypothesis2d: There is a positive relationship between the configuration structure of produc- ing factors and urban services growth. 2.3. The Institutional Environment and Urban Services Growth The market-oriented degree have a major impact on the development of service industry. The higher market de- gree in local economy, the higher level of its develop- ment. The development of non-state economy breaks the monopoly of state-owned economy which helps the pro-competitive mechanisms play a role. Political freedom and economic openness has a posi- tive effect on economic growth [1]. The high openness level of services in China would promote its growth through expanded market effect, knowledge and tech- nology spillovers effect, expanded foreign direct invest- ment effect, competition and innovation effect. . The following hypothesis is thus stated Hypothesis 3: There is a positive relationship between favorable institutional environment and urban services growth. Hypothesis 3a: There is a positive relationship between economic market-oriented level and urban services growth; Hypothesis 3b: There is a positive relationship between services openness level and urban ser- vices growth; 2.4. Services’ Spatial Agglomeration and Urban Services Growth According to the new geography economics , the spatial agglomeration of economic activities will be a source of agglomeration economies that will improve production efficiency, increase consumer utilities and thus accelerate economic growth. Thus, Hypothesis 4: There is a positive relationship between services’ spatial agglomeration and urban services growth. 3. Multiple Regression Analysis 3.1. The Data This paper selected prefecture-level cities of 30 provinc- es of china , excepting Tibet ,Hong Kong, Macao and Taiwan, municipalities. The main method of data collec- tion is the analysis of documents of official statistics. Therefore, the main sources of data are secondary data and the data source is from corresponding year of China Statistical Yearbook and China Urban Yearbook. Foreign direct investment data will be from the corresponding 2  Y. GAO ET AL. Copyright © 2013 SciRes. TI year of the "China Foreign Economic and Trade Year- book". 3.2 Variables In this study a standard regression method has been con- ducted in order to test the relationships between influen- cing factors and urban services growth because all inde- pendent variables are assumed of equal importance.. Therefore, this study used multiple regression method by taking the supply, institutional environment and services’ spatial agglomeration into consideration to make a com- prehensive analysis to test hypotheses 1-4. Hence, the multiple regression equation is : lnURBSi=α0+β1lnPIi+β2URBANi+β3lnIND i+β4DISi+ β5lnSKi+β6lnSLi+β7lnSHKi+β8lnSFPi+ β9lnFDIi+β10MARKi+β11USLQi+εi (1) where α0: the constant i: the city i βk: partial regression coefficients of independent va- riables sεi : the random disturbance URBS= urban services growth level, which is the urban services output value PI=per capita disposable income, which is the total dis- posable income divided by population URBAN= urbanization level, which is the proportion of urban non-a gricu lture population to urban total population IND=industrialization level, which is the output value of the secondary industries DIS= the level of division of labor, which is the proportion of industrial added value to total industrial output value SK=physical capital in urban services, which is the fixed capital investment in services SL= labors in urban services, which is measured by the employees in urban services HUM = human capital, which is the number of university students per ten thousand people SFP =structure of producing factors in services ,which is the ratio of value added urban services to the number of employees in service sectors FDI=the urban openness level, which is the urban foreign direct investment MARK= the urban economic market level, which is the proportion of non-state-owned economies’ output value to GDP USLQ= urban services’ concentration level, which is the index of urban services’ location quo ti ent As for the independent variable of FDI, it will firstly be converted to the value of the Renminbi using the average exchange rate of 2011 year. As for the variables of URBS, IND, FDI ,SK ,PI, they were converted into the value calculated by the constant 1978 consumer price index. Then take the natural logarithm of variables with absolute values to eliminate heteroscedasticity. 3.3. Assumptions Results of Regression 3.3.1. Linearity An examination of residual scatterplots is employed to test the assumption of linearity as suggested by Coakes&Steed(2003). If there is no clear relationship between the residuals and the predicted values, the assumption of linearity should be met. By plotting the stand ardized predicted values (ZPRED ) against the standardized residuals (ZRESID) , the result of testing linearity through scatter plot diagrams is shown in Fig- ure1 , which shows no evidence of nonlinear pattern to the residuals. Fi gur e 1 The Scatter Plot for linearity and Homoscedasticity 3.3.2. Normality The next assumption to be checked is the normality of the error term with both the normal p-p plot and the histogram of the distribution of the residuals. Figure 2 The P-P Plot of Normality Test 3  Y. GAO ET AL. Copyright © 2013 SciRes. TI The cumulative probability plots of residuals (P-P plot) Is used to judge whether the distribution of variables is consistent with a specified distribution. if the Standar- dized residuals are normally distributed, the scatters should fall on or tightly close to the normal distribution line .Figure.2 shows that the scatters of the residuals basically fall straightly on the normal distribution line, indicating a normal distribution of residual 3.3.3. Homoscedasticity The residual scatterplots could also be used to test the assumption of homoscedasticity.If there is no clear relationship between the residuals and predicted values, the assumption of homoscedasticity should also be met. In this study , by plotting the standardized resi- duals against the predicted values as shown in figure1 , the researcher found there was no clear relationship between the residuals and the predicted values. Therefore, the results suggest that the assumption of homoscedatisity should be met in this study 3.3.4. Mult icollinea rity Multicollinearity test is important because if multicolli- nearity exists between two or more independents va- riables it can deteriorate the results of multiple regression. In this study, multicollinearity has been examined be- tween the independents variables using VIF as shown in Tab le 1 Table 1. Tolerance Value and the VIF of variables Variables Collinearity statistics Tolerance VIF LnSFP lnIN D 0.257 0.158 3.898 6.333 Ln SL 0.187 5.345 LnUS LQ Ln SK 0.421 0.193 2.373 5.169 Ln PI Ln FDI MARK 0.244 0.343 0.841 4.105 2.914 1.189 D IS 0.887 1.128 URBAN 0.534 1.873 LnHUM 0.314 3.186 The result in Table1 indicates that multicollinearity does not exist among all independent variables because the Tolerance values are more than .10 and VIF values are less than 10. The result suggests that the current study does not have any problem with multicollinearity and this allows for standard interpretation of the regression coefficients. 4. OLS Estimation of the Model In this model, R² value for the first stage of analysis re- gression model is 0.967 (refer to Table2), which means that the influencing factors explain 97 per cent of the variance in the urban services growth. Standard multiple regression also provides an adjusted R² value. The ad- justed R² value in this model was 0.966, indicating a pretty well fitness of the model. ANOVA was used to assess the statistical significance of the result. The result in Table 3 demonstrates that the null hypothesis that the multiple R in the population is equal to 0 is rejected since the model of this study is sta- tistically significant at p= .000). Tabl e 2 Model Summary Mod el R R Square Adjusted R Square Std. Error of the Estimate D.W 1 .984 a .967 .966 .17497479 2.011 Tabl e 3 ANOVA Model Square Sum df Mean Squar e F Sig. 1 Regres- sion 231.990 11 23.19 9 757.737 .000 a Residual 7.838 256 .0031 Total 239.828 266 a. Predictors: (Constant), DIS, MARK, LnFDI, USLQ, URBAN, LnHUM, LnSL, LnSFP, LnPI LnSK, LnIND b. Dependent Variable: LnURBS Table 4 coefficients Variab les Unstandar- dized Coeff i ci e nts Standardize d Coeff i ci e nts t Sig. B Std. Error Beta 1 (C) -0.11 7 0.195 -0.597 0.551 LnSFP LnIND 0.869 0.406 0.021 0.033 0.433 0.394 41.720 12.358 0.000 0.000 LnSL 0.342 0.029 0.344 11.885 0.000 LnUS LQ LnSK 0.22 6 0.111 0.017 0.029 0.233 0.110 13.388 3.902 0.0000 0.000 LnPI LnFD I MARK 0.110 0.090 0.002 0.023 0.018 0.001 0.109 0.090 0.031 4.776 4.964 2.842 0.000 0.000 0.014 D IS 0.501 0.802 0.007 0.625 0.533 URBAN 0.05 6 0.036 0.024 1.5 63 0.119 LnHUM 0.073 0.065 0.023 1.133 0.258 As can be seen from Table 4, the R² was statistically significant, with F =757.737 and p < .001, the common expression of the regression equation is stated as follows: 4 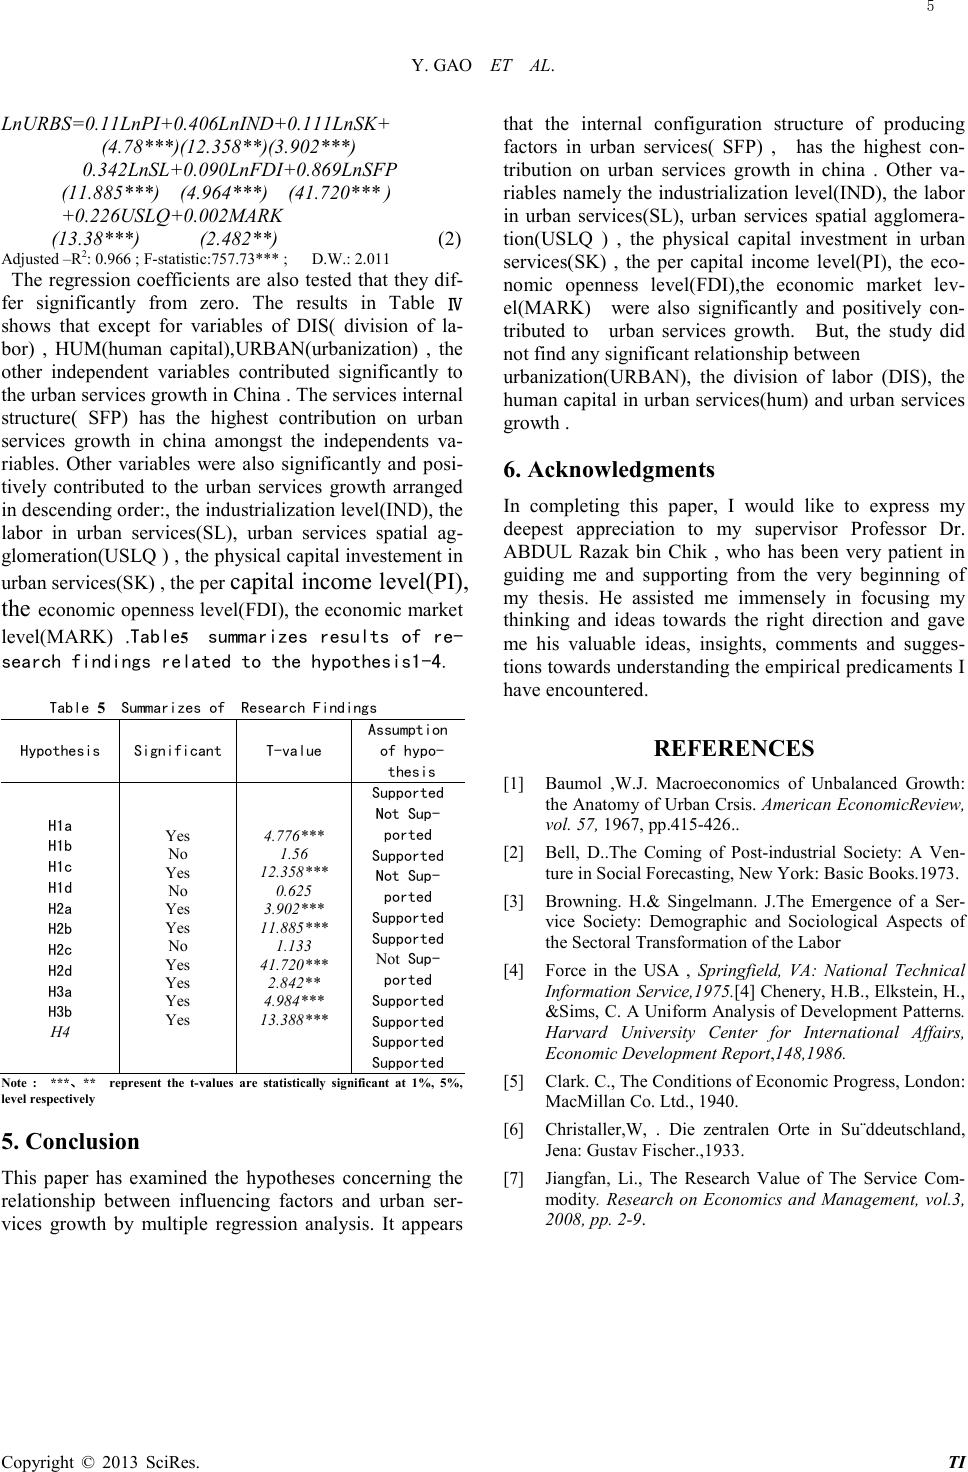 Y. GAO ET AL. Copyright © 2013 SciRes. TI LnURBS=0.11LnPI+0.406LnIND+0.111LnSK+ (4.78***)(12.358**)(3.902***) 0.342LnSL+0.090LnFDI+0.869LnSFP (11.885***) (4.964***) (41.720*** ) +0.226USLQ+0.002MARK (13.38***) (2.482**) (2) Adjusted –R2: 0.966 ; F-statistic:757.73*** ; D.W.: 2.011 The regression coefficients are also tested that they dif- fer significantly from zero. The results in Table Ⅳ shows that except for variables of DIS( division of la- bor) , HUM(human capital),URBAN(urbanization) , the other independent variables contributed significantly to the urban services growth in China . The services internal structure( SFP) has the highest contribution on urban services growth in china amongst the independents va- riables. Other variables were also significantly and posi- tively contributed to the urban services growth arranged in descending order:, the industrialization level(IND), the labor in urban services(SL), urban services spatial ag- glomeration(USLQ ) , the physical capital investement in urban services(SK) , the per capital income level(PI), the economic openness level(FDI), the economic market level(MARK) .Table5 summarizes results of re- search findings related to the hypothesis1-4. Table 5 Summarizes of Research Findings Hypothesis Significant T-value Assumption of hypo- thesis H1a H1b H1c H1d H2a H2b H2c H2d H3a H3b H4 Yes No Yes No Yes Yes No Yes Yes Yes Yes 4.776* ** 1.56 12.358 *** 0.625 3.902* ** 11.885 *** 1.133 41.720 *** 2.842** 4.984* ** 13.388 *** Supported Not Sup- ported Supported Not Sup- ported Supported Supported Not Sup- ported Supported Supported Supported Supported Note : ***、** represent the t-values are statistically significant at 1%, 5%, level respectively 5. Conclusion This paper has examined the hypotheses concerning the relationship between influencing factors and urban ser- vices growth by multiple regression analysis. It appears that the internal configuration structure of producing factors in urban services( SFP) , has the highest con- tribution on urban services growth in china . Other va- riables namely the industrialization level(IND), the labor in urban services(SL), urban services spatial agglomera- tion(USLQ ) , the physical capital investment in urban services(SK) , the per capital income level(PI), the eco- nomic openness level(FDI),the economic market lev- el(MARK) were also significantly and positively con- tributed to urban services growth. But, the study did not find any significant relationship between urbanization(URBAN), the division of labor (DIS), the human capital in urban services(hum) and urban services growth . 6. Acknowledgments In completing this paper, I would like to express my deepest appreciation to my supervisor Professor Dr. ABDUL Razak bin Chik , who has been very patient in guiding me and supporting from the very beginning of my thesis. He assisted me immensely in focusing my thinking and ideas towards the right direction and gave me his valuable ideas, insights, comments and sugges- tions towards understanding the empirical predicaments I have encountered. REFERENCES [1] Baumol ,W.J. Macroeconomics of Unbalanced Growth: the Anatomy of Urban Crsis. American EconomicReview, vol. 57, 1967, pp.415-426.. [2] Bell, D..The Coming of Post-industrial Society: A Ven- ture in Social Forecasting, New York: Basic Books.1973. [3] Browning. H.& Singelmann. J.The Emergence of a Ser- vice Society: Demographic and Sociological Aspects of the Sectoral Transformation of the Labor [4] Force in the USA , Springfield, VA: National Technical Information Service,1975.[4] Chenery, H.B., Elkstein, H., &Sims, C. A Uniform Analysis of Development Patterns. Harvard University Center for International Affairs, Economic Development Report,148,1986. [5] Clark. C., The Conditions of Economic Progress, London: MacMillan Co. Ltd., 1940. [6] Christaller,W, . Die zentralen Orte in Su¨ddeutschland, Jena: Gustav Fischer.,1933. [7] Jiangfan, Li., The Research Value of The Service Com- modity. Research on Economics and Management, vol.3, 2008, pp. 2-9. 5 |