Journal of Biophysical Chemistry
Vol.2 No.3(2011), Article ID:6791,8 pages DOI:10.4236/jbpc.2011.23040
Modulation of CNS excitability by water movement. The D2O effects on the non-linear neuron-glial dynamics
1Centro de Biotecnologia, Instituto de Pesquisas Energéticas e Nucleares CNEN/IPEN-SP, Sao Paulo, Brazil;
2Universidade de São João, Del Rei-Campus de Divinópolis, Sao Joao del Rei, Brazil;
3Institut of Physiology, Department Membrane-Physiology, University of Hohenheim, Stuttgart, Germany; *Corresponding Author: wolfgang.hanke@uni-hohenheim.de
Received 15 May 2011; revised 30 June 2011; accepted 6 July 2011.
Keywords: Retinal Spreading Depression; D2O; Neuron-Glial-Dynamics
ABSTRACT
Macroscopic spatiotemporal patterns arising in grey matter may explain the clinical manifestations of several functional neurological syndromes (migraine aura, epilepsies). Detailed descriptions of these patterns in central grey matter and their physicochemical or pharmacological manipulations can be useful in many scientific fields ranging from drug design to functional brain imaging. These evanescent dynamic structures are electrochemical in nature and show macroscopic tissue polarization due to coupled and macroscopic flow of ions and water across, along and between neuronal and glial membranes. So far the importance of the water flow in the CNS functional syndromes has been examined by manipulations of water channels aquaporines (AQP). In this paper we show the result of substituting H2O for D2O in retinal spreading depression experiments. This inverts the present logic by changing the flow in the water channels in intact tissue and observing the evolution of electrochemical patterns and recording the optical profiles of excitation waves in isolated chick retinas. D2O flow through AQPs is ~20% slower than that of H2O. The slower flux disturbs the tight coupling between ion and water flows across membranes and slowdown the Na-KATPase rate of change with metabolic consequences for the tissue. The whole tissue excitability shifts in a non-stationary manner toward a non-excitable state.
1. INTRODUCTION
Functional syndromes such as migraine aura, epilepsies, transient global amnesia may be the clinical expression of dynamic structures that emerge in the central nervous system (CNS) due to its intrinsic properties. This assumption is in agreement with the conceptual framework of the brain as an excitable media. The brain has all the properties of excitable media: it is thermodynamically open and maintained far away from equilibrium. Its processes are full of positive and negative feedback mechanisms, its micro-processes are cooperative and its emergent properties can be modulated by weak external forces. Therefore, emergent low dimensional temporal and spatial patterns in the form of oscillations and excitation waves are to be expected in the brain. The vertebrate retina is in the words of Dowling “An Approachable Part of the Brain” [1]. The inner retina is central gray matter derived from the embryonic diencephalon. Thus, the above arguments do apply to the retina, too. In 1958 Gouras discovered that self-organized wave propagation could be visualized macroscopically in in vitro retinas. Over the next decades knowledge about self-organization in neuronal tissue has been collected using the retinas as experimental model [2-9] and non-linear thermodynamics as the theoretical context to interpret the data [5-12]. We decided to observe the changes in tissue dynamics caused by changes in water movements using the intrinsic optical signals (IOS) of excited states in in vitro retinas—particularly the optical profiles of retinal spreading depression waves (RSDs)— and their response to substitution of H2O by D2O as solvent in the maintenance solution of the experimental preparation, in order to make inferences about short-term macroscopic water flow and tissue excitability.
The discovery of the water channels—aquaporines (AQPs)—motivated research on the role of water movements in the physiopathology of functional syndromes, particularly the role of the AQP4 isoform expressed in astrocytes and Müller cells [13-16]. These experiments have either used knockout mice for the APQ channels or observed changes in the expression of these channels at the tissue level with histochemical techniques, and their relation to clinical expression of functional syndromes. We made the conjecture that D2O macroscopic flow would alter optical profiles of excitation waves in retinas based on 1) the fact that D2O flow through AQP channels is slower than H2O [17] (~20% slower); 2) D2O is long known in biology to slow down oscillations [18,19]. In nervous tissue its effects were attributed to the slowing done of the sodium pump [20]; 3) our own previous results with glycerol and temperature manipulations [9,21] of in vitro retinas; 4) the tight coupling in CNS between active salt transport and glycolisys [22,23] and the matching between first and second optical components of RSDs IOS and electrochemical gradients dissipation and increased glycolysis induced by ATP expenditure in the tissue respectively [6,24].
As an additional proof of concept, the retina experiments results were compared to a parallel series of experiments performed with the Belouzov-Zabothinsky reaction system [25]. The qualitative changes observed in both systems were equivalent, suggesting the predominance of solvent effects of D2O on the dynamics of both excitable media.
2. MATERIALS AND METHODS
2.1. Preparation of the Eye-Cup
For the experiments chicken in the age from 5 to 21 days were used. After decapitation the eyes are removed out of the eye socket. Eyes are sectioned close to the equator and vitreous body is removed with a tweezers. The posterior eyecups are immersed in Ringer solution. The eyecups are then glued each in a Petri dish and put in the set up where they are perfused with Ringer solution. Before the measurements started the retinas are allowed to recover for 30 min.
2.2. Ringer Solution
The solution used to perfuse the isolated retinas has the following composition: 100 mM NaCl; 6 mM KCl; 1 mM MgSO4; 1 mM CaCl2 2H2O; 30 mM NaHCO3; 30 mM glucose AND 10 mM TRIS with the pH adjusted to 7.4.
2.3. Materials
All chemicals used were obtained at least at p.a. grade at Sigma, Aldrich or Merck. Water was from a laboratory distillery and D2O was acquired from Sigma.
2.4. Set-up
The setup is enclosed in a Faraday cage in which a camera and a photomultiplier are aimed at the central retina region through a microscope. Electrical recordings were performed with extracellular glass microelectrodes (tip diameter around 10 mm, filled with potassium solution) inserted in the retina using a micromanipulator under optical control. The positioning was aimed to the inner plexiform layer. The electrical potential of the tissue relative to the bathing solution was measured then with a high impedance amplifier connected to an Ag/ AgCl-electrode in the glass micropippete versus another Ag/AgCl coil wire electrode immersed in the bath (reference electrode). The electrode amplifier output was digitized at 10 Hz and stored in a computer. The retina was maintained under perfusion at 1 ml/min rate and at 30˚C temperature. The digitized camera output had the electrode output superimposed before storage in a DVD recorder.
2.5. Recordings
Figures 1 and 2 show the preparation and the recording procedure. In Figure 1 the panoramic view of a circular solitary wave of retinal spreading depression (RSD) is shown. The wavefront is seen approaching the tip of the pecten in central retina. The pecten is the black structure supposed to supply O2 and nourishment to the avascular retina. This circular wavefront will invade the whole retina homogeneously.
Figure 2 shows the central retina region with a glass electrode inserted. Superimposed on the digitized camera output, a time series shows the temporal evolution of the field potential around the electrode tip. Upper row of photos: a RSD wave approaches the electrode and field potential begins to change; next the field potential reaches its peak value. Lower row: the field potential recovers to the baseline value; next the frame shows the moment when the second component of the optical profile of the RSD reaches peak. Note that this component has no clear field potential correspondence. The graphs on the side and below the photos detail the optical profile of circular RSDs recorded at 30˚C. On the side, the field potential and the optical changes in a matrix of 10 × 10 pixels (~50 µm × 50 µm) at the tissue over the tip of the electrode are given. The mean brightness of the pixel matrix is calculated and stored as time series.
The simultaneously recorded time series show the close relation between field-potential and IOS rising phase. Below the photos two complete profiles of RSDs are shown at two different space scales: the upper row
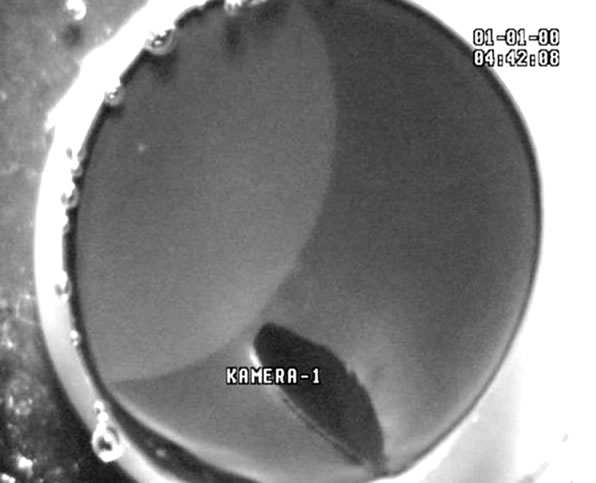
Figure 1. The photo shows the experimental preparation with a solitary and circular RSD wave spreading from the peripheral retina toward the centre. The bottom of the petry dish and the posterior half of the eyecup is seen from above by a camera. The sclera was glued to the bottom of the Petri dish and the dish filled with standard retinal Ringer solution. The panoramic view of the RSD wave shows the changes of the optical properties of the tissue (increase in light scatter) that makes the IOS. At the wavefront the tissue is in the excited state, the transparent tissue in front of it is in quiescence and behind the wave the tissue it is refractory to stimulation. Note the black structure that reaches the central retina. It is the pecten, covered by pigmented epithelium and very rich in blood vessels. It is a natural barrier that splits RSD waves. Note at the bottom of the eyecup a piece of pigment epithelium and the out of focus patch of retina that separated from it. The mean spread velocity of such waves recorded at 30˚C is 3 mm/min and they invade the whole retina in about 3 minutes. The quiescent retina is turned excited by a light mechanical touch that leaves a spot of damaged tissue at the peripheral retina.
shows the mean brightness of a 10 × 10 matrix and the lower row the digitized output from the photomultiplier that samples a circular area with about 1mm diameter. Note the dissimilar rising phase of the first optical component and the similarity of the rising and shape of the second optical component at different space scales.
2.6. Protocol
After successful insertion of the microelectrode in the innerplexiform layer, one control RSD was elicited mechanically and at the end of the optical profile record the normal solution was changed to the deuterium solution. The pumping rate was increased tenfold until the total volume of the perfused solution was three times the Petry dish volume. Then the pumping rate returned to the slow 1 ml/min rate. After one or two hours the solution was changed back to water solution.
3. RESULTS AND DISCUSSION
3.1. Global System Behavior
The motivation for these experiments was the discussion in the literature about excitability in closed human cortex versus in vitro retina or open rodent cortices [26]: it was conceivable that rare spatiotemporal patterns in one experimental condition would be the most probable in another, hence the challenge of turning an in vitro retina model closer to the in situ cortex. We knew that in in-situ retinas the wave propagation pattern was more similar to closed circles compared to the calculated wave segments from patients with migraine [26,27]. We predicted that deuterium effects would shift the global excitability of the system towards a less excitable situation by disturbing the tight coupling between ionic and water flow in and out of cells. According to Pittendrigh et al. [18], the physicochemical properties of D2O-(increase in viscosity) lower self-diffusion due to increased mass and different dissociation constant, would change ion mobility and stabilize the hydrophobic interaction in biopolymers, thus interfering in the tertiary and quaternary structure of protein complexes (and the electrochemical properties of the polyelectrolyte glycosaminoglycans— GAGs—of the extracellular matrix and basement membranes). Thus the solvent effects of deuterium would affect the system globally, disturbing macroscopic organized flows of ions and water and in consequence changing metabolism [22-24]. The D2O effect on the Na+/K+-ATPase [18] predicted a long lasting recovery of the first peak and a longer interval between the first and second optical peaks of the IOS profile. The Q10 of the IOS duration is 5—similar to the sodium pump Q10— and the pumping rate by this protein complex is slowed down by D2O in axons [18]. The foremost effect of the deuterium solutions in the two experimental models of excitable media we observed (retinas and B-Z) was a strong induction of non-stationarity and quick shift toward non-excitable state [27]. In our standard conditions with slow perfusion at 30˚C, the tissue transparency (measured as the baseline value of the photomultiplier output) increases only 2% to 3% in 8 to 10 hours, even with RSDs elicited each 20 minutes. Also in these conditions the retinas remain quiescent but readily responsive to mechanical, electrical or chemical stimuli and the shape and propagation pattern and velocity of RSDs remains stable, suggesting steady state conditions. By contrast, within seconds after the exchange to the deuterium solution and its contact with the basement membrane that covers the endfeet of the Müller cells, RSD waves were induced usually at the peripheral retina. Initially circular, they become self-organized spirals or segmentary and collapsing waves. Collapsing waves and
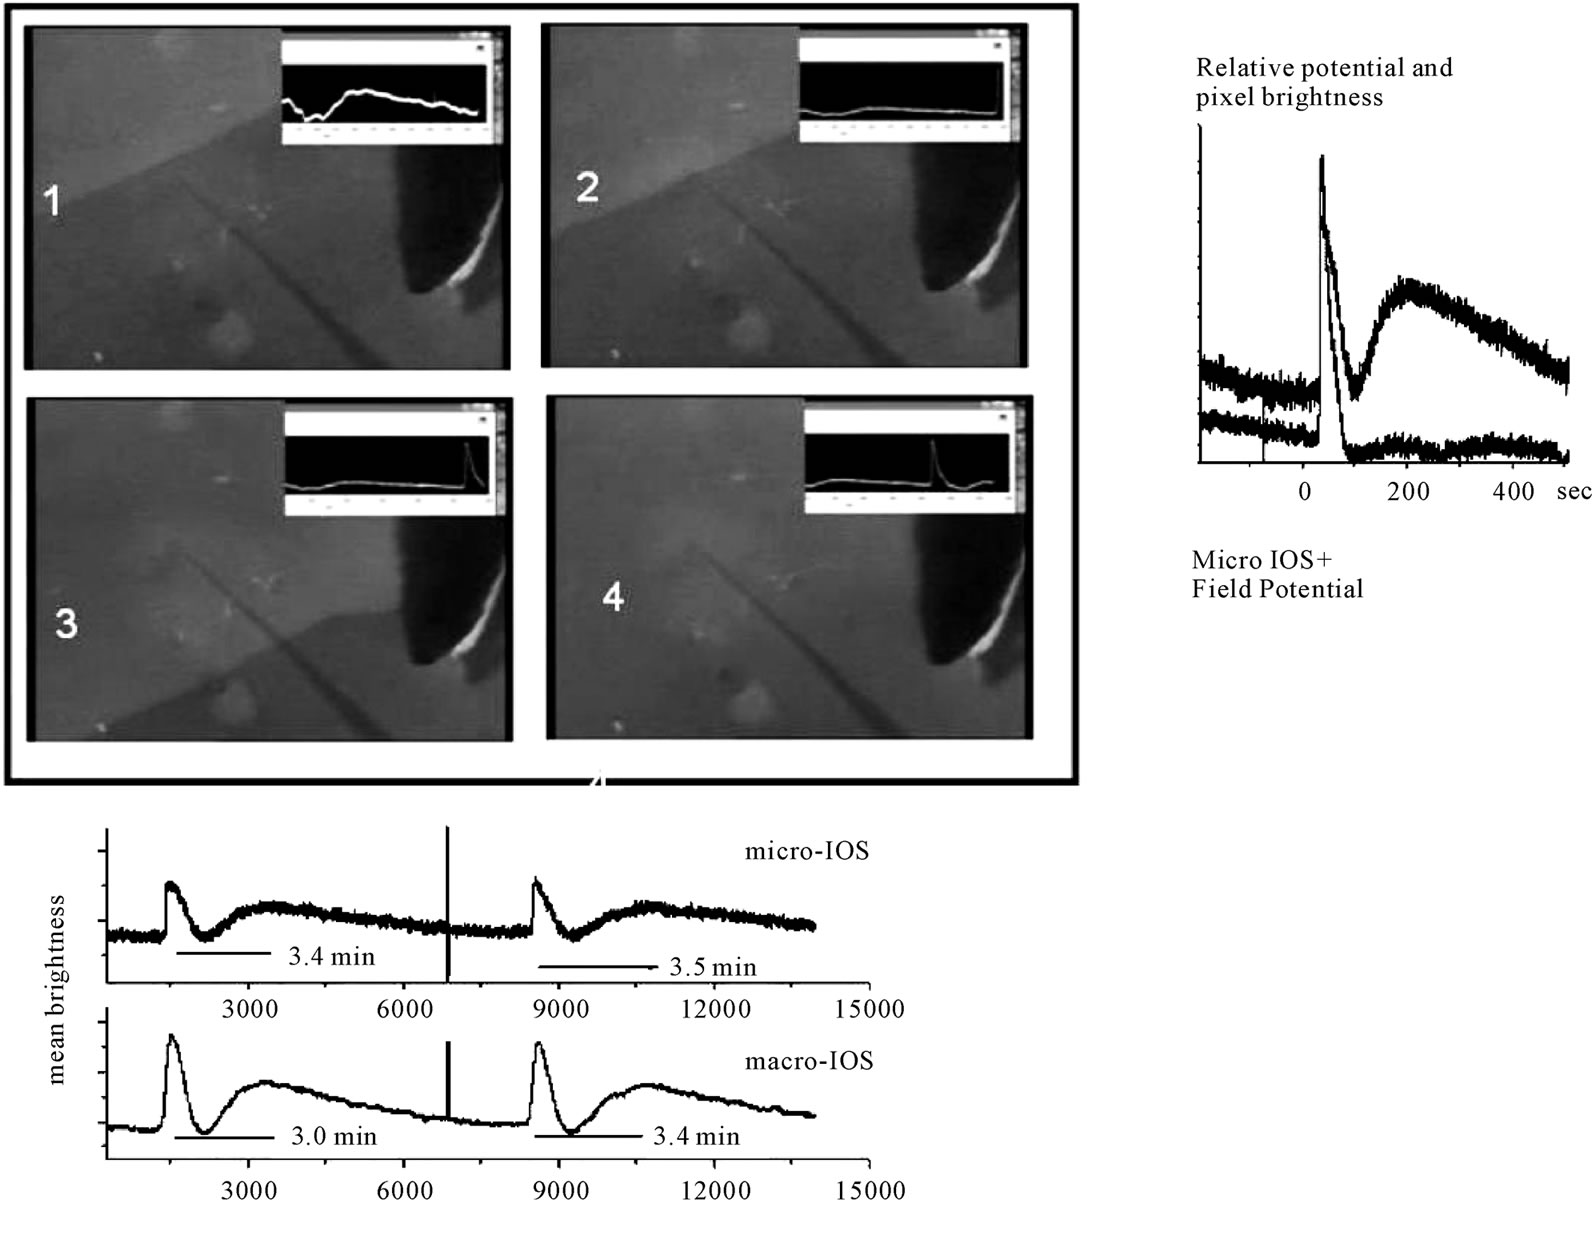
Figure 2. The 4 frames show the computer combined output of a camera and the amplified output of a microelectrode inserted in the inner plexiform layer showing the central retinal tissue. The glass electrode is harder to see than its dark shadow. The horizontal total length in each frame is 2.7 mm. First row 1: The frame shows the moment when the electrode senses the field of the approaching wave; 2, the moment when the extracellular field around the electrode tip reaches the peak of 20 m; lower row 3: the frame shows the moment when the baseline extracellular potential is back at pre-wave values; and finally, 4, when the second component of the optical profile is at the peak. The complete optical profile of control RSD wave and the concomitant extracellular potential drop is shown on the side of the frames. The two time series were recorded simultaneously with a sampling rate of 10 Hz. The upper curve shows the mean brightness of a small matrix of pixels (10 × 10 pixels or 50 µm sidelength) overlying the electrode tip and the lower curve the field potential. The two graphs were superimposed and show that the field potential leads slightly the optical signal (microscopic IOS) but the two peaks coincide. The second optical component has no obvious field concomitant, in contrast with the first optical component; it rises gradually and is smaller in amplitude than the firs component. This is the most probable profile pattern for control waves. Below the 4 frames we show the temporal evolution of an experiment in which 2 successive waves were elicited mechanically. Note the optical artefact in both graphs before the second wave. The two time series, simultaneously recorded, show the amplified photomultiplier output and the mean brightness of a small pixel matrix (10 × 10 pixels or 50 µm sidelength). The photomultiplier counts the photons in a circular area of about 1mm diameter in the central retina in which the small matrix represents a very small portion. Note the abrupt rise of the first optical peak in the microscopic scale and the smooth rise in the macroscopic IOS first peak. By contrast, the second optical component has the same shape in both space scales.
spontaneous standing patterns are rare events in our standard experimental situation, although standing patterns around lesions are frequent, and called “penumbra zones”. The same statement is true for the B-Z system: we only saw standing patterns with deuterium as solvent in the system [27].
3.2. Optical Profiles under D2O Influence
The deuterium solution was applied to seven retinas and in five the pattern observed is the one shown in Figure 3.
The other two developed excitoxic responses and were dead within the first hour as shown in Figure 4.
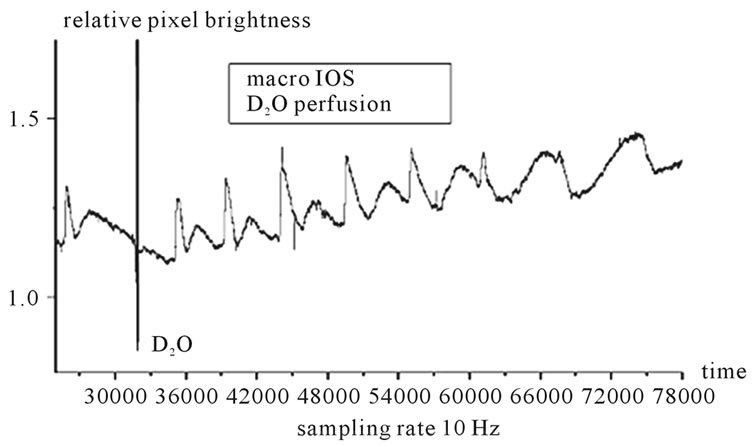
Figure 3. Long time series showing the photomultiplier output (10 Hz sampling rate) during the recording of a deuterium solution experiment. A control wave optical profile is shown before the artefact due to the turbulence of the fast rate deuterium solution substitution of the water solution. Then, a series of “spontaneous waves” invade the central retina Note the marked non-stationarity in the shape of these waves. The third wave profile is the result of a collision of two waves at the central region. Note the dampening of the first component and the widening of the interpeak interval in the successive waves profiles (the interpeak interval is a good measure of absolute refractoriness within the titisue). The widening of the interpeak interval is concomitant with diminishing of the first optical peak (that signals electrochemical gradients dissipation) turning the profile to a “dark” profile at the seventh wave. The sampling rate was 10 Hz (600 points = 1 minute).
The long time series shown in Figure 3 displays the RSDs IOS recorded in one experiment. The record begins at 40 minutes of the recording window with the optical profile of a control RSD and ends 90 minutes later after a series of RSDs invaded the central region sampled by the photomultiplier. At the end of the control wave profile optical artefacts show the record of the turbulence in the system due to the fast pumping rate of the D2O solution. Within seconds of the contact between the D2O solution and the basement membrane of the retinal vitreal interface, RSDs were induced. Initially circular, waves from the border could collide in the central region (third wave in the series is a collision of two fronts) then the wavefronts became irregular. Besides the irregular wavefronts, the profiles showed gradual increase of the delay between the first and second optical components, together with gradual disappearance of the first peak in the IOS. Discussions of the details of individual profiles are beyond the scope of this paper and will be discussed in another context about propagating waves and excitoxic responses in retinas.
The interpeak interval in the optical profiles showed gradual increase; usually it was doubled after 40 minutes of retinal exposition to deuterium solution Glycerol and a lowering step in temperature also increase the interpeak interval [9,21]. While the temperature effect is mainly attributable to the sodium pump (Q10 = 5) and does not disturb coupling in the system, the glycerol effect more probably is caused by the AQPs channels activity. The AQPs linked to functional syndromes are AQP4 and AQP9, both expressed in glia [14-16] and in the Müller cells their expression appears to follow the surface to volume ratio of membranes, being heavy at the vitreous retina border and in the innerplexiform layer [15,16]. The AQP9 channel is permeant to water, glycerol and lactic acid. The later is very closely associated with the kinetics of the second peak of the RSD IOS and with neuronal-glial interactions [4,24]. The deuterium and glycerol solutions are likely to disturb the coupled flows of ions and water and lactic acid. For this reason, whereas low temperature increases the amplitude of the second optical peak of the IOS, deuterium and glycerol tend to depress the amplitude. At the limit of the system toward non-excitability, the second component can be absent.
The other two retinas of this experimental series developed excitotoxic responses to deuterium and were dead within one hour of exposition to the deuterium solution. The recordings of one of these experiments are summarized in Figure 4. The three time series were simultaneously recorded and the one labelled macroscopic IOS shows the photomultiplier outpu. The field potential is the microelectrode/amplifier system output. Additionally the microscopic IOS, the mean brightness of a 10 × 10 pixel matrix, overlaying the electrode tip (best experimenter guess) is given in arbitrary units. Note that in the first optical time series, the baseline transparency of the tissue changes very quickly compared to the pattern show in Figure 3, in which the loss of transparency shows slow steadily growth. The two artefacts labelled S1 and S2 show the mechanical stimulation followed by two RSDs. In the first of these waves the first optical peak is similar to controls (see Figure 2) at both spatial scales and the field potential also has the amplitude and shape of control waves. There was no discernible second optical component at either spatial scale. The second RSD shows an increase in the duration of the first optical peak with slow recovery phase and depressed amplitude of the field potential which shows slow and two phase recovery. A second optical peak can be seen after a 15 minutes interval at the microscopic scale IOS only. This interpeak interval is five fold the one measured in control conditions (see Figure 2), also the shape and amplitude of this component is altered and small compared to controls. The alterations in the shape of the IOS are similar but more marked in these two retinas (from the same animal) than in the other five, suggesting marked uncoupling of ionic and solvent flows followed by disruption of the homeostatic metabolic response to the dissipation of electrochemical gradients at wave onset
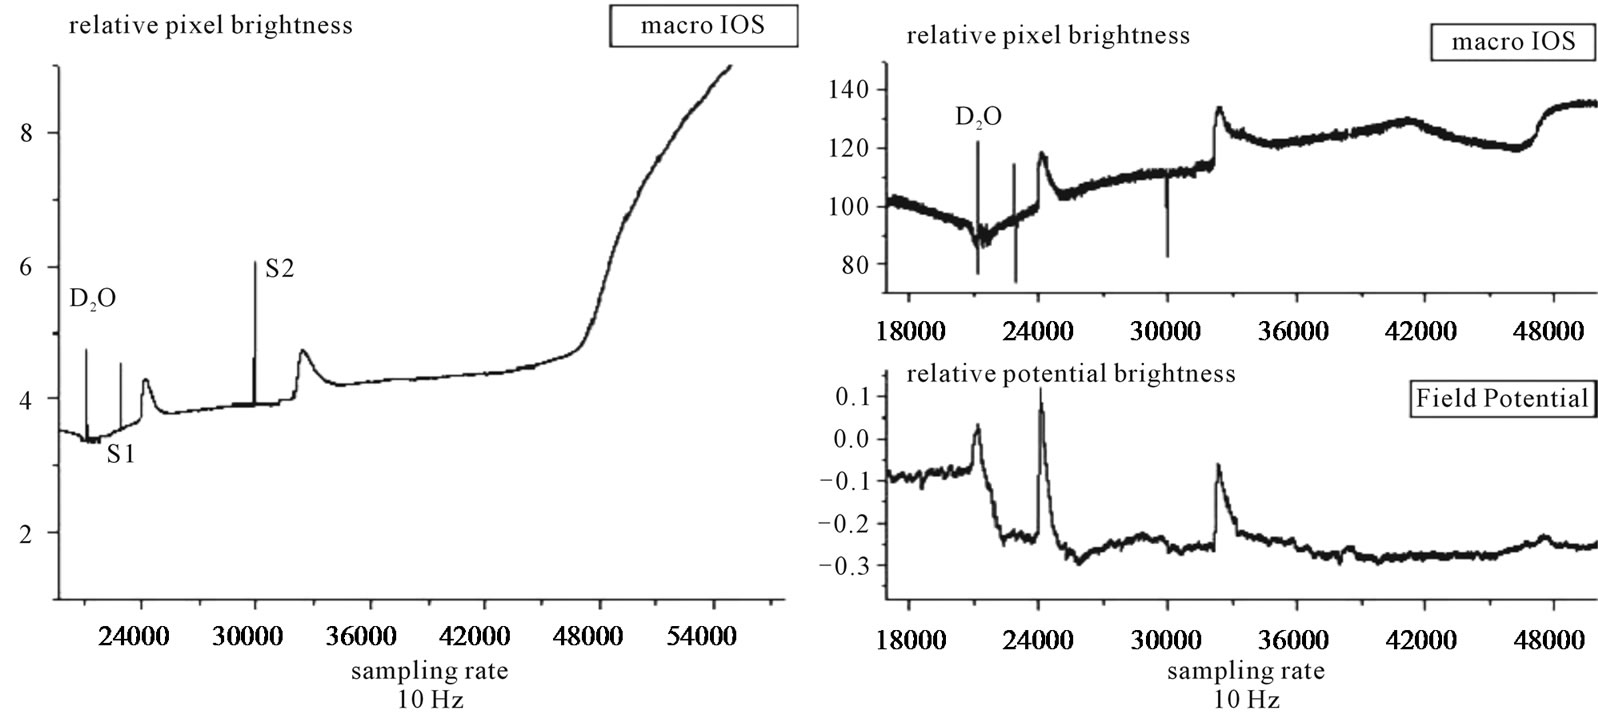
Figure 4. Three simultaneously recorded time series of a deuterium experiment in which the whole retina died within 2 hours of deuterium solution perfusion. The graph on the left of the figure shows the photomultiplier output. On the right the upper graph shows the microscopic IOS—i.e. the mean brightness of 10 × 10 pixel matrix—and the lower graph the field potential—microelectrode and amplifiers output. The record begins at 30 minutes recording time, after one control wave and follows the optical and electrical changes in the tissue for the next 90 minutes (right graph). Note that at the time of the ramp rise in the macroscopic optical signal, a step rise can be seen at the microscopic space scale, demonstrating that the photomultiplier output represents the integral sum of the microscopic IOS. The field potential time series first linear shift follows the interaction of the deuterium solution with the silver/silver chloride reference electrode and it is of the same order of magnitude as is the RSD extracellular potential drop and with no measurable latency in our recording system, showing the power of electrochemical interfacial interactions of the deuterium/water solvent substitution. Note the halving of the amplitude of the field potential and the slowing down of the recovery of both field potential and microscopic IOS suggesting that structural tissue changes follow the charge movement within the tissue.
[6,24,28]. The fast linear rise in the photomultiplier time series marks the onset of the excitotoxic tissue response that culminated in tissue death. This linear growth looks the same irrespective of the origin of the excitotoxicity (v.g. glutamate or ouabain, data not shown). Note that at amicroscopic scale a step is observed and the photomultiplier output, then the macroscopic signal represents the integration of thousands of such steps arising in short sequence within central retina. At the beginning of the field potential time series, a linear fast shift of the baseline is observed. This shift follows a potential drop at the silver/silver-chloride coil reference electrode. Our recording arrangement makes the maintenance fluid to enter the chamber at the bottom and be sucked out at upper border of the Petry dish. Thus long before the solution touch retina surface, the reference electrode contacts it. This electrochemical shift at the electrode solvent interface has the amplitude of ~15 mV and shows the potential of the electrochemical effects of the deuterium solution at charged interfaces.
4. CONCLUSIONS
The conceptual framework of excitable applied to the non-linear neuronal-glial dynamics permits the prediction of the qualitative system response to non-local physico-chemical manipulations as was the case of the experiments just described. This statement is of importance just because a leading role for glia is not conceived as self-organizing mechanism in the majority of neuroscience thinking. For example, a recent review on cortical waves has no mention to glia contribution in these excitation waves [29]. The water channel AQP4 is heavily expressed at the astrocytes and Muller cells endfeet bordering brain and vitreous humour with external faces inserted in the basement membrane; this localization suggested a prominent role of this channel in water movement in and out of CNS. Because the observed effects of deuterium were very fast, glia associated responses initiated the whole system excitability shifts induced by the solvent. Very recently, glial initiated excitoxic responses have been described [30,31], although the role of glia in the excitability control of the inner retina was proposed in the early seventies of last century [1] in the context of tissue potassium dynamics and excitability control that we used in the interpretation of retinal experiments [32]. The coupling of macroscopic flows of ions and water is at the core of the electrochemical evanescent structures as predicted by Katchalsky [10-12] and the tight coupling between active ion transport and glycolysis can be affected by the AQPs activity disturbance as demonstrated by the glycerol and deuterium effects on the IOS of in vitro retinas. This organized macroscopic flow happens across, along and between glial and neuronal membranes and can be expressed as standing patterns, waves or oscillations.
REFERENCES
- Dowling, J. (1987) The retina, an approachable part of the brain. Harvard University Press, Cambridge.
- Gouras, P. (1958) Spreading depression of activity in amphibian retina. American Journal of Physiology, 195, 28-32.
- Martins-Ferreira, H. and De Castro, G.O. (1966) Light scattering changes accompanying spreading depression in isolated chicken retina. Journal of Neurophysiology, 29, 715-726.
- De Castro, G.O., Martins-Ferreira, H. and Gardino, P.F. (1985) Dual nature of the peaks of light scattered during spreading depression in chick retina. Anais da Academia Brasileira de Ciências, 57, 95-103.
- Do Carmo, R. and Martins-Ferreira, H. (1984) Spreading depression of Leão probed with ion-sensitive electrodes. Anais da Academia Brasileira de Ciências, 56, 401-421.
- Fernandes de Lima, V.M. and Hanke, W. (1997) Excitation waves in central gray matter: The retinal spreading depression. Progress in Retinal and Eye Research, 6, 657-690.
- Peixoto, N.L.V., Fernandes de Lima, V.M. and Hanke, W. (2001) Correlation of the electrical and intrinsic optical signals in the chicken spreading depression phenomenon. Neuroscience Letters, 299, 89-92.
- Wiedemann, M., De Lima, V.M.F. and Hanke, W. (2001) Gravity dependence of waves in the retinal spreading depression and in gel type Belouov-Zabothinsky systems. Physical Chemistry Chemical Physics, 4, 1370-1373. doi:10.1039/b109166m
- Weimer, M.S. and Hanke, W. (2005) Correlation between the durations of refractory period and intrinsic optical signal of spreading depression during temperature variations. Experimental Brain Research, 161, 201-208. doi:10.1007/s00221-004-2060-5
- Katchalsky, A. (1971) Carriers and specificity in membranes. VI Biological flow structure and their relation to chemodiffusion coupling. Neurosciences Research Program Bulletin, 9, 397-413.
- Katchalsky, A. (1975) Concept of dynamic patterns. Neurosciences Research Program Bulletin, 12, 11-26, 30-52.
- Katchalsky, A. (1971) Polyelectrolytes and their biological interactions. Biophysical Journal, 4, 9-41.
- Tait, M.J., Saadoun, S., Bell, A. and Papadopulos, M.C. (2007) Water movement in the brain: Role of aquaporins. TRENDS in Neurosciences, 31, 27-43.
- Binder, D. and Steinhauser, C. (2006) Functional changes in astroglial cells in epilepsy. Glia, 54, 358-368. doi:10.1002/glia.20394
- Panicke, T., Iandiev, I., Uckermann, O., Biedermann, B., Kutzera, F., Wiedemann, P., Wolburg, H., Reichenbach, A. and Bringmann, A. (2004) A potassium channel linked mechanism of glial cell swelling in the postischemic retina. Molecular and Cellular Neuroscience, 26, 493-502. doi:10.1016/j.mcn.2004.04.005
- Goodyear, M.J., Crewther, S.G., Murphy, M., Giumarra, L., Hazi, A., Junghans, B.M. and Crewthers, D. (2010) Spatial and temporal dissociation of AQP4 and Kir4.1 expression during induction of refractive errors. Molecular Vision, 16, 1610-1619.
- Mamonov, A.B., Coalson, R.D., Zeidel, M.L. and Mathai, J.C. (2007) Water and deuterium oxide permeability through aquaporin-1: MD predictions and experimental verification. The Journal of General Physiology, 130, 111-116. doi:10.1085/jgp.200709810
- Pittendrigh, C.S., Caldarola, P.C. and Cosbey, E.S. (1973) A differential effect of heavy water on temperature dependent and temperature compensated aspects of the circadian system of the drosophila pseudoobscura. Proceedings of the National Academy of Sciences of the United States of America, 70, 2037-2041. doi:10.1073/pnas.70.7.2037
- MacDaniel, M., Sulzman, F.M. and Hastings, J.W. (1974) Heavy water slows the Goniaulax clock: A test of the hipothesys that D2O affects circadian oscillations by diminishing the apparent temperature. Proceedings of the National Academy Sciences of the United States of America, 71, 4389-4391. doi:10.1073/pnas.71.11.4389
- Landowner, D. (1987) D2O and the sodium pump in squid nerve membrane. Journal of Membrane Biology, 96, 277-281. doi:10.1007/BF01869309
- Fernandes de Lima, V.M., Weimer, M. and Hanke, W. (2002) Spectral dependence of the intrinsic optical signal of excited states of central gray matter and conformational changes at membrane interfaces. Physical Chemistry Chemical Physics, 4, 1374-1379. doi:10.1039/b109914k
- Whittam, R. (1962) The dependence of respiration of brain cortex on active ion transport. Biochemical Journal, 82, 205-212.
- Whittam, R. and Blond, D.M. (1964) Respiratory control by an adenosine triphosphatase involved in active transport in brain cortex. Biochemical Journal, 92, 147-158.
- Dahlem, Y.A. and Hanke, W. (2005) Intrinsic optical signal of spreading depression: Second phase depends on energy metabolism and nitric oxide. Brain Research, 1049, 15-24. doi:10.1016/j.brainres.2005.04.059
- Klink, O., Hanke, W., Gebershagen, E. and Fernandes de Lima, V.M. (2010) Influence of heavy water on waves and oscillations in the Belouzov-Zabotinsky reaction. In: Petrin, A., Ed., Wave Propagation in Materials for Modern Applications, InTech Books, Morn Hill, 21.
- Dahlem, M. and Hadjikahani, N. (2009) Migraine aura: Retracting particle-like waves in weakly susceptible cortex. PLoS ONE, 4, e5007. doi:10.1371/journal.pone.0005007
- Streit, D.S. (1990) Depressão alastrante retiniana in vivo. MSc Thesis presented to the Ophtalmology Department UFRJ, Rio de Janeiro, Brazil.
- Ferreira Filho, C.R. and Martins-Ferreira, H. (1992) Interstitial fluid pH and its change during spreading depression in isolated chicken retina. In: DoCarmo, R., Ed., Spreading Depression, Springer Verlag, Berlin, 75-88.
- Xu, J.-Y., Huang, X. and Zhang, C. (2008) Propagating waves of activity in the neocortex: What they are, what they do. Neuroscientist, 14, 487-502.
- Hermann, G.E., Van Meter, M.J., Roo, J.C. and Rogers, R.C. (2009) Proteinase activated receptors in the nucleus of the solitary tract: Evidence for glial-neural interactions in autonomic control of the stomach. The Journal of neuroscience, 29, 9292-9300.
- Lee, C.J., Mannaioni, G., Yuan, H., Woo, D.H., Gingrich, M.B. and Traynelis, S.F. (2007) Astrocytic control of synaptic NMDA receptors. The Journal of Physiology, 581, 1057-1081. doi:10.1113/jphysiol.2007.130377
- Fernandes de Lima, V.M. and Hanke, W. (1996) Observations of non-stationatities in extracellualr potassium dynamics within the gray matter neuropil during self-sustained SDs. Journal of Brain Research, 37, 505-518.