Journal of Water Resource and Protection
Vol.6 No.4(2014), Article ID:44290,6 pages DOI:10.4236/jwarp.2014.64039
Identification and Recovery of Volatiles Organic Compounds (VOCs) in the Coffee-Producing Wastewater
Alcilucia Oliveira1, Lourdes M. C. Cabral2, Humberto Bizzo2, Neusa P. Arruda3, Suely P. Freitas1*
1Universidade Federal do Rio de Janeiro, Escola de Química
2Embrapa Food Technology
3Instituto Federal do Rio de Janeiro
Email: *freitasp@eq.ufrj.br
Copyright © 2014 by authors and Scientific Research Publishing Inc.
This work is licensed under the Creative Commons Attribution International License (CC BY).
http://creativecommons.org/licenses/by/4.0/


Received 28 December 2013; revised 27 January 2014; accepted 26 February 2014
ABSTRACT
The objectives of the present study were to recover and identify volatiles organic compounds (VOCs) in the wastewater (WW) coming from a soluble coffee industrial plant. For VOCs recover, the WW was concentrated by pervaporation using a polydimethylsiloxane (PDMS) membrane. Furthermore, the solid phase micro extraction (SPME) and gas chromatography-mass spectrometry (GC-MS) were used for VOCs identification. The multivariate method of principal component analysis (PCA) was performed to evaluate differences amongst the feed and concentrate streams. Regarding the number of VOCs identified in the wastewater (33) and permeate (72), a significant statistical difference at p < 0.05 was observed. Clusters discriminating were clearly observed, as the feed and permeate streams are compared. Thus, we can conclude that pervaporation process using a PDMS membrane was effective to recover different class of VOCs present in the aqueous effluent and can be recommended for industrial wastewater treatment.
Keywords:Wastewater; Volatile Compounds; Pervaporation; Instant Coffee Industry

1. Introduction
Brazil is the largest coffee producer and exporter worldwide. Brazilian coffee is commercialized either as green and roasted coffee beans or as soluble coffee with green beans representing the major export volume (ABIC, 2013). Instant coffee is a convenient alternative for daily consumption, nevertheless a lacks most of the VOCs in the water during solutes extraction stage causing an important decrease in the overall coffee flavour.
The food and beverage industries are major consumers of water. In particular, the instant coffee industry consuming, only in the extraction step, as much as 8 - 12 tonnes of water per tonne of coffee ground in the feed. Thus, the challenge of soluble coffee companies is advance in a new technology to simultaneously recovery the VOCs loosed in the effluent and promote an opportunity for wastewater recycling.
In general, VOCs are potentially dangerous to humans consume. Regarding the reuse of wastewater in the instant coffee industries, toxic compounds have to be removed to attend chemical requirements and safety certification. Hence, information about the VOCs composition in the wastewater from instant coffee would be of great interest.
In the case of diluted multicomponent mixtures, the traditional methods for VOCs water treatment are not efficient. However, it is possible to remove almost all of the organics from wastewater by pervaporation membranes on an industrial scale [1] [2] .
Pervaporation, a membrane separation process, is an alternative recently evaluated to recover contaminants from industrial wastewater and to concentrate VOCs of natural sources. Its high separating efficiency and, above all, the minimal volatile losses through the use of mild temperatures, make pervaporation suitable for volatile compounds concentration. The key advantages of pervaporation over distillation process are lower energy consumption and high selectivity [3] [4] [5] [6] .
The SPME has been considered a fast and reliable tool to study the behavior of VOCs from coffee extract and provides a very high concentration of these compounds on the microfiber containing the stationary phase and thus is recommended for trace analysis [6] [7] .
Pervaporation can be a potential technology to concentrate the diluted organics solutions and, consequently, to wastewater treatment. In this context, this study combined pervaporation and HS-SPME-GC-MS to, respectively, recover and identify, for the first time, the main coffee organics compounds in the wastewater streams from a soluble coffee industrial process.
2. Materials and Methods
2.1. Raw Material
The wastewater aromatic solution was supplied by a Brazilian soluble coffee company, coming from a blend of Brazilian Robusta and Arabica varieties. To preserve the volatile compounds, the samples were stored at 16˚C until processing.
2.2. Pervaporation Process
The industrial wastewater used as feed streams was circulated during three hours in a plane module membrane system, measuring 28.3 cm2, with dense anisotropic membrane (Velterop—Pervatech®), thermostatic bath (Nova Técnica Model NT 281) and vacuum pump (Varian SD-90). The vacuum was maintained below 200 Pa at the downstream side of the membrane. These experiments were conducted in duplicate at 25˚C, 35˚C and 45˚C. This vapour phase was then condensed in cooler using liquid nitrogen at −196˚C. Samples of collected permeate were submitted in triplicate to chromatographic analysis.
PDMS is the more flexible hydrophobic membrane commercially available and was frequently used for concentrating diluted organics compounds from aqueous media. According Brooks & Livingstone [7] the PDMS membrane was recommended to VOCs recovery in waste water due to both his high selectivity and permeability.
The membrane cleaning was carried out by using diluted alkaline solutions followed by deionised water up to the original water permeability (1 kg∙h−1∙m−2) accord to manufacturer’s recommendations.
2.3. Extraction of Volatile Compounds
The volatiles in the feed and permeate were extracted by HS-SPME using a fibre covered with a film of divinylbenzene-carboxen-polydimethylsiloxane (DVD/CAR/PDMS) Supelco, Bellafonte, PA, USA, conditioned at 270˚C under helium flow for 1 h, in accordance with the manufacturer’s recommendations. For each extraction, 1 g of the sample was kept in a 4 mL vial under agitation. The sample was maintained at 65˚C for 1 hour. Subsequently, the fibre was exposed to the headspace of the vial for 15 minutes. Thermal desorption was accomplished by exposing the fibre to the GC injector at 250˚C for 3 min. Blank of analyses were run daily to ensure the absence of fiber carryover [8] . All extractions and GC analyses were performed in triplicate.
2.4. Chromatographic Analyses
An Agilent 6890N gas chromatograph with a flame ionisation detector and fitted with a 5% diphenyl 95% dimethylpolysiloxane capillary column (30 m × 0.32 mm × 0.25 μm) was used. The oven temperature was kept at 40˚C for 3 min, then raised to 240˚C at a rate of 3˚C∙min−1 and maintained at 240˚C for 10 min. Hydrogen at a rate of 1.7 mL∙min−1 was used as the carrier gas. The injector was operated at 250˚C in the splitless mode. The detector temperature was 280˚C.
2.5. Identification of Volatile Compounds
The identification of the volatile compounds eluted from the GC was carried out using a quadrupole MS operating at 150˚C, with the ion source at 230˚C and the transfer line at 260˚C. The electronic ionisation mode was used, with ionisation energy of 70 eV. The mass spectra obtained was recorded and compared to those of the Wiley 6th ed. and NIST version 2.0 libraries. Linear retention indices calculation was based on the retention times of the compounds and those of a series of n-alkanes, injected in the same column and analytical conditions and then compared to literature data [9] . Standard solutions of furfural, benzaldehyde, guaiacol, 2,6-dimethylpyrazine and 2-ethylpyrazine (Sigma-Aldrich, Steinheim, Germany) were prepared by dilution of these compounds in dichloromethane (1.0 mg∙mL−1) and injected in the chromatograph under the same conditions as above to confirm VOCs identification.
2.6. Statistical Analysis
Statistical analysis was carried with STATISTICA package version 8.0 (StatSof). One-way ANOVA and Fisher-LSD (p < 0.05) test were used for evaluate the differences between the number of VOCs coming from the wastewater and concentrate stream. Discrimination between chromatographic samples profiles submitted to the pervaporation process was evaluated by principal component analysis (PCA) and partial least squares (PLS) using the software Unscrambler®, version 9.1 (Camo Corp.). PCA was carried out on the semi-quantitative data obtained by the relative percentage of the areas from the identified VOCs.
3. Results and Discussion
3.1. Pervaporation
As expected, a positive effect was observed on the permeate flux through the membrane as temperature of feed streams was increased varying of 10 ± 2 L∙h−1∙m−2 at 25˚C to 40 ± 2 L∙h−1∙m−2 at 45˚C. This occurs due to the feed viscosity reduction as temperature increase. Similar results were published by Karlsson and Trägårdh [10] , Baudot and Marin [11] , Olsson and Trägardh [12] .
3.2. Identification of Volatiles Compounds
The total number of VOCs obtained, by SPME, in the permeate differs statistically at p < 0.05 as compared with feed, in the evaluated temperature range (table 1). In these conditions, about 34 to 41 VOCs were detected in the permeate (WP) and only 16 in the wastewater (WW). Although similar organic compounds were found, the relative amounts of individual compounds were very different. As can be observed, the major chemical classes identified in the WP include, respectively, furans (31.3%), phenolic compounds and pyrazines (12.5%), pyridines, aldehydes and pyrroles (6.3 %) (Figure 1).
Furthermore, was found that 2-acetylfuran followed by furfural were the most abundant compounds in the WP. The 2-acetylfuran and furfural occurs in many foods and flavourings and has been reported as representative of coffee flavour [13] . However, high exposure to these compounds can cause skin allergy. In particular furfural is toxic with an LD50 of 65 mg∙kg−1 [14] .
Figure 2 shows the PCA scores and loadings bi-plot obtained with selected chromatographic data from the

Table 1. Chromatography relative area of volatile compounds identified by HS-SPME-GC-MS in wastewater and permeates streams.
nd: not detected; aCo-injection of standard; bRetention-Index (RI) on the capillaries HP-5.
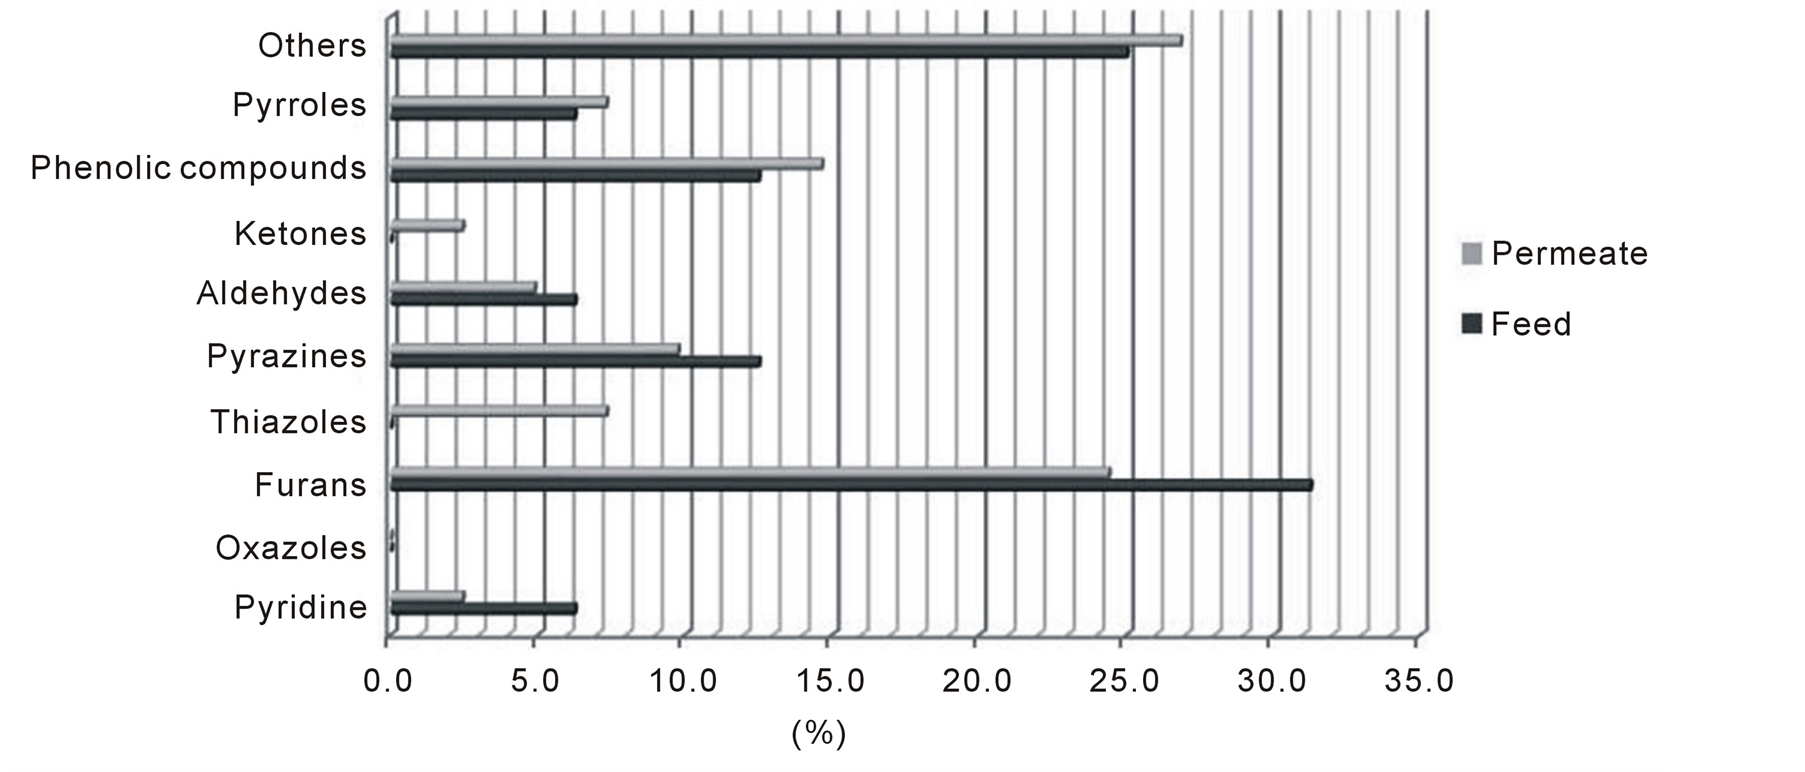
Figure 1. Chemical classes of compounds and relative amounts in feed (WW) and water permeate (WP) recovered by pervaporation using a PDMS membrane.

Figure 2. Scores and loading plots for PC1 × PC2. Numbers in the loading plots represent the peak number showed in Table 1.
feed and permeate, at different temperatures, responsible for discriminate the different organic compounds. Multivariate analysis describes 67% of the data with two principal components (PCs), where PC1 and PC2 includes most of the data variability, respectively 41% and 26% of the total variance.
In the temperature range evaluated (25˚C to 45˚C) the analysis of loadings coordinates shows that WW and WP can be clearly discriminate as regarding their chromatographic flavour profiles. Additionally, the effect of temperature on solubility and volatility of VOCs promote a significant difference between the permeate flavour profiles obtained at the 25˚C, 35˚C and 45˚C (Figure 2).
4. Conclusions
This paper presents a study on the pervaporation for recovering VOCs in the WW coming from an instant soluble coffee industrial plant. The classical HS-SPME-GC-MS method was used to VOCs identifying. The main conclusions are: 1) The pervaporation using a PDMS membrane was efficient to concentrate in permeate a larger number of different chemical substances, as compared to the currents techniques used for qualitative evaluation of VOCs in aqueous media; 2) The relative amount of recovered VOCs in the permeate is about one hundred higher as compared with wastewater; 3) The pervaporation process promoted the water treatment by removing mainly the undesirable compounds present in the wastewater.
Furthermore it can be observed that the WP coming from instant coffee industries presents a rich composition in typical coffee aromas (honey-like, sweet, flowers and fruits notes) and may be used to enhance the aroma quality of coffee based products.
Acknowledgements
CAPES is acknowledged for the financial support.
References
- ABIC (2013). http://www.abic.com.br
- Liang, L., Dickson, J.M., Jiang, J. and Brook, M.A. (2004) Effect of Low Flow Rate on Pervaporation of 1,2-Dichloroethane with Novel Polydimethylsiloxane Composite Membranes. Journal of Membrane Science, 231, 71-79. http://dx.doi.org/10.1016/j.memsci.2003.10.038
- Ribeiro, J.S., Salva, T.J.G., Thomaziello, R.A. and Ferreira, M.M.C. (2009) Prediction of Sensory Properties of Brazilian Arabica Roasted Coffees by Headspace Solid Phase Microextraction-Gas Chromatography and Partial Least Squares. Analytica Chimica Acta, 634, 172-179. http://dx.doi.org/10.1016/j.aca.2008.12.028
- Assis, A.R., Bizzo, H.R., Matta, V.M. and Cabral, L.M.C. (2007) Recuperação e concentração de componentes do aroma de caju (Anacardium occidentale L.) por pervaporação. Ciência e Tecnologia de Alimentos, 27, 349-354. http://dx.doi.org/10.1590/S0101-20612007000200024
- Cassano, A., Frigoli, A., Tagarelli, A., Sindona, G. and Drioli, E. (2006) Integrated Membrane Process for the Production of Highly Nutritional Kiwifruit Juice. Desalination, 189, 21-30. http://dx.doi.org/10.1016/j.desal.2005.06.009
- Pereira, C.C., Ribeiro, J.R., Nobrega, R. and Borges, C.P. (2006) Pervaporative Recovery of Volatile Aroma Compounds from Fruit Juices. Journal of Membrane Science, 274, 1-23. http://dx.doi.org/10.1016/j.memsci.2005.10.016
- Brooks, P.R. and Livingstone, A.G. (1995) Aqueous-Aqueous Extraction of Organic Pollutants through Tubular Silicone Rubber Membranes. Journal of Membrane Science, 104, 119-139. http://dx.doi.org/10.1016/0376-7388(95)00020-D
- Roberts, D.T., Pollien, P. and Milo, C. (2000) Solid-Phase Microextraction Method Development for Headspace Analysis of Volatile Flavour Compounds. Journal of Agricultural and Food Chemistry, 48, 2430-2437. http://dx.doi.org/10.1021/jf991116l
- Adams, R.P. (2007) Identification of Essential Oil Components by Gas Chromatography/Mass Spectrometry. Allured Publishing Co., Illinois.
- Karlsson, H. and Trägårdh, G. (1996) Applications of Pervaporation in Food Processing—Review. Trends in Food Science & Technology, 7, 78-83. http://dx.doi.org/10.1016/0924-2244(96)81301-X
- Baudot, A. and Marin, M. (1996) Dairy Aroma Recovery by Pervaporation. Journal of Membrane Science, 120, 207- 220. http://dx.doi.org/10.1016/0376-7388(96)00144-5
- Olsson, J. and Trägårdh, G. (1999) Influence of Temperature on Membrane Permeability during Pervaporation Aroma Recovery. Separation Science and Technology, 34, 1643-1648. http://dx.doi.org/10.1080/01496399909353762
- Arruda, N.P., Hovell, A.M.C., Rezende, C.M., Freitas, S.P., Couri, S. and Bizzo, H.R. (2011) Discriminação entre estádios de maturação e tipos de processamento de pós-colheita de cafés arábica por microextração em fase sólida e análise de componentes principais. Química Nova, 34, 819-834.
NOTES

*Corresponding author.