Journal of Biomedical Science and Engineering
Vol.7 No.8(2014), Article
ID:47359,11
pages
DOI:10.4236/jbise.2014.78060
Assessment of Mechanical Properties of Muscles from Multi-Parametric Magnetic Resonance Imaging
Renaud Grenier1,2, Delphine Périé1,2, Guillaume Gilbert3, Gilles Beaudoin4, Daniel Curnier2,5
1Mechanical Engineering Department, Ecole Polytechnique de Montréal, Montreal, Canada
2Research Center Sainte-Justine University Hospital, Montreal, Canada
3Philips Healthcare, Montreal, Canada
4Notre Dame Hospital, University of Montreal, Montreal, Canada
5Department of Kinesiology, University of Montreal, Montreal, Canada
Email: delphine.perie@polymtl.ca
Copyright © 2014 by authors and Scientific Research Publishing Inc.
This work is licensed under the Creative Commons Attribution International License (CC BY).
http://creativecommons.org/licenses/by/4.0/


Received 19 April 2014; revised 31 May 2014; accepted 17 June 2014
ABSTRACT
We hypothesized that a relationship existed between the mechanical properties and the magnetic resonance imaging (MRI) parameters of muscles, as already demonstrated in cartilaginous tissues. The aim was to develop an indirect evaluation tool of the mechanical properties of degenerated muscles. Leg and arm muscles of adult rabbits were dissected, and tested 12 hours post mortem, in a state of rigor mortis, or 72 hours post mortem, in a state of post-rigor mortis. The tests consisted of a multi-parametric MRI acquisition followed by a uniaxial tensile test until failure. The statistical analysis consisted of multiple linear regressions and principal component analysis. Significant differences existed between the rigor mortis and post-rigor mortis groups for E but not for the MRI parameters. 78%, 60% or 33% of the Young’s modulus could be explained by the MRI parameters in the post-rigor mortis group, rigor mortis group or both groups respectively. These relationships were confirmed by the principal component analysis. The proposed multi-parametric MRI protocol associated to principal component analysis is a promising tool for the indirect evaluation of muscle mechanical properties and should be useful to find biomarkers and predictive factors of the evolution of the pathologies.
Keywords:Muscles, Mechanical Properties, Multi-Parametric MRI, Multiple Regressions, Principal Component Analysis

1. Introduction
Muscles generate forces to move or stabilize human body segments. Their structure is made of active fibers and passive connective tissues. Their mechanical properties are separated into the active traction force, which is created by the fibers contraction, and passive traction force, which is the muscle component and structure resistance to stretching. Both active and passive traction forces are measured in Newtons by attaching the muscle or a fiber to a force transducer and to a servomotor, and performing a cyclic tensile test [1] [2] .
The active and the passive traction forces are affected by different pathologies. Some affect them directly like the Duchene muscular dystrophy, a myopathy where the myofibrils are assembled and function normally but a protein, the dystrophin, is missing. Muscle fibers undergo necrosis and are ultimately replaced with adipose and connective tissue. The muscles lose their elasticity and become shorter, causing the weakening of the patient [3] [4] . Other pathologies affect muscles indirectly. Idiopathic scoliosis, a three dimensional deformation of the spine and rib cage, disrupts the symmetry of the paraspinal muscle activities and volumes [5] [6] , decreases the total mechanical work, increases the oxygen consumption and energy cost and decreases muscles efficiency [7] . Biochemical changes in the collagen content of postural muscles are also present in idiopathic scoliosis and were found to be correlated to the changes in the muscle stiffness [8] [9] .
Several specific magnetic resonance imaging (MRI) techniques were developed for muscle applications, such as MR spectroscopy to quantify adenosine-5 triphosphate, lactates or creatine [10] and magnetic resonance elastography (MRE) [11] [12] to visualize and measure the deformation waves within the tissue submitted to mechanical vibrations and to assess their mechanical properties. However, MR spectroscopy is often limited to a single voxel and low resolution. MR elastography requires a special system to create the vibrations and customized phase-contrast sequences to perform motion sensitization. Commercial MRE systems are available for the liver tissue only, not for the muscle, which remains a research application.
Recently, some authors showed that multi-parametric MRI offered great potential as a sensitive and non-invasive technique for describing the alterations in mechanical properties of intervertebral discs or cartilage. Correlations were found in cartilage between the longitudinal relaxation time in presence of gadolinium (T1gd) as measured by Gadolinium-Enhanced MRI and local stiffness as measured by mechanical indentation [13] , or unconfined compression [14] -[17] . Significant relationships were also established in cartilage between the longitudinal relaxation time (T1) or the transverse relaxation time (T2) and the Young’s modulus (E) or the dynamic modulus determined by unconfined compression [18] . The spin-lock relaxation time (T1ρ) was strongly correlated to the compressive modulus and the hydraulic permeability in cartilage [19] and to the swelling pressure in human nucleus pulposus [20] . On bovine nucleus pulposus, significant correlations were found between the hydraulic permeability and the relaxation times or the apparent diffusion coefficient (ADC) [21] . Moreover, the compressive modulus of the nucleus pulposus was found to be correlated to T1 and T1ρ, while the hydraulic permeability of annulus fibrosus was found to be inversely correlated to T1ρ [22] . The compressive moduli and the permeabilities of isolated IVDs were assessed mostly by magnetization transfer (MT) and diffusion sequences, and MRI protocols associated to principal component analysis were promising tools to classify the degenerated intervertebral discs [23] . Studies on the human skeletal muscles demonstrated that ADC might be used to analyze the spatial architecture [24] and to indicate the change in micro-structure associated with passive extension and contraction [25] . Also, T2 increased with the muscle activation and could be used to demonstrate the aberrant muscle activation [26] [27] .
We hypothesized that a relationship existed between the mechanical properties and the MR parameters of muscles. Thus, the aim of this study was to develop an indirect evaluation tool of the mechanical properties of degenerated muscles using multi-parametric MRI and principal component analysis.
2. Methods
2.1. Samples Preparation
Three adult rabbits were obtained from a local slaughterhouse within 2 hours of death.The pairs of the following muscles were dissected and embedded in a phosphate buffered saline solution at 8˚C: semi-membranous, rectus femoris, tibialis anterior, meditriceps, anterior trapezius and levator scapulae ventralis. If one muscle of a pair was damaged, both muscles were discarded. For each pair, on a randomized basis, one muscle was included in the rigor mortis group (n = 12) and tested 12 hours post mortem in a state of rigor mortis, while the second muscle was included in the post-rigor mortis group (n = 12) and tested 72 hours post mortem in a state of post-rigor mortis. The tests consisted in a multi-parametric MRI acquisition immediately followed by a uniaxial tensile test, at room temperature.
We chose these two groups to obtain a large range of muscles rigidities, higher than the one obtained between the different muscles [2] . Even if the material properties vary greatly during rigor mortis [2] , there was less than one hour between the MRI acquisition and the mechanical tests, leading to acceptable changes in the rigor mortis group between the two tests.
2.2. Multi-Parametric MR Imaging
For the multi-parametric MRI acquisition, the muscles were clamped in two grips and placed in an MRI-compatible system filled with a phosphate buffered saline solution (Figure 1). The acquisition was performed using a 3 Teslas whole-body system (Philips Achieva X-Series).
Images for the quantification of T1 and T2 (Figure 2) were acquired first using a multiple inversion recovery turbo spin-echo sequence for T1 (repetition time of 2100 ms, echo time of 6.3 ms, 15 inversions times from 50 to 1900 ms) and a multi-echo turbo spin-echo sequence for T2 (repetition time of 2000 ms, 10 echo times every 15 ms). T1 [28] and T2 were extracted (Matlab, r2007 Mathworks, Natick, MA) from the signal intensity using exponential relationships.
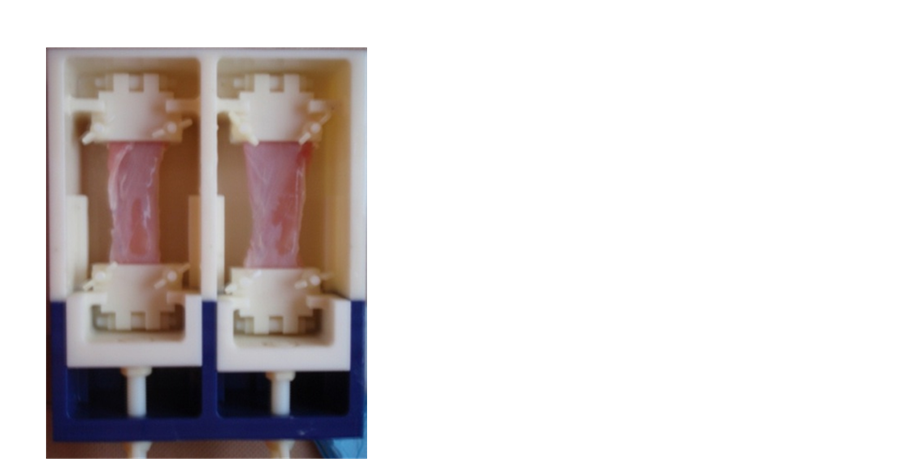
Figure 1. MRI-compatible system to fix the muscles for the MRI acquisition.
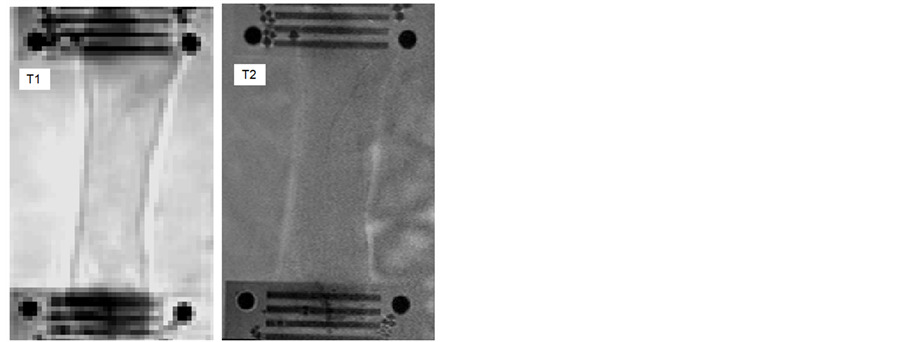
Figure 2. T1 and T2 weighted images of the semi-membranous muscle (rigor mortis).
The MT ratio (MTR) was obtained using two gradient echo sequences (repetition time of 83 ms, echo time of 3.8 ms), one with an off-resonance pulse applied at 1100 Hz down to the free water proton resonance frequency and the other one without it [29] . MTR was calculated as described previously [30] .
The last sequence measured the ADC and the fractional anisotropy (FA) using a multi-shot spin-echo echo-planar-imaging diffusion-weighted sequence (repetition time of 2000 ms, echo time of 40 ms) with 15 non-collinear diffusion and a b value (summarizing all the pulse gradient terms and depending only on the acquisition parameters) of 1000 s/mm2. ADC and FA were calculated as described previously [31] -[33] .
The MRI acquisition started 12 h and 72 h post-mortem for the rigor mortis and post-rigor mortis groups respectively and lasted 25 minutes.
The segmentation of the regions of interest (ROI) was realized using SliceOmatic (Tomovision, Montreal, CA). The outline of the muscle tissue located between the clamps was semi-automatically detected using the snake algorithm. The sensitivity of the determination of the mean MRI parameters over the ROI to the segmentation was very low, due to a spatially uniform signal, whatever the image weighting (Figure 2).
2.3. Mechanical Testing
Twenty minutes after the end of the MRI acquisition, the muscles were cut into samples of 10 × 40 × 10 mm. The samples were clamped in two grips and mounted in a micro-mechanical testing system (Mach-1, Biomomentum Inc.). Then, after a preloading of 0.2 N, a uniaxial tensile test until rupture of the muscle was performed with a constant strain rate of 1 mm/s (Figure 3). The Young modulus E was calculated from the mean of five measurements of the slope of the stress-strain curve in its linear part.
2.4. Relationships between Mechanical Properties and MRI Parameters
The differences between the rigor mortis and post-rigor mortis groups were assessed by a Wilcoxon test. Multi linear regressions were performed between dependent (E) and independent (T1, T2, MTR, FA and ADC) variables to verify our hypothesis. However, the MR parameters might be found dependant. A principal component analysis was used to convert the set of possibly correlated variables into a set of linearly uncorrelated variables. The data were first centered and reduced. The covariance matrix and its eigenvectors and eigenvalues were computed. The cumulative energy content for each eigenvector was used to select a subset of eigenvectors as basis vectors. The source data were then converted into the new basis vector system. The first principal component (F1) has the largest possible variance, and each succeeding component (F2, F3,…Fn) in turn has the highest variance possible under the constraint that it is orthogonal to the preceding components. All statistical tests were performed using XLSTATS (Addinsoft, New York, United States). All results were expressed as mean (standard deviation SD) and the significance of all tests was set to p ≤ 0.05.
3. Results
3.1. Maps and Wilcoxon Tests
The maps obtained for the relaxation times T1 and T2 and for the diffusion parameters FA and ADC were mostly homogeneous within the muscle tissue (Figure 4). The Young’s modulus and MR parameters found for each group are presented in Table 1. Significant differences existed between the rigor mortis and post-rigor mortis groups for E (p = 0.009) but not for T1 (p = 0.1), MTR (p = 0.14), ADC (p = 0.83) and FA (p = 0.69). For T2, a tendency to have differences between the two groups was observed (p = 0.081).
3.2. Multi Linear Regressions
Multi linear regressions performed on all the data (rigor mortis and post rigor mortis groups) showed that only 33% (R2 = 0.33) of E can be explained by the MRI parameters (Equation (1)). However, when performed on each experimental group, the multi linear regressions showed that up to 60% or 78% of E can be explained by the MRI parameters in the rigor mortis (Equation (2)) and post-rigor mortis (Equation (3)) groups respectively. The highest variance inflation factor (VIF) was attributed to ADC in Equation (1) and to MTR in Equation (2), suggesting that these parameters were likely candidates for elimination in the equations. However, in Equation (3), all the parameters presented equivalent VIFs.
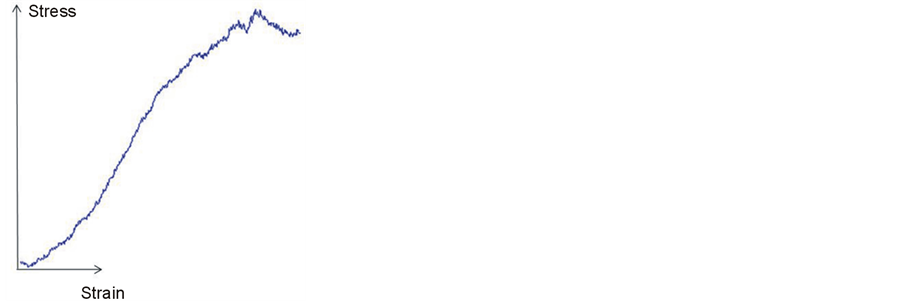
Figure 3. Typical stress-strain curve obtained from the uniaxial tensile tests under a constant strain rate until rupture.
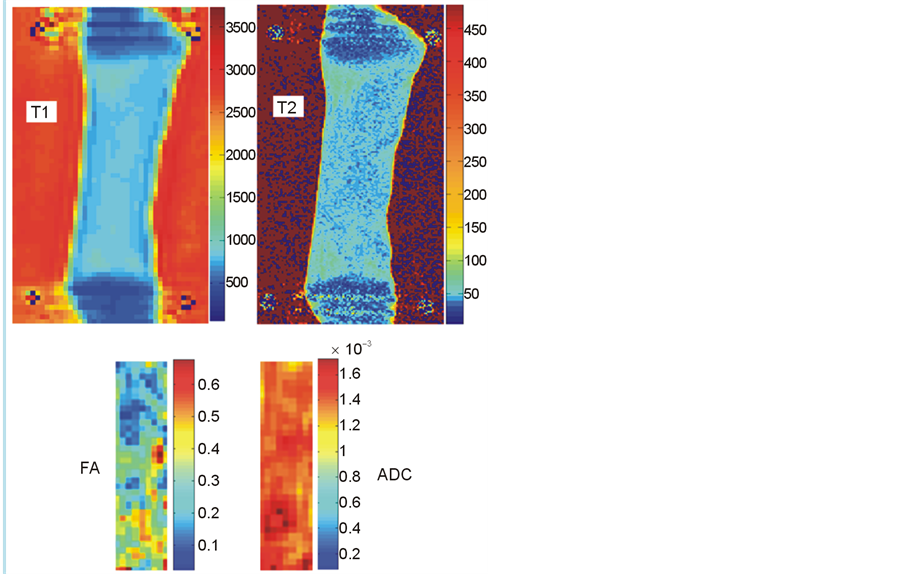

Figure 4. T1, T2, ADC and FA maps of the semi-membranous muscle (rigor mortis).
Table 1. Young’s modulus E (Pa), Relaxation times T1 and T2 (ms), magnetization transfer ratio MTR and diffusion parameters FA and ADC (mm2/s) presented as mean (SD).
E = 24,9340 − 47 × T1 − 1080 × T2 − 1289 × MTR – 38632,028 × ADC – 72,569 × FA (1)
E = 41,7990 − 66 × T1 − 2336 × T2 − 2452 × MTR – 55927,970 × ADC – 105,758 × FA (2)
E = 37,8046 + 42 × T1 − 2291 × T2 − 4767 × MTR – 43377,937 × ADC – 78,611 × FA (3)
3.3. Principal Component Analysis
When performed on all the data(rigor mortis and post rigor mortis groups), the principal component analysis reduced our six variables (E, T1, T2, MTR, ADC and FA) to two principal components F1 and F2 with a cumulative variability of 69%, which increased to 81% when considering the third principal component F3. The representation of the six variables in the (F1, F2) plane (Figure 5) showed a negative correlation between T2 and FA as they were located near the circle and symmetric relatively to the circle origin. The position of T1, T2, ADC and FA near the circle suggested that these parameters were expressed mainly by F1 and F2. The position of MTR on the X-axis suggested that MTR was expressed mainly by F1. E was far away from the circle, which suggested that this parameter was not expressed only by F1 or F2. The eigenvectors of the covariance matrix showed that E was expressed more by F3 than F1 or F2 (Equation (4)).
E = 0.39 × F1 + 0.03 × F2 + 0.52 × F3 (4)
When performed on the rigor mortis group only, the principal component analysis resulted in a cumulative variability of 76% for two variables and 90% for three variables. The representation of the six variables in the (F1, F2) plane (Figure 6) showed that T2 and ADC, and also E and T1 were negatively correlated, and that all the parameters were mainly expressed by F1 and F2.
When performed on the post-rigor mortis group only, the principal component analysis resulted in a cumulative variability of 74% for two variables and 88% for three variables. The representation of the six variables in the (F1, F2) plane (Figure 7) showed that T1 and ADC were correlated and that T2 and FA and also E and MTR were almost negatively correlated. All the parameters were mainly expressed by F1 and F2.
4. Discussion
The mechanical properties of rabbit muscles were modified for the first time to our knowledge in vitro using cadaveric rigidity, instead of using a chemical composite to digest the tissues. Using the state after death was
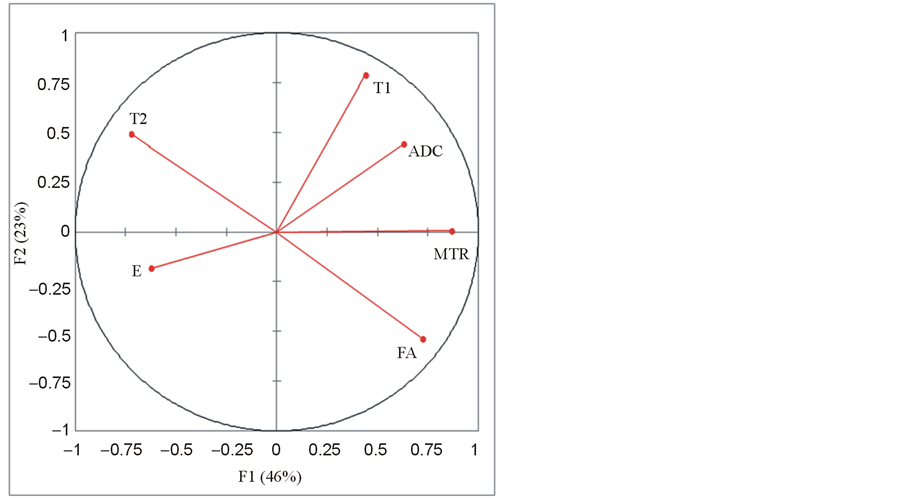
Figure 5. Principal component analysis (PCA) done on all the data: representation of the Young’s modulus E and the MRI parameters T1, T2, MTR, ADC and FA in the (F1, F2) plane.
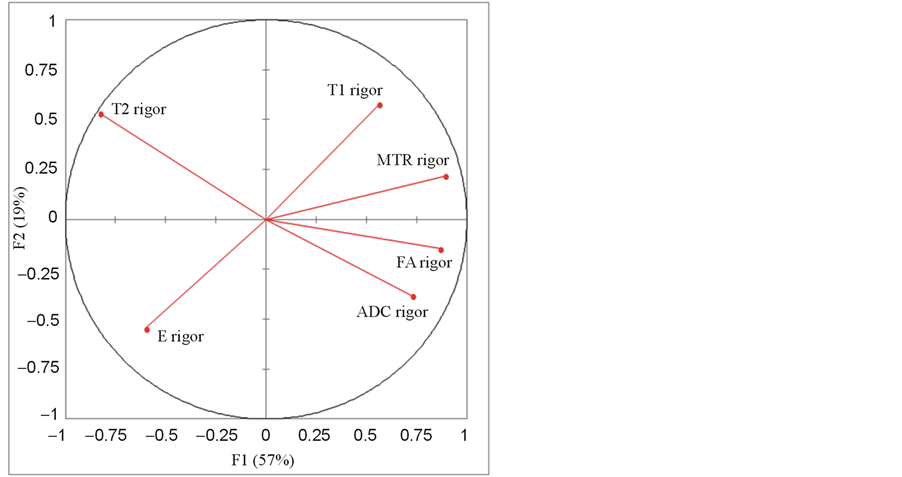
Figure 6. Principal component analysis (PCA) done on the rigor mortis group: representation of the Young’s modulus E and the MRI parameters T1, T2, MTR, ADC and FA in the (F1, F2) plane.
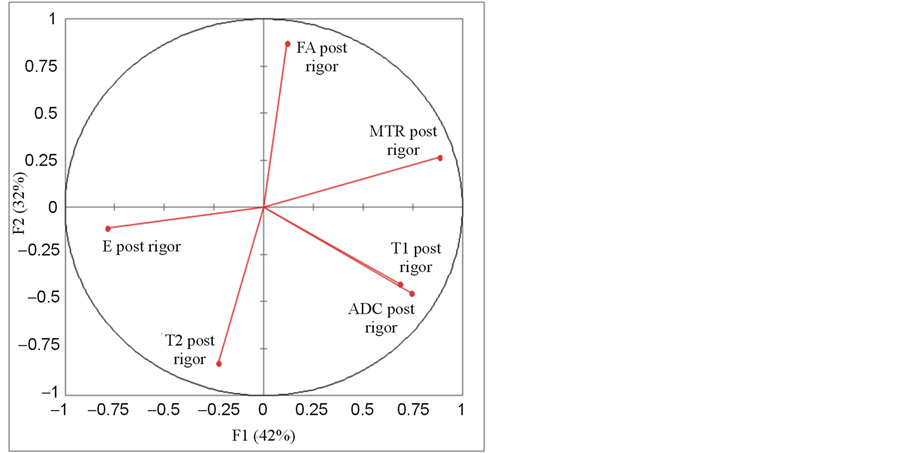
Figure 7. Principal component analysis (PCA) done on the post-rigor mortis group: representation of the Young’s modulus E and the MRI parameters T1, T2, MTR, ADC and FA in the (F1, F2) plane.
found to be an easy, effective and significant way to modify the Young’s modulus of muscles and obtain a large range of muscle rigidities. The variation between the state of rigor mortis and post-rigor mortis comes from the cessation of the ATP pumps during the state of rigor mortis, which creates an accumulation of Ca2+ and the link between myosin and actin. The decrease of the muscle mechanical properties in the state of post-rigor mortis comes from the natural degradation of the myofibrillar protein and of the link.
Degradation affects the structure of the muscles, the chemical environment and the water retention capacity [34] . These three parameters are known to also affect the MR parameters. Studies on cartilaginous tissues showed that T1 was correlated to the structure of the tissue [35] [36] and to the Young’s modulus [16] [19] , T2 was correlated to the integrity of the extracellular matrix [35] [37] , MTR was correlated to the quantity of collagen and total quantity of protein [38] and to the integrity of the extracellular matrix [34] , and ADC was related to proteoglycan and water contents, and inversely related to the percentage of denatured collagen [39] . Due to the lack of significant changes in T1, T2, MTR or ADC, the decrease of the Young’s modulus of the muscle may not be related to the structure of the tissue or to the integrity of the matrix.
The relationship found between the Young’s modulus E, determined by a uniaxial tensile test under a constant strain rate until rupture, and the MRI parameters, determined by multi-parametric MRI, for the post-rigor mortis group, validated our hypothesis. However, the decrease of the coefficient of determination when considering the rigor mortis group or the two groups together and the differences in the relationships between groups suggested that before the use of this technique to quantify the muscles mechanical properties in vivo on patients suffering from various diseases, the relationships have to be defined for each degeneration type of the tissue that mimics the pathology.
These relationships between mechanical properties and MRI parameters in the muscle could be improved using more sensitive MRI parameters to tissue degeneration. T1ρ was found as sensitive as T2 to the composition of muscle [40] and spin-lock MRI was also able to quantify microstructural changes in limb girdle muscular dystrophy [41] . Moreover, the high sensitivity of T1ρ to cartilage or intervertebral disc degeneration has been demonstrated [19] [22] . Chemical exchange saturation transfer (CEST) agents provide a powerful source for potential contrast including pH imaging, metabolite detection, imaging of mobile proteins or peptides in tissue, metal ion detection, liposome labeling, nanoparticle/polymer labeling, protein-binding, RNA or DNA-protein binding, temperature imaging, detecting enzyme activity, and imaging of OH groups, polyamines, and nucleic acids [42] . However, CEST was not applied yet to the musculoskeletal muscle.
Principal component analysis is useful to reduce the dimensionality of a data set by projecting high dimensional data into a lower dimensional space. The reduction of the Young’s modulus and MRI parameters to two or three principal components confirmed our hypothesis that a relationship exists between the mechanical properties and the MR parameters of muscles for a large range of mechanical properties as obtained between the states of rigor mortis and post-rigor mortis, and that this relationship may be in part non linear.
This study presented some limits, andfurther investigations need to be performed. The method of degeneration has the disadvantage of being sensitive to time, requires a perfect control of the experimental schedule, and does not correspond to the in vivo degeneration of muscles. However, the objective of the study was to obtain a large range of muscles rigidities, and not to reproduce the in vivo degeneration. To decrease the distortion in the diffusion tensor images due to the presence of small air bubbles on the compartments walls or our system, we used a multi-shot echo-planar-imaging sequence. An estimated SNR of 65 for the b = 0 image confirms the reliability of our ADC and FA measures in the muscle tissue. We limited our study to the ADC and FA coefficients while diffusion tensor imaging was used in the muscle for the fiber tracking that enables the measurement of muscle architectural parameters, such as pennation angle and fiber tract length throughout the entire muscle [43] [44] . The eigenvectors and eigenvalues of the diffusion tensor should be included in the relationships with the mechanical properties of the muscle. While the traction test protocol was in accordance with the literature [1] [2] [45] , we limited the analysis of the stress-strain curve to its linear part to quantify the Young’s modulus. The experimental data should be fitted with a viscoelastic [46] [47] model instead of a linear model in order to characterize more precisely the mechanical behavior of the muscles.
5. Conclusion
Intrinsic passive properties of the rabbit muscles and their relationships to MR parameters were assessed. Cadaveric rigidity produces significant changes to the mechanical properties, but not the MRI parameters. However, a relationship exists between the Young’s modulus and the MRI parameters for a large range of muscle rigidities. Our multi-parametric MRI protocol associated to principal component analysis is a promising tool for the indirect evaluation of muscle mechanical properties and should be useful to find biomarkers and predictive factors of the evolution of the pathologies. The next step will consist in verifying if the MRI parameters allow predicting the mechanical properties of healthy human muscles, and then of muscles with dystrophy, using in vitro multi-parametric MRI acquisitions followed by mechanical tensile tests. The clinical application of this multi-parametric MRI protocol associated to the principal component analysis will be the longitudinal follow-up of patients with muscular dystrophies and the clinical investigation of new biomarkers of muscle degeneresence.
Acknowledgements
Funded by the “Réseau de Bio-Imagerie du Québec”, “Fond de Recherche du Québec en Santé”.
References
- Stephenson, D.G. and Williams, D.A. (1981) Calcium-Activated Force Responses in Fastand Slow-Twitch Skinned Muscle Fibres of the Rat at Different Temperatures. The Journal of Physiology, 317, 281-302.
- Van Ee, C.A., Chasse, A.L. and Myers, B.S. (2000) Quantifying Skeletal Muscle Properties in Cadaveric Test Specimens: Effects of Mechanical Loading, Postmortem Time, and Freezer Storage. Journal of Biomechanical Engineering, 122, 9-14. http://dx.doi.org/10.1115/1.429621
- Horowits, R., Dalakas, M.C. and Podolsky, R.J. (1990) Single Skinned Muscle Fibers in Duchenne Muscular Dystrophy Generate Normal Force. Annals of Neurology, 27, 636-641. http://dx.doi.org/10.1002/ana.410270609
- Zoabli, G., Mathieu, P.A. and Aubin, C.E. (2008) Magnetic Resonance Imaging of the Erector Spinae Muscles in Duchenne Muscular Dystrophy: Implication for Scoliotic Deformities. Scoliosis, 3, 21. http://dx.doi.org/10.1186/1748-7161-3-21
- Tsai, Y.T., Leong, C.P., Huang, Y.C., Kuo, S.H., Wang, H.C., Yeh, H.C. and Lau, Y.C. (2010) The Electromyographic Responses of Paraspinal Muscles during Isokinetic Exercise in Adolescents with Idiopathic Scoliosis with a Cobb’s Angle Less than Fifty Degrees. Chang Gung Medical Journal, 33, 540-550.
- Zoabli, G., Mathieu, P.A. and Aubin, C.E. (2007) Back Muscles Biometry in Adolescent Idiopathic Scoliosis. The Spine Journal, 7, 338-344. http://dx.doi.org/10.1016/j.spinee.2006.04.001
- Mahaudens, P. and Mousny, M. (2010) Gait in Adolescent Idiopathic Scoliosis. Kinematics, Electromyographic and Energy Cost Analysis. Studies in Health Technology and Informatics, 158, 101-106.
- Gosselin, L.E., Adams, C., Cotter, T.A., McCormick, R.J. and Thomas, D.P. (1998) Effect of Exercise Training on Passive Stiffness in Locomotor Skeletal Muscle: Role of Extracellular Matrix. Journal of Applied Physiology, 85, 1011-1016.
- Kragstrup, T.W., Kjaer, M. and Mackey, A.L. (2011) Structural, Biochemical, Cellular, and Functional Changes in Skeletal Muscle Extracellular Matrix with Aging. Scandinavian Journal of Medicine Science in Sports, 21, 749-757. http://dx.doi.org/10.1111/j.1600-0838.2011.01377.x
- Jeneson, J.A. and Bruggeman, F.J. (2004) Robust Homeostatic Control of Quadriceps pH during Natural Locomotor Activity in Man. The FASEB Journal, 18, 1010-1012.
- Bensamoun, S.F., Glaser, K.J., Ringleb, S.I., Chen, Q., Ehman, R.L. and An, K.N. (2008) Rapid magnetic Resonance Elastography of Muscle Using One-Dimensional Projection. Journal of Magnetic Resonance Imaging, 27, 1083-1088. http://dx.doi.org/10.1002/jmri.21307
- Bensamoun, S.F., Ringleb, S.I., Chen, Q., Ehman, R.L., An, K.N. and Brennan, M. (2007) Thigh Muscle Stiffness Assessed with Magnetic Resonance Elastography in Hyperthyroid Patients before and after Medical Treatment. Journal of Magnetic Resonance Imaging, 26, 708-713. http://dx.doi.org/10.1002/jmri.21073
- Samosky, J.T., Burstein, D., Eric Grimson, W., Howe, R., Martin, S. and Gray, M.L. (2005) Spatially-Localized Correlation of dGEMRIC-Measured GAG Distribution and Mechanical Stiffness in the Human Tibial Plateau. Journal of Orthopaedic Research, 23, 93-101. http://dx.doi.org/10.1016/j.orthres.2004.05.008
- Chen, C.T., Fishbein, K.W., Torzilli, P.A., Hilger, A., Spencer, R.G., Horton, Jr., W.E. (2003) Matrix Fixed-Charge Density as Determined by Magnetic Resonance Microscopy of Bioreactor-Derived Hyaline Cartilage Correlates with Biochemical and Biomechanical Properties. Arthritis Rheumatology, 48, 1047-1056. http://dx.doi.org/10.1002/art.10991
- Kurkijarvi, J.E., Nissi, M.J., Kiviranta, I., Jurvelin, J.S. and Nieminen, M.T. (2004) Delayed Gadolinium-Enhanced MRI of Cartilage (dGEMRIC) and T2 Characteristics of Human Knee Articular Cartilage: Topographical Variation and Relationships to Mechanical Properties. Magnetic Resonance in Medicine, 52, 41-46. http://dx.doi.org/10.1002/mrm.20104
- Lammentausta, E., Kiviranta, P., Nissi, M.J., Laasanen, M.S., Kiviranta, I., Nieminen, M.T. and Jurvelin, J.S. (2006) T2 Relaxation Time and Delayed Gadolinium-Enhanced MRI of Cartilage (dGEMRIC) of Human Patellar Cartilage at 1.5 T and 9.4 T: Relationships with Tissue Mechanical Properties. Journal of Orthopaedic Research, 24, 366-374.http://dx.doi.org/10.1002/jor.20041
- Nieminen, M.T., Toyras, J., Laasanen, M.S., Silvennoinen, J., Helminen, H.J. and Jurvelin, J.S. (2004) Prediction of Biomechanical Properties of Articular Cartilage with Quantitative Magnetic Resonance Imaging. Journal of Biomechanics, 37, 321-328. http://dx.doi.org/10.1016/S0021-9290(03)00291-4
- Nissi, M.J., Rieppo, J., Toyras, J., Laasanen, M.S., Kiviranta, I., Nieminen, M.T. and Jurvelin, J.S. (2007) Estimation of Mechanical Properties of Articular Cartilage with MRI-dGEMRIC, T2 and T1 Imaging in Different Species with Variable Stages of Maturation. Osteoarthritis and Cartilage, 15, 1141-1148. http://dx.doi.org/10.1016/j.joca.2007.03.018
- Wheaton, A.J., Dodge, G.R., Elliott, D.M., Nicoll, S.B. and Reddy, R. (2005) Quantification of Cartilage Biomechanical and Biochemical Properties via T1ρ Magnetic Resonance Imaging. Magnetic Resonance in Medicine, 54, 1087-1093.http://dx.doi.org/10.1002/mrm.20678
- Nguyen, A.M., Johannessen, W., Yoder, J.H., Wheaton, A.J., Vresilovic, E.J., Borthakur, A. and Elliott, D.M. (2008) Noninvasive Quantification of Human Nucleus Pulposus Pressure with Use of T1ρ-Weighted Magnetic Resonance Imaging. Journal of Bone and Joint Surgery, 90, 796-802. http://dx.doi.org/10.2106/JBJS.G.00667
- Perie, D., Iatridis, J.C., Demers, C.N., Goswami, T., Beaudoin, G., Mwale, F. and Antoniou, J. (2006) Assessment of Compressive Modulus, Hydraulic Permeability and Matrix Content of Trypsin-Treated Nucleus Pulposus Using Quantitative MRI. Journal of Biomechanics, 39, 1392-1400. http://dx.doi.org/10.1016/j.jbiomech.2005.04.015
- Mwale, F., Iatridis, J.C. and Antoniou, J. (2008) Quantitative MRI as a Diagnostic Tool of Intervertebral Disc Matrix Composition and Integrity. European Spine Journal, 17, 432-440. http://dx.doi.org/10.1007/s00586-008-0744-4
- Recuerda, M., Périé, D., Gilbert, G. and Beaudoin, G. (2012) Assessment of Mechanical Properties of Isolated Bovine Intervertebral Discs from Multi-Parametric Magnetic Resonance Imaging. BMC Musculoskeletal Disorders, 13, 195.http://dx.doi.org/10.1186/1471-2474-13-195
- Heemskerk, A.M., Strijkers, G.J., Vilanova, A., Drost, M.R. and Nicolay, K. (2005) Determination of Mouse Skeletal Muscle Architecture Using Three-Dimensional Diffusion Tensor Imaging. Magnetic Resonance in Medicine, 53, 1333-1340. http://dx.doi.org/10.1002/mrm.20476
- Hatakenaka, M., Yabuuchi, H., Matsuo, Y., Okafuji, T., Kamitani, T., Setoguchi, T., Nishikawa, K. and Honda, H. (2008) Effect of Passive Muscle Length Change on Apparent Diffusion Coefficient: Detection with Clinical MR Imaging. Magnetic Resonance in Medical Sciences, 7, 59-63. http://dx.doi.org/10.2463/mrms.7.59
- Kinugasa, R., Kawakami, Y. and Fukunaga, T. (2006) Mapping Activation Levels of Skeletal Muscle in Healthy Volunteers: An MRI Study. Journal of Magnetic Resonance Imaging, 24, 1420-1425. http://dx.doi.org/10.1002/jmri.20772
- Patten, C., Meyer, R.A. and Fleckenstein, J.L. (2003) T2 Mapping of Muscle. Seminars in Musculoskeletal Radiology, 7, 297-305. http://dx.doi.org/10.1055/s-2004-815677
- Wright, P., Mougin, O., Totman, J., Peters, A., Brookes, M., Coxon, R., Morris, P., Clemence, M., Francis, S., Bowtell, R. and Gowland, P. (2008) Water Proton T1 Measurements in Brain Tissue at 7, 3, and 1.5T Using IR-EPI, IR-TSE, and MPRAGE: Results and Optimization. Magnetic Resonance Materials in Physics, Biology and Medicine, 21, 121-130.
- Wang, C., Witschey, W., Goldberg, A., Elliott, M., Borthakur, A. and Reddy, R. (2010) Magnetization Transfer Ratio Mapping of Intervertebral Disc Degeneration.
- Henkelman, R.M., Stanisz, G.J. and Graham, S.J. (2001) Magnetization Transfer in MRI: A Review. NMR in Biomedicine, 14, 57-64. http://dx.doi.org/10.1002/nbm.683
- Kingsley, P.B. (2006) Introduction to Diffusion Tensor Imaging Mathematics: Part I. Tensors, Rotations, and Eigenvectors. Concepts in Magnetic Resonance Part A, 28A, 101-122. http://dx.doi.org/10.1002/cmr.a.20048
- Kingsley, P.B. (2006) Introduction to Diffusion Tensor Imaging Mathematics: Part II. Anisotropy, Diffusion-Weighting Factors, and Gradient Encoding Schemes. Concepts in Magnetic Resonance Part A, 28A, 123-154.http://dx.doi.org/10.1002/cmr.a.20049
- Le Bihan, D., Breton, E., Lallemand, D., Grenier, P., Cabanis, E. and Laval-Jeantet, M. (1986) MR Imaging of Intravoxel Incoherent Motions: Application to Diffusion and Perfusion in Neurologic Disorders. Radiology, 161, 401-407.
- Offer, G.K.P. (1988) The Structural Basis of Water-Holding in Meat. Developments in Meat Science.
- Antoniou, J., Mwale, F., Demers, C.N., Beaudoin, G., Goswami, T., Aebi, M. and Alini, M. (2006) Quantitative Magnetic Resonance Imaging of Enzymatically Induced Degradation of the Nucleus Pulposus of Intervertebral Discs. Spine (Phila Pa 1976), 31, 1547-1554.
- Antoniou, J., Pike, G.B., Steffen, T., Baramki, H., Poole, A.R., Aebi, M. and Alini, M. (1998) Quantitative Magnetic Resonance Imaging in the Assessment of Degenerative Disc Disease. Magnetic Resonance in Medicine, 40, 900-907.http://dx.doi.org/10.1002/mrm.1910400616
- Nieminen, M.T., Töyräs, J., Rieppo, J., Hakumäki, J.M., Silvennoinen, J., Helminen, H.J. and Jurvelin, J.S. (2000) Quantitative MR Microscopy of Enzymatically Degraded Articular Cartilage. Magnetic Resonance in Medicine, 43, 676-681. http://dx.doi.org/10.1002/(SICI)1522-2594(200005)43:5<676::AID-MRM9>3.0.CO;2-X
- Paajanen, H., Komu, M., Lehto, I., Laato, M. and Haapasalo, H. (1994) Magnetization Transfer Imaging of Lumbar Disc Degeneration. Correlation of Relaxation Parameters with Biochemistry. Spine (Phila Pa 1976), 19, 2833-2837.
- Antoniou, J., Demers, C.N., Beaudoin, G., Goswami, T., Mwale, F., Aebi, M. and Alini, M. (2004) Apparent Diffusion Coefficient of Intervertebral Discs Related to Matrix Composition and Integrity. Magnetic Resonance Imaging, 22, 963-972. http://dx.doi.org/10.1016/j.mri.2004.02.011
- Virta, A., Komu, M., Lundbom, N. and Kormano, M. (1998) T1ρ MR Imaging Characteristics of Human Anterior Tibial and Gastrocnemius Muscles. Academic Radiology, 5, 104-110. http://dx.doi.org/10.1016/S1076-6332(98)80130-X
- Franczak, M.B., Ulmer, J.L., Jaradeh, S., McDaniel, J.D., Mark, L.P. and Prost, R.W. (2000) Spin-Lock Magnetic Resonance Imaging of Muscle in Patients with Autosomal Recessive Limb Girdle Muscular Dystrophy. Journal of Neuro-imaging, 10, 73-77.
- van Zijl, P.C. and Yadav, N.N. (2011) Chemical Exchange Saturation Transfer (CEST): What Is in a Name and What Isn’t? Magnetic Resonance in Medicine, 65, 927-948. http://dx.doi.org/10.1002/mrm.22761
- Heemskerk, A.M., Sinha, T.K., Wilson, K.J., Ding, Z. and Damon, B.M. (2009) Quantitative Assessment of DTI-Based Muscle Fiber Tracking and Optimal Tracking Parameters. Magnetic Resonance in Medicine, 61, 467-472.http://dx.doi.org/10.1002/mrm.21819
- Heemskerk, A.M., Sinha, T.K., Wilson, K.J., Ding, Z. and Damon, B.M. (2010) Repeatability of DTI-Based Skeletal Muscle Fiber Tracking. NMR in Biomedicine, 23, 294-303.
- Bensamoun, S., Stevens, L., Fleury, M.J., Bellon, G., Goubel, F. and Tho, M.C.H.B. (2006) Macroscopic-Microscopic Characterization of the Passive Mechanical Properties in Rat Soleus Muscle. Journal of Biomechanics, 39, 568-578.http://dx.doi.org/10.1016/j.jbiomech.2004.04.036
- Gennisson, J.L., Deffieux, T., Macé, E., Montaldo, G., Fink, M. and Tanter, M. (2010) Viscoelastic and Anisotropic Mechanical Properties of in Vivo Muscle Tissue Assessed by Supersonic Shear Imaging. Ultrasound in Medicine and Biology, 36, 789-801. http://dx.doi.org/10.1016/j.ultrasmedbio.2010.02.013
- Van Loocke, M., Simms, C.K. and Lyons, C.G. (2009) Viscoelastic Properties of Passive Skeletal Muscle in Compression—Cyclic Behaviour. Journal of Biomechanics, 42, 1038-1048. http://dx.doi.org/10.1016/j.jbiomech.2009.02.022