Advances in Bioscience and Biotechnology
Vol.4 No.1(2013), Article ID:27277,9 pages DOI:10.4236/abb.2013.41015
cysA, cysP, and rpoS mutations increase the power density in P. aeruginosa microbial fuel cells: Performing enhancement based on metabolic flux analysis
![]()
1Grupo de Diseño de Productos y Procesos (GDPP), Departamento de Ingeniería Química, Universidad de los Andes, Bogotá, Colombia
2Grupo de Investigación en Producción y Logística (PYLO), Departamento de Ingeniería Industrial, Universidad de los Andes, Bogotá, Colombia
3Laboratorio de Electroquímica y Materiales Poliméricos, Departamento de Química, Universidad de los Andes, Bogotá, Colombia
4Centro de Investigaciones Microbiológicas (CIMIC), Departamento de Ciencias Biológicas, Universidad de los Andes, Bogotá, Colombia
Email: *andgonza@uniandes.edu.co
Received 17 November 2012; revised 23 December 2012; accepted 11 January 2013
Keywords: Component; Formatting; Style; Styling; Insert
ABSTRACT
This study presents the simulation of a MFC with Pseudomonas aeruginosa based on a metabolic flux analysis (MFA) which arises as a linear programming model that served as input for the fuel cell model. The linear model was implemented in Xpress MP® and the coupling model in Comsol Multiphysics®. The in silico model predicted maximum potentials of 0.135 V which were consistent with those obtained in the experimental cell. Afterwards, an optimization platform based on multiobjective optimization approach was implemented aimed to determine genes that increase the average cell power. cysA, cysP and rpoS mutants which were predicted to increase the power of the cell, were experimentally tested with an air cathode fuel cell finding an augment up to 35-fold in the average power density for the rpoS mutant. Power densities were obtained through experimentation in the range of [0.13 - 5] mW/m2. Electron shuttle rise was qualitative corroborated trough cyclic voltammetry tests, which allowed to visualize the augment of the peaks for rpoS mutation.
1. INTRODUCTION
The increasing demand of global energy has set a dramatical searching for alternatives which could be based on renewable sources yet cheap in terms of materials needed. Global fuels currently satisfy 80% of the energy demand and this keeps increasing causing an increment in greenhouse gases. It is also a fact that this demand is scaled-based regarding its application, as this energy must be supplied according to the device or the system that would be using it.
Fuel cells have been identified as one of the most promising technologies to supplement energy to low scale devices. Generally, they generate electricity through oxidizing substrates coupled with an adequate electrons sinks. The based is electrochemistry as they are composed of a cathode and an anode. Its classification is derived from the substrate, chemical reaction and materials which are based on. Hydrogen fuel cells on one hand have been popularized thoroughly. On the other hand bacteria can be used for analogous purposes as they are capable of catalyze the conversion of organic matter into electricity using microbial fuel cells (MFC). In this case, the anode promotes the formation of biofilms while allowing electron transfer. However, electron transfer demands the participation of electron shuttles and not all bacterial species have the ability to synthesize; hence the addition of artificial shuttle becomes unavoidable. Fortunately, there exist facultative anaerobic species such as Pseudomonas aeruginosa (P. aeruginosa) known to produce phenazine derivates partially regulated by quorum sensing [1].
The important role of phenazine was established utilizing a P. aeruginosa phenazine mutant MFC as the performance of the cell decreased 95% [2]. In order to turn MFCs into attractive alternative, it is necessary to enhance its performance by increasing its capability of generating power. Several approaches have been chosen in that regard involving material and kinetics engineering. For example, the electron and proton transfer resistance must be reduced through the election of adequate materials for the proton exchange membrane (PEM) responsible for facilitating the transfer of protons. Also, new engineering efforts have been conveyed on proposing structures that avoid biofouling and increase the specific surface area using graphite fiber bush anodes in air-cathode MFCs [3]. One of the main hurdles is the electron transfer from the bacteria to anode which is either limited by mass transfer or the global kinetics [4]. Kinetics limitations could be overcome by increasing the synthesis of the electron shuttle phenazine for P. aeruginosa through varying the physical chemical conditions in the cell or, by utilizing more recently developed technologies based on molecular biology. Metabolic engineering approaches are mostly based on trial and error strategies which look for increasing the rate reactions or abolish enzyme synthesis to redirect the metabolites flow to specific interests. Nevertheless, genome scale models which are based on annotated and sequenced genomes could be utilized to predict the metabolic flux distribution by solving a linear programming optimization model restricted by mass balances and metabolites availability in an approach called flux balance analysis (FBA). This approach departs from a metabolic network, which is the complete set of all the metabolic processes that determine the physiological and biochemical properties of a cell. The optimization problem for the flux balance analysis can be formulated as follows:
Maximize
 (1)
(1)
Subject to:
 (2)
(2)
where  and
and  are upper and lower bounds and
  the stoichiometric matrix.
The objective function constitutes a critical step when formulating the problem as it establishes the direction where the biological system evolves. Generally, biomass synthesis is utilized as objective function, but this has to be reviewed carefully as biological systems could behave differently when the electron receptor changes and this is the case for P. aeruginosa in MFC where the presence of oxygen must be reduced. Different objective functions have also been tested in biological systems such as ATP synthesis, redox potential and starch synthesis [5].
FBA models should be framed in the environment where the cells evolve hence if one want to determine which genes should be deleted or over-expressed in the system in order to enhance the performance of the fuel cell it is necessary to develop a model that connect the kinetics of the cell, mass transport, and the electrochemistry behind the current generation process. Picioreanu et al. [6] reported a biofilm based MFC model that considers the redox mediators and multiple chemical species. This transient model is capable of predicting current, voltage, and charge and power production. Transport limitations were also considered by considering chemical species transport inside the biofilm. However, this model describes the kinetics of few metabolites and its kinetics is rather simplistic as it does not consider the complete metabolic network and its connectivity. Here, in this work, we developed a novel genome scale model of P. aeruginosa coupled with a single chamber MFC model to determine genes susceptible of deleting in order to increase the synthesis of electron carriers through implementing a multi-objective optimization approach. More importantly we found that sulfur metabolism and celullar stress plays an important role in MFC performance.
2. METHODS
2.1. Metabolic Network Reconstruction
Flux balanced analysis was based on the reconstruction based on Oberhardt et al. [7]. The model incorporates 1056 genes related with 883 reactions including anabolic pathways necessary for the synthesis of most cellular biomass from basic metabolic precursors. Moreover the model takes into account the metabolic processes includeing phenazine synthesis, which is the main focus for our work.
2.2. Linear Programming and Objective Function
Biomass as reported by Oberhardt and phenazine flux was selected as the main objective for the biological system studied [8,9]. Moreover, special restrictions were imposed over oxygen flux as the electron shuttles are mainly produced upon anaerobic conditions, to achieve this conditions the flux that represented the oxygen intake by the cell was reduced to almost zero. The optimization problem posed “Eqs.1 and 2” was solved using Xpress MP Professional®. The inputs for this model were the stoichiometric matrix, the number of reactions and metabolites.
2.3. Multi-Objective Platform
Multilayered optimization frameworks are often applied to optimize systems where multi-objective hierarchy is present. In this case biomass growth is prioritized by the cell regardless of the internal and external conditions, then a bi-level optimization approach seems to be ideal. Nevertheless, this approach demands an intensive exploration in a intangible search space. Here in this work, we switched our bi-level approach to a single level optimization problem by imposing an additional restriction to the biomass flux based on the steady state value from the in silico wild type strain. The optimization problem could be posed as:
Maximize
 (3)
(3)
Subject to:
 (4)
(4)
Subject to:


where  is the maximum value of biomass flux and the restrictions refer to substratum flux and micro-aerobic conditions to promote phenanize flux.
First, the value of biomass restriction is determined to the solution of a single level optimization problemwhere the biomass flux is the objective function to maximize, with the same characteristics of the bi-level optimization model. As a second step, this value of biomass flux is used as a restriction in a new optimization problem. This optimization model has the objective function to maximize the phenanize flux with the biomass flux fixed. Then, using Xpress MP Professional® coupled with a MFC COMSOL® model we finally determined candidates susceptible of mutating for improving the voltage of the cell.
2.4. Substrate and Biomass Kinetics
Substrate variation in time was modeled by fixing the substrate rate consumption and the phenazine-glucose yield coefficient. The mathematical model is described by the following “Eqs.5 and 6”
 (5)
(5)
 (6)
(6)
where  is the substrate consumption rate in
  is formance coefficient,
  is the cellular growth rate in,
 is the specific growth rate and
  is the cell concentration. Standard values were obtained from literature [10].
2.5. Two Dimensional Microbial Fuel Cell Model
In order to determine the power generated inside the MFC we built a two-dimensional model that could be further coupled with the FBA analysis [11]. This model consists of four compartments: an anode, a proton exchange membrane, a cathode and culture medium. Each of the porous electrodes is in contact with a current collector [12,13].
The mathematical model used to describe the microbial fuel cell was adapted from the model proposed by Shi et al. [14] and Comsol Chemical Engineering Module [13]. A conductive medium model describes the potential distributions in the four compartments using Laplace equations for electric potential.
 (7)
(7)
where  is the effective electronic conductivity of the media (S/m) (They are specified for each media in Table 1) The potential (V) at the electrodes and the membrane is denoted by
  for the electric potential. Ion current density at both anode and cathode is described with the following equation:
 (8)
(8)
where the subscript for cathode or anode is e,  , represents the active layer thickness,
  the macroscopic porosity.
  represents the current densities that are given by the agglomerate model. Local current density is based on Butler-Volmer Eq.9:
 (9)
(9)
 (10)
(10)
 (11)
(11)
 (12)
(12)
 (13)
(13)
For the culture medium domain the phenazine concentration reference level was given by the linear programming problem solution. Over-voltages at the anode and cathode are given by the following equations:
 (14)
(14)
Table 1. Variable and constants for the kinetics and microbial fuel cell model with P. aeruginosa.

 (15)
(15)
Boundary conditions for the electric potential of the electrodes conserve with differences in the sign. The potential difference between the current collectors on the cathode and the anode matches the total voltage of the fuel cell. Here we selected the current collector in the anode as the reference level (zero value). Hence the total voltage of the cell serves as a boundary condition in the current collector at the cathode.
In order to model the gas flow at the cathode we used Darcy’s law. The gas velocity is given by the continuity equation:
 (16)
(16)
where  represents gas mixture density (Kg/m3) and
  represents the gas velocity (m/s). Darcy’s law for porous media sates [15].
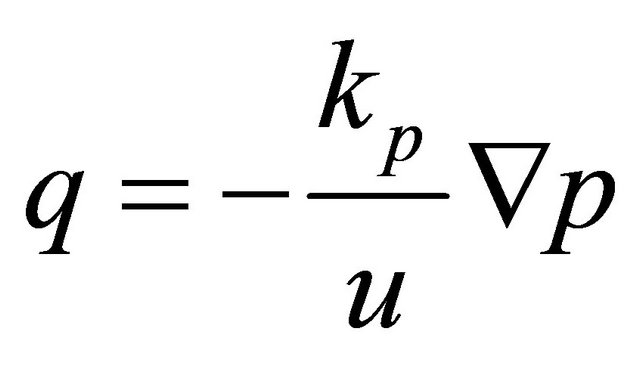 (17)
(17)
Assuming ideal gas at the cathode the density can be calculated using the following equation:
 (18)
(18)
where R is the ideal gas constant, P is the pressure, T is the temperature and M is the molecular weight of each gas. Also  and
and  constitute the boundary conditions for the Darcy equation (inlet and outlet pressure respectively)
On the border of the cathode, the gas velocity is calculated from the total mass flow given by the electrochemical reactions.
 (19)
(19)
Here, we take into account two species at the anode  and three at the cathode
  (air). For the mass transport we use of the MaxwellStefan convective and diffusion model for each electrode. The mass transport can be described from the following three mass transport equations of Maxwell-Stefan who assume that diffusion over temperature gradients is negligible (oxygen = 1, water = 2, nitrogen = 3). The following equations model the mass transport at the cathode, at the anode the equations are similar but without convective terms.
 (20)
(20)
 (21)
(21)
2.6. Experimental Validation
2.6.1. Strains and Media
Wild type strain P. aeruginosa PA01, P. aeruginosa cysP-C10::ISlacZ/hah, P. aeruginosa cysA-A03::ISlacZ/ hah, and P. aeruginosa rpoS-B03::ISlacZ/hah were kindly provided by University of Washington Genome Center and contains an inserted tranposon in the stress response genes cysP, cysA, and rpoS respectively. The strain of P. aeruginosa was maintained in a petri dish with nutrient agar. To ensure that the experimental results were not erroneous due to contamination, all manipulations were performed inside a vertical flow chamber in completely sterile conditions.
2.6.2. Microbial Fuel Cell
The MFC utilized in experiments consists of an air cathode single chamber fuel cell made in acrylic glass. The cell has an anode compartment of 3 cm of length and a tube length of 4 cm giving a total cell volume of 28.27 cm3 and total anode area of 7 cm2. Proton exchange membrane consists of J-Cloth fabric type [16].
2.6.3. Microbial Fuel Cell Operation
MFC was sterilized with UV light exposition during 24 h. Cultures were grown in nutrient broth (Oxoid, Basingstoke, UK) for 24 h previous to inoculation (3 mL for 20 hours at 150 rpm and 30˚C). Once inoculated, both, cathode and anode are hooked to a circuit with an external resistor of 500 W and incubated at 30˚C for periods of approximately 15 days. From the third day of incubation 5 mL of the internal environment of the cell was removed and 5 mL of 2.5 g/L sterile glucose solution of was added. The cells were monitored every 30 seconds during the whole incubation period with a data acquisition card (PCI-6221, National Instruments) and a connection module (SCB-68) with the Labview® acquisition software (National Instruments®).
2.6.4. Electrochemical Monitoring and Cycling Voltammetry
Current, power density and columbic efficiency were calculated based on equations reported by Logan [17]. Cyclic voltammetry tests were performed based on the protocol by Park et al. [18]. in order to detect the presence of the electron shuttles phenazine starting from −450 mV to +900 mV at a scan rate 25 mV/s. Briefly, the cell anode was connected to the working electrode terminal and the cathode to the counter electrode terminal and a reference electrode Ag/AgCl (MF-2052 BASI) was utilized.
3. RESULTS AND ANALYSIS
3.1. Metabolic Flux Analysis
Metabolic fluxes were calculated for P. aeruginosa in silico model using MFA. Maximum growth rate obtained was 1.04793 and 0.0846 h-1 for aerobic and anaerobic conditions respectively with a glucose uptake of 10 , falling within the values that previously reported for similar conditions [19]. Phenazine and biomass production were estimated for different glucose consumption rates in order to assess the sensitivity of the model.
3.2. Two Dimensional Microbial Fuel Cell Model and Experimental Validation
FBA based model was then coupled to the 2D MFC model previously described utilizing the kinetic equations described in Section 2.3. Phenazine flux was calculated at different intervals of glucose using the FBA model and voltage was evaluated from the flux predicted in the FBA model with the 2D MFC model. All parameters were obtained from the literature (Table 1) [20-29]. Our model was also validated through comparing the power density profile obtained assuming the kinetics explained in Eqs.5 and 6 with an experimental setup at 2.5 gr·l−1 of glucose. The results obtained during the first cycle of glucose agreed with the profile provided by our model (Figure 1). Therefore, our model was validated for the next goal: to determine candidate that enable to improve MFC performance.
3.3. Multi-Objective Optimization Outcome
The multi-objective optimization approach was utilized to identify reactions susceptible of deletion so the synthesis of electron shuttles could be augmented. For this work we fixed the initial concentration of glucose at 2.5 gr/l and estimated the glucose flux assuming passive transport. Then, FBA was utilized to calculate the phenazine flux that was consider the input for the 2D MFC model. In order to decrease the search space, we restricted each run down to two possible mutations and a genetic algorithm developed in Matlab® was used to select candidates that both maintain the biomass growth and increase the shuttle flux. Table 2 displays the results obtained for each run. The fact of the appearance of different genes for each run exhibits the presence of local optima which are often elucidated when using combinatorial approaches such as genetic algorithms also, our algorithm always provided one single mutations as best candidates. In this case, we found an interesting trend towards sulfur transport and metabolism as a target to increase the synthesis of this electron shuttle as the model predicts around 1.8 fold increase compared to the value when no deletions occur (1.41 mmol phenazine·h- 1·g cell) when deleting cysT, cysW, sbp, and cysP.
3.4. Experimental Validation
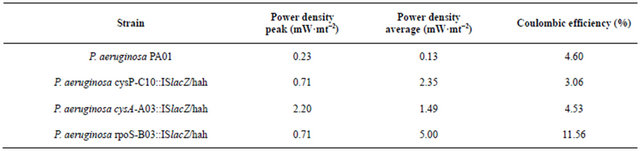
P. aeruginosa cysP-C10::ISlacZ/hah, P. aeruginosa cysA-A03::ISlacZ/hah, and P. aeruginosa rpoS-B03:: ISlacZ/hah with transposons inserted in the sulfate transporter cysP, sulfate binding precursor cysA, and stress response factor rpoS respectively, were utilized in order to corroborate the outcome of the proposed algorithm. Even though RpoS is not an outcome of the model as it is not directly metabolic related, it is reported that regulates sulfate related genes [30]. The performance of the cell, evaluated thorough determining the power density average and coulombic efficiency was then compared to the performance of the wild type P. aeruginosa PA01 reported by Garcia et al. [31]. Moreover, we obtained voltametric cyclic curves in order to detect qualitative changes in the production of the electron shuttles. Interestingly, for all cases, the modification of the strains leads to an increase in both peak and average power density, demonstrating the effect of these genes on the phenazine production (Table 3). Nevertheless, the relation between sulfate transport and phenazine is not trivial, as this molecule does not content sulfur in its structure. So it seems that the connectivity of the network causes a modification on the flux of this metabolite. In order to corroborate our results, we ran the
Table 2. Outcome of the Multiobjective optimization platform for the improvement of the performance of a P. aeruginosa based air cathode microbial fuel cell.
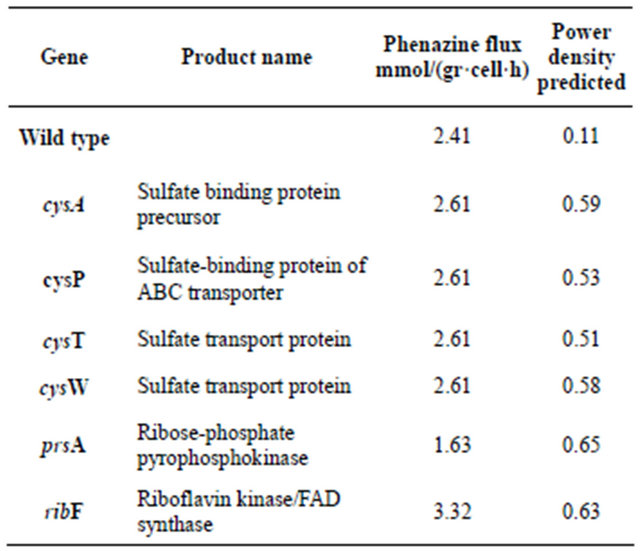

Figure 1. Power density profile for an air cathode based on P. aeruginosa obtained from a flux balance model coupled with 2D microbial fuel cell model (---) and an experimental setup with P. aeruginosa PAO1 (-).
Table 3. Power density peak and average and Columbic efficiency for air cathode microbial fuel cell with P. aeruginosa PAO1 and mutants.
 (a)
(a) (b)
(b)
Figure 2. Cyclic voltammogram for cysP-C10::ISlacZ/hah (a) and P. aeruginosa rpoS-B03::ISlacZ/hah (b) air cathode microbial fuel cell set up.
algorithm for several times finding the same trend. Regarding the voltametric cyclic curves we did not detect a significant difference regarding the place and the intensity of the oxidation and reduction peaks for cysP and cysA mutants (see Figure 2(a) for cysP mutant). On the other hand rpoS mutant displayed an interesting difference in this diagram as the peaks (Figure 2(b)), which represent the presence of the shuttles are higher for the mutant, suggesting an increasing in its concentration. This dramatical increment was also reflected on the power density average as the mutation of these genes leads to a 13-fold increment. Also rpoS deletion enabled the cell to use the electrons wisely and this was revealed in the coulumbic efficiency (2.5-fold increment)
4. CONCLUSION
Here in this work we demonstrate that by coupling FBA and spatial models which include mass transport and other physics such as electrochemistry is possible to improve the performance of different systems where kinetics and mass transport are limiting such as MFC. We also demonstrate that multi-objective optimization strategies where the second level is switched to a restriction for the first level seems to work satisfactorily with heuristics approaches such as genetic algorithms because it reduces computation infrastructure and time. On the other hand we also found that the sulfate transport a stress play a big role in P. aeruginosa MFC performance as we reached a 13-fold increment in the performance through deleting rpoS.
5. ACKNOWLEDGEMENTS
The authors wish to thank FICO for providing the Xpress-MP Professional licenses under the institutional arrangement with the Universidad de los Andes.
REFERENCES
- Malik, A.S., Boyko, O., Atkar, N. and Young, W.F. (2001) A comparative study of MR imaging profile of titanium pedicle screws. Acta Radiologica, 42, 291-293. doi:10.1080/028418501127346846
- Stephanopoulos, G.N., Arisidou, A.A. and Nielsen, J. (1998) Metabolic engineering principles and methodologies. Academic Press, New York.
- Rabaey, K., Boon, N., Hofte, M. and Verstraete, W. (2005) Microbial phenazine production enhances electron transfer in biofuel cells. Environmental Science & Technology, 39, 3401-3408. doi:10.1021/es048563o
- Spiegel, C. (2007) Designing & building fuel cells. Mcgraw-Hill Books, New York.
- Halme, A., Zhang, X. and Ranta, A. (2000) Study of biological fuel cell. Proceedings of 2nd Annual Advances in R&D of the Commercialization of small Fuel Cells and Battery Technologies for Use in Potable Applications, New Orleans, 26-28 April 2000.
- Lee, M., Gianchandani, P. and Papin, J. (2006) Flux balance analysis in the era of metabolomics. Briefings of bioinformatics, 7, 140-150. doi:10.1093/bib/bbl007
- Picioreanu, C. Katuri, K.P., Head, I.M., van Loosdrecht, M. and Scott, K. (2008) Mathematical model for microbial fuel cells with anodic biofilms and anaerobic digestion. Water Science and Technology, 57, 965-971. doi:10.2166/wst.2008.095
- Oberhardt, M., Puchalka, J., Fryer, K., Martins dos Santos and V., Papin, J. (2008) Genome-scale metabolic network analysis of the oportunistic pathogen Pseudomonas aeruginosa PA01. Journal of Bacteriology, 190, 2790-2803. doi:10.1128/JB.01583-07
- Herrgard, M., Lee, B., Portonoy, V. and Palsson, B. (2006) Integrated analysis of regulatory and metabolic networks reveals novel regulatory mechanisms in saccharomyces cerevisiae. Genome Research, 16, 627-635. doi:10.1101/gr.4083206
- Shlomi, T., Eisenberg, Y., Sharan, R. and Ruppin, E. (2007) A genome-scale computational study of the interplay between transcriptional regulation and metabolism. Molecular Systems Biology, 3, 101. doi:10.1038/msb4100141
- Beyenal, H., Chen, S. and Lewandowski, Z. (2003) The double substrate growth kinetics of Pseudomonas aeruginosa. Enzyme and Microbial Technology, 32, 92-98. doi:10.1016/S0141-0229(02)00246-6
- Du, Z., Li, H. and Gu, T. (2007) A state of the art review on microbial fuel cells: A promising technology for wastewater treatment and bioenergy. Biotechnology Advances, 25, 464-482. doi:10.1016/j.biotechadv.2007.05.004
- Comsol, A.B. (1994-2004) Chemical Enginnering module user’s guide.
- Comsol Chemical Engineering Module (2008) Proton exchange membrane fuel cell. COMSOL34/doc/chem/wwhelp/wwhimpl/co...xt=chem& file=cehm_ml_electrochemical.21.6.html
- Shi, Z. and Wang, X. (2008) Two-dimensional PEM fuel cells modeling using COMSOL multiphysics. Recent Advances in Modeling and Simulation, Oakland University, Oakland, 677-688.
- Bird, R., Stewart, W. and Lightfoot, E. (2002) Transport phenomena. 2nd Edition, John Wiley & Sons, New York.
- Rabaey, K., Lissens, G., Siciliano, S. and Verstraete, W. (2003) A microbial fuel cell capable of converting glucose to electricity at high rate and efficiency. Biotechnology letters, 25, 1531-1535. doi:10.1023/A:1025484009367
- Liu, H., Cheng, S. and Logan, B. (2005) Production of electricity using butyrate and acetate using single chamber microbial fuel cells. Environmental Science Technology, 39, 658-662. doi:10.1021/es048927c
- Park, H., Kim, B., Kim, H., Kim, G., Kim, M., Chang, I., Park, Y. and Chang, H. (2001) A novel electrochemically active and Fe(III)-reducing bacterium phylogenetically related to Clostridium butyricum isolated from a microbial fuel cell. Anaerobe, 7, 297-306. doi:10.1006/anae.2001.0399
- Verstraete, W. and Voets, J.P. (1978) Evaluation of yield and maintenance coefficients, expressed in carbon units, for Pseudomonas fluorescens and P. aeruginosa. Zeitschrift fur Allgemeine Mikrobiologie, 18, 135-141. doi:10.1002/jobm.19780180208
- Kopanidis, A., Theodorakakos, A., Gavaises, E. and Bouris, D. (2008) Numerical simulation of fluid flow and heat transfer with direct modelling of microscales geometry. Proceedings of 5th European Thermal-Sciences Conference, The Netherlands, 8 Pages.
- Jiang, S.P., Liu, Z. and Tian, Z.Q. (2006) Layer-by-layer self-assembly of composite polyelectrolyte-nafion membranes for direct metahnol fuel cells. Advanced Materials, 18, 1068-1072. doi:10.1002/adma.200502462
- Soler, J., Hontañon, E. and Daza, L. (2003) Electrode permeability and flow-field configuration: Influence on the performance of a PEMFC. Journal of Power Sources, 118, 172-178. doi:10.1016/S0378-7753(03)00081-8
- The Engineering Toolbox (2005) Air absolute and kinematic viscosity. http://www.engineeringtoolbox.com/air-absolute-kinematic-viscosity-d_601.html
- Dietrich, L., Price-Whlean, A., Petersen, A., Whiteley, M. and Newman, D.K. (2006) The phenazine pyocyanin is a terminal signalling factor in the quorum sensing network of Pseudomonas aeruginosa. Molecular Microbiology, 61, 1308-1321. doi:10.1111/j.1365-2958.2006.05306.x
- Wang, Y., Wang, C. and Chen, K.S. (2007) Elucidating differences between carbon paper and carbon cloth in polymer electrolyte fuel cells. Electrochimica Acta, 52, 3965-3975. doi:10.1016/j.electacta.2006.11.012
- Bruno, M.M., Cotella, N.G., Miras, M.C. and Barbero, C.A. (2005) Porous carbon-carbon composite replicated form a natural fibre. Chemical Communications, 47, 5896- 5898. doi:10.1039/b511771b
- Fan, Y., Sharbrough, E. and Liu, H. (2008) Quantification of the internal resistance distribution of microbial fuel cells. Environmental Science & Technology, 42, 8101- 8107. doi:10.1021/es801229j
- Rabaey, K., Rodriguez, J., Blackall, L., Keller, J., Gross, P., Batstone, D., Verstraete, W. and Nealson, K.H. (2002) Microbial ecology meets electrochemistry: Electricitydriven and driving communities. The ISME Journal, 1, 9-18. doi:10.1038/ismej.2007.4
- Price-Whelan, A., Dietrich, L. and Newman, D. (2006) Rethinking secondary metabolism: physiological roles for phenazine antibiotics. Nature Chemical Biology, 2, 71-78. doi:10.1038/nchembio764
- Lange, R. and Hengge-Aronis, R. (1991) Identification of a central regulator of stationary-phase gene expression in Escherichia coli. Molecular Biology, 5, 49-59. doi:10.1111/j.1365-2958.1991.tb01825.x
NOTES
*Corresponding author.