Journal of Biomedical Science and Engineering
Vol.7 No.9(2014), Article ID:48150,17 pages
DOI:10.4236/jbise.2014.79073
Bone Mineral “Quality”: Differing Characteristics of Calcified Microsphere Populations at the Osteoporotic and Osteoarthritic Femoral Articulation Front
Kathryn M. Linton1#, Lesley D. Hordon1,2, Roger C. Shore3, Jean E. Aaron1*
1Institute of Membrane and Systems Biology, Faculty of Biological Sciences, University of Leeds, Leeds, UK
2Rheumatology Department, Dewsbury District Hospital, Mid-Yorkshire NHS Trust, Dewsbury, UK
3Oral Biology Department, Leeds Dental Institute, University of Leeds, Leeds, UK
Email: *j.e.aaron@leeds.ac.uk
Copyright © 2014 by authors and Scientific Research Publishing Inc.
This work is licensed under the Creative Commons Attribution International License (CC BY).
http://creativecommons.org/licenses/by/4.0/


Received 21 May 2014; revised 6 July 2014; accepted 17 July 2014
ABSTRACT
The mineral front consists of large populations of organically enshrouded calcified microspheres (filamentous clusters) about 1 micron in diameter and associated smaller numbers of variably dense nanospheres, 30 - 40 nm in diameter. The discrete objects persist and modulate in maturity, and may constitute a variable “qualitative” factor in the skeletal inorganic phase, exemplified by the biomechanically contrasting pathologies of osteoporosis (OP; fracture, low stress condition) and osteoarthritis (OA; non fracture, high stress condition). The aim was to compare the articulation front material for morphological and trace element diversity using fresh female femoral head discards (from Dewsbury District Hospital NHS Mid-Yorkshire Trust). These were prepared for histology of the cartilage/bone interface region by immersion in hydrazine hydrate to expose the anorganic mineral topography for microscopy and FEGSEM microanalysis. 1) Mineral microsphere morphology (compared to animals as arbitrary controls) suggested that calcified microspheres from OP (n = 19) tended to be small (0.5 - 0.7 microns), smooth and compacted; those from OA (n = 19) were large (0.5 - 4.0 microns), uneven and irregularly dispersed. Respective calcified nanospheres from OP were similarly smaller (30 - 50 nm) than those from OA (>100 nm). In subchondral bone a proportion of the filamentous microspheres had fused into a fine-textured phase in OP and a coarse-textured phase in OA. 2) Trace element analysis (compared to positive porcine Si and Mg and other peaks) suggested a diminution with mineral maturity, and also with age effecting OP and OA similarly, with minor differences detected between them. It was concluded that calcified objects constituting the inorganic phase vary regionally with age and in fracture and nonfracture, being diminished in size (not number) in weak OP and enlarged (compared to porcine control) in stronger OA, with Si or Mg “doping” diminishing with time, perhaps influencing their individual bioactivity and matrix dynamics.
Keywords:Bone Mineral Quality, Calcified Microspheres, Si, Mg Trace Elements, Osteoporosis, Osteoarthritis

1. Introduction
Osteoarthritis (OA, non fracture) and osteoporosis (OP, fracture) are the major causes of disability in the elderly (aged over 65 years) in the Western hemisphere [1] yet aspects of each remain enigmatic. As they do not tend to be present in the same individual, the two conditions seem to be mutually exclusive [2] -[5] , the one predisposing to fractures and the other not. Although a low bone mass is a major factor in skeletal fragility it is not the only one, such that some people with a bone mass below the fracture threshold never fracture, while others above the threshold may do so, making risk for the individual difficult to predict [6] -[8] . In consequence the bone “quality” as well as its quantity is now widely recognized as significant, but it is inevitably complex and multifactorial. Thus in addition to the cortical and trabecular micro architecture, cell networks and remodelling frequency, other suggestions have included age-related changes in the organic matrix (such as collagen erosion, linkage hydrolysis or defective fibrillogenesis), and in the inorganic matrix where the accumulation of fatigue [6] may be manifested as microcracks, or changes in crystallinity and other mineral properties ([7] for references). However, the contribution of these various factors is poorly understood, often equivocal and difficult to measure.
The mineral front, whether in bone or cartilage (“tidemark”; for example [9] [10] ) radically alters the mechanical properties of the tissue in its wake, as illustrated at the junction between soft pliant hyaline articular cartilage and its hardened calcified counterpart. At normal joints, the discrete mineral front gently undulates to facilitate bonding and reduce shear stress [11] [12] . At the same time, the hard, calcified cartilage transmits and dissipates forces throughout the joint along a gradient, which protects the subchondral bone from sudden, powerful, and potentially damaging action. The nature of the mineral at this pivotal boundary between soft and hard material is central to the biomechanical performance of the joint region. In the mature skeleton, the bone salt is regularly described in the literature as uniform sheets of small crystals of hydroxyapatite, while in fetal or immature bone spherical mineral objects have been regularly reported (for example, [13] [14] ). A transition between amorphous (subcrystalline) and crystalline states has been long recognized [15] [16] perhaps uniting the diversity of observations into a common physicochemical sequential theme that modulates with time, the presence of organic envelopes (mineral “ghosts”), the nature and extent of manipulation and pathological intervention [17] -[21] .
Also of relevance to the properties of bone salt is the broad field of bio-inorganic chemistry (and related differential energy gradients) that often progresses independently from the mainstream bone literature about the inorganic phase (with notable exceptions such as therapeutic fluoride), largely because calcium and phosphate/ carbonate are so predominant and any other elements present seem to be either sporadic sequestration or peripatetic contaminants (for example, Fe from iron cooking vessels which accumulates at the calcification front) and toxic excess (for example, Cu causing developing joint malformation or Al which interferes with calcification if administered in excess during dialysis, with crippling consequences). However, it is increasingly apparent that the presence of trace elements may be key to normal calcification. This is exemplified by Mg ([22] ; above or below its dietary recommendation results in abnormal bone morphology and chemical composition), and by Si ([23] ; with a bacterial evolutionary history). Similarly hydroxyapatite bioactivity is apparently influenced by Fe [24] . It follows that there may be useful insight to be gained from the continuing “need to relate chemical observations to biological function” [25] .
The proposed investigation uses pilot mineral histochemistry (von Kossa silver stain) to assist in mapping optimal regions for subsequent organic tissue digestion to expose details of the inorganic phase and to direct subsequent FEGSEM morphological and elemental microanalysis. In particular, the femoral articular cartilage mineral front and subchondral bone were selected for calcified features that may affect bone behaviour i.e. material “quality” at what is perhaps the most physically demanding and clinically vulnerable site in the skeleton. In this location remarkable calcified features have already been demonstrated histologically (for example, [18] ). There follows a preliminary assessment of the biologically controlled inorganic phase and its capacity for structural variation as manifested at opposite ends of the orthopaedic spectrum occupied by osteoporosis (fracture, low stress condition) at one end and osteoarthritis (nonfracture, high stress condition) at the other.
2. Methods
2.1. Specimens
The head of the proximal femur has a well-defined mineral front abutting articular cartilage and is a daily source of excised material through age-related orthopaedic intervention. Fresh human osteoporotic (n. 25), and osteoarthritic (n. 25) female femoral heads were kindly provided as surgical discards by the orthopaedic surgeons at Dewsbury District Hospital, NHS Mid-Yorkshire Trust, with ethical approval and informed patient consent. In addition and used for cursory inspection only was a single segment of “normal” elderly femoral head, a generous gift from a frozen archive (Dr. C. Sharp; Robert Jones & Agnes Hunt Orthopaedic Hospital NHS Trust, Oswestry). While the material was primarily from a specific Yorkshire region there was no reason to suppose that it differed from that of similar subjects with age-related bone disease living elsewhere. For arbitrary comparison (and in the absence of adequate normal, young adult human material as the standard) fresh femoral heads from three animal species (2 bovine, 2 ovine, 2 plus 23 porcine) were obtained (local butcher and abattoir) to define a reference scale of cross-species variation and to select one as a “standard.”
2.2. Preparation for Mineral Front Histomorphometry (Light Microscopy)
Nineteen each of the above OP and OA specimens, together with the animal reference material, were dehydrated through graded alcohols and immersed in 1:1 chloroform: ethanol (1 day), followed by 100% xylene (5 min) and methylmethacrylate (MMA) monomer (3 days). There followed impregnation with MMA containing 0.1% benzoyl peroxide (catalyst; 3 days) and subsequent embedding in a polymerising mixture of MMA (monomer with 25% dibutyphthalate plasticiser and 2.5% benzoyl peroxide) at 25˚C - 30˚C (3 days minimum), carried out in a water bath for exothermic heat dissipation and bubble reduction (see [26] for preparation details). The plasticembedded tissue blocks were sectioned on a Jung K heavy duty microtome (Reichert-Jung, Heidelberg), lubricating the large block surfaces with 70% ethanol. Sections, 10 - 15 µm thick, were placed between polythenelined glass microscope slides, clamped flat to dry, and were stained in toluidine blue stain for general histology and in von Kossa’s stain for phosphate/carbonate (usually combined with calcium in human tissue), using XAM mountant (BDH) for light microscopy. The mineral front (“tidemark”) was identified and the thickness of the articular cartilage, the calcified cartilage and the subchondral bone layers was measured at ten equidistant places in each specimen using a calibrated eyepiece graticule and ×2.8 magnification on a Zeiss photomicroscope (with a Canon Power shot G5 digital camera). The relative thickness of the three layers was compared between OP and OA subjects and contrasted with the three reference species.
2.3. Preparation for Mineral Front Topography and Microanalysis (FEGSEM and EDX)
The remaining 6 fresh specimens from the OP and OA groups, and from the subsequently chosen porcine cohort, were subjected to a) organic digestion of the articular cartilage to expose the mineral front and b) organic digestion of the subchondral bone to its anorganic state as follows. Fresh, unembedded tissue samples were sawn into segments approximately 1 × 1 × 2 cm and placed cartilage-side-down on the bottom of glass jars. A small amount (approximately 0.5 ml) of 100% hydrazine hydrate (based on the bone mineral separation technique established by Termine et al. [27] ) was pipetted until the articular cartilage alone was submerged, leaving the remainder of the specimen out of contact with the solution. (Sodium hypochlorite has been similarly used for this purpose). Jars were left for one hour at room temperature, before the segments were transferred into fresh hydrazine and placed in an oven at 40˚C where the lids were secured with parafilm since the pressure rose with heating. After one hour and again after 17 hours, the hydrazine was replaced, allowing a further 24 hours for complete cartilage elimination. Treated segments were washed six times in distilled water to remove all traces of the potent digestion agent before immersion in graded ethanols (1 day in each) and air-drying at room temperature on filter paper in covered (not sealed) jars. The exposed mineral front supported by the calcified cartilage layer was sliced intact from the remainder of the segment using a fretsaw to create a flat under-surface for adherence to a 13 mm aluminium stub (Agar Scientific) coated with carbon cement (Agar Scientific). Preparations were allowed to dry before sputter-coating with platinum-palladium to a thickness of 5 nm in an Agar High-Resolution Sputter-Coater, followed by examination in a LEO 1530 FEGSEM (field emission gun scanning electron microscope), and elemental X-ray microanalysis using an Oxford Inca Energy 450 EDX system.
2.4. Preparation for Mature Mineral Topography and Microanalysis (FEGSEM, EDX and TEM)
After removal of the mineral front/calcified cartilage top slice, the remaining subchondral bone segment was totally immersed in 100% hydrazine hydrate and the above protocol repeated to expose the mature OP and OA inorganic phase, together with that of the adult porcine reference standard. In addition, equivalent fresh bone segments that had not contacted the digestion agent were hand-crushed for separation by mechanical rather than chemical means in a pestle and mortar to liberate the particulate powder-like mineral phase from the matrix for inspection, and to be used as a control for any gross artefactual differences arising from hydrazine exposure. All samples were prepared for FEGSEM and EDX microanalysis as above, and in addition for TEM (transmission electron microscopy) by vacuum desiccation for 12 hours (but without HMDS), and embedding in Eppendorf tubes of LR White hard grade resin for 24 hours at 70˚C in a Grant QBT1 heating block. Samples were subsequently sectioned at 70 - 80 nm on a Reichert-Jung Ultracut ultramicrotome using a Diatome Ultra 45˚ diamond knife. They were decompressed by 1 - 2 seconds exposure to trichloroethylene vapour, and collected on 150 mesh formvar-coated copper grids, ready for examination and photography in a Jeol JEM 1200 TEM, with elemental X-ray microanalysis in a Philips EM400 TEM with a Tracor Micro-ZII EDX attachment. The calcified particles were selected and measured as indicated below.
2.5. Statistical Analysis
For articular layer thickness, ten measurements were made from each of the 19 femoral heads per group (OP, OA, porcine; i.e. 190 measurements for each of the three articulation layers). For calcified particle diameter, 20 microspheres and 20 nanospheres were measured from each of five femoral heads per group (i.e. 300 measurements in total of calcified microsphere diameter and 300 of calcifying nanosphere diameter). Minitab version 14 was used to test differences in tissue layer thickness between the groups and between the calcified microsphere and nanosphere diameters recorded. An initial one-way unstacked ANOVA was performed to identify trends and potentially significant differences between groups, followed by direct significance tests using two-sample unpaired T-tests to indicate specific significant differences, with P-values of 0.05 or less considered significant.
3. Results
3.1. Articulation front Histomorphometry in OP, OA and Various Mammalian Species
The general histology of the femoral head is well documented and comparison is confined here to the relatively thin soft and hard zones of the articular surface and the disposition of the inorganic phase of the extracellular matrix in age-related fracture (OP) and non fracture (OA). An arbitrary standard for structural “normality” was sought by examining the degree of inter-species variation in young adults, on the basis that the bipedal gait is an ancient legacy of quadruped locomotion. The articular surface is composed of three distinctive tissue layers and to eliminate the possibility of false positives for significant differences in their width solely due to species size differences the absolute thickness measured for each layer was converted into relative percentages of the total thickness of the three layers combined (Table 1). Proportionally, the outermost band of uncalcified hyaline cartilage was thickest in OP, followed by adult porcine, OA, bovine and ovine, with statistical significance between all groups except bovine c.f. ovine and OA. Conversely the middle calcified cartilage layer was thickest in the ovine, followed by bovine, OA, porcine and OP, and differences were significant between all groups except ovine c.f. bovine. Again, the innermost subchondral bone band showed ovine proportional thickness to be dominant, followed by OA, bovine, porcine and OP; however significant differences were less than elsewhere, with only OP c.f. OA, porcine, ovine, and porcine c.f. OA and ovine groups having a P-value less than 0.05. From this species articulation overview and because the dimensions of adult porcine femoral heads were the closest to the human, the adult pig was adopted as the best option for the optimal “normal” standard reference in the results below.
The evidence from these suggested that proportionally thicker calcified and thinner uncalcified layers charac

Table 1. Relative thickness of the three articular layers in osteoporosis (OP), osteoarthritis (OA) and animal species porcine (POR), ovine (OV) and bovine (BOV).
terised OA, while the opposite was the case in OP, viewed relative to each other and also in relation to young adult pig (Figure 1). Thus the ratio of soft cartilage width to hard cartilage width was 7.4:1 (porcine), 11.2:1 (OP) and 5.4:1 (OA). The greater ratio in OP may be partly due to the particularly thin calcified cartilage band, as well as to the apparently substantial smooth and pristine band of soft articular cartilage. On the other hand, the ratio of hard cartilage width to hard subchondral bone width was 1.2:1 (porcine), 1.1:1 (OP) and 1.3:1 (OA), i.e. there was little difference in this regard between groups, the two hard layers being apparently interdependent. In this way, soft cartilage in OP occupies 10% more of the overall articular layer than in OA and 5% more than in the pig. In contrast hard cartilage in OA occupies 6% more than OP, and is 3% thicker than in pig, while the hard subchondral bone band follows a similar pattern being in OA 4% wider than OP and 2% thicker than in pig, In other words, relative to the “standard pig” the articular region is apparently too hard in osteoarthritis (high stress condition) and too soft in osteoporosis (low stress condition).
3.2. Mineral Front Properties in OP (Fracture/Low Stress) and OA (Non-Fracture/High Stress)
Under the light microscope, in undecalcified sections in advance of the discrete mineral front the chondrocytes in OP were small, quiescent-looking and sparsely distributed within the translucent hyaline matrix and histochemically they appeared to be devoid of mineral content as indicated by the silver stain (Figure 2(a)). In OA in contrast, the chondrocytes were often hypertrophic and in isogenous groups within a matrix that was frequently coarsely fibrous. Histochemically many were loaded with discrete calcified particles (Figure 2(b)) particularly in their juxtanuclear region (Figure 2(e)) and with surrounding “halos” of mineral in areas well in advance of the main contour of the mineral front (Figure 2(b), Figure 2(e)). In the pig (Figure 2(c)) and in OP (Figure 2(d)) this front was finely granular, smooth and sharply defined, being coarsely granular, grossly indented and diffuse in OA.
The calcified convolutions of the mineral front in OA combined with the encircling chondrocyte halos in the 2-dimensional histological sections were particularly striking in the SEM at low power, translating in the 3-dimensional image into numerous cone-like calcified protuberances about 150 µm in diameter (Figure 3), and confirming previous observations of Lester and Ash [18] . In the SEM at a higher magnification the mineral morphology of the inorganic front demonstrated a size diversity in substructural calcified objects that were both relatively large and small in OA (Figure 4). The optical differences above were also further resolved, with both OP and porcine exhibiting regular, closely packed calcified microspheres, 0.5 - 1 µm diameter, that were especially numerous in OP and sometimes compacted into domains, while in OA they were considerably larger with occasional surface bud-like projections (Figures 5). Here the calcified microspheres were more spaciously dispersed and exhibited a broader size range from 0.3 - 1.7 µm diameter (Figure 6), appearing in coarse and expansive domains, some of which were dissociated up to 50 µm ahead of the front. Subjective impressions were substantiated by more extensive measurements, with significant differences in inter-group comparisons (all P-values < 0.001) supporting observations that the mineral particles in OP were smaller (0.51 ± 0.13 SD) and more numerous per unit area than in OA (1.11 ± 0.33 SD) and pig (0.74 ± 0.14 SD). At the same time, the diameter variability was greatest in OA, and the median values for each group were outside the interquartile range for each of the other groups, indicating a significant difference in particulate diameter between the three (Table 2).
Using EDX microanalysis a range of calcium phosphate composites was indicated by the Ca:P ratios derived from the spectra, with pig (1.53:1 - 1.58:1) and OP (1.55:1 - 1.67:1) varying least and OA (1.94:1 - 2.59:1) va-
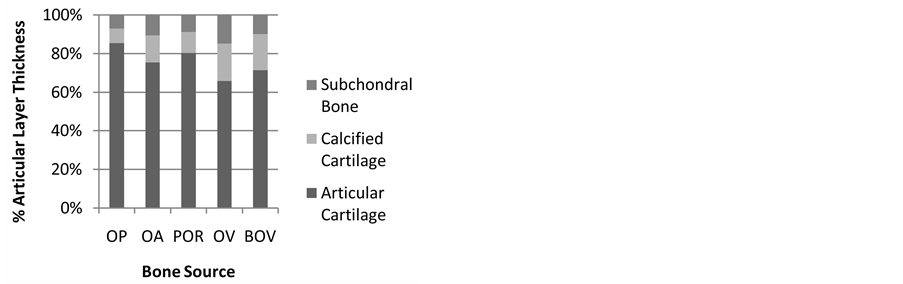
Figure 1. The proportional thickness of proximal femoral articular cartilage, calcified cartilage and subchondral bone in human osteoporosis (OP) and osteoarthritis (OA) and various animal species, showing that when correction for species skeletal size is made the similarities are greater than the differences.
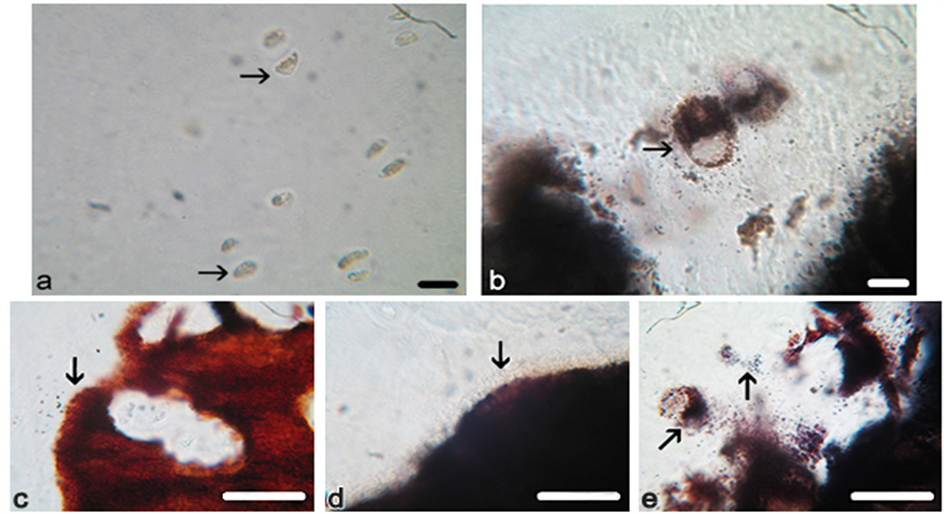
Figure 2. Photomicrographs of proximal femur articular front. Chondrocytes (arrowed) in osteoporotic and osteoarthritic cartilage, showing that those in (a) OP are small and of quiescent appearance, while in (b) OA they are often hypertrophic and loaded with mineral particles with similar objects dispersed outside the cells. The mineral front (arrowed) in (c) pig is finely particulate, discrete and inclusive of occasional divided chondrocytes, and in (d) OP it is similarly finely particulate, discrete and linear and without chondrocytes, while in (e) OA it is coarsely particulate, diffuse and highly convoluted and inclusive of frequent calcifying chondrocytes with typically dense juxtanuclear bodies (diagonal arrow). Von Kossa’s mineral stain. Scale bar (a) (b) 15 μm, (c)-(e) 25 μm. Original magnification (a) (b) ×350, (c)-(e) ×400.
Table 2. Calcified microsphere diameter at the femoral mineral front in osteoporosis (OP), osteoarthritis (OA) and porcine (POR), together with the statistical analysis of significance.
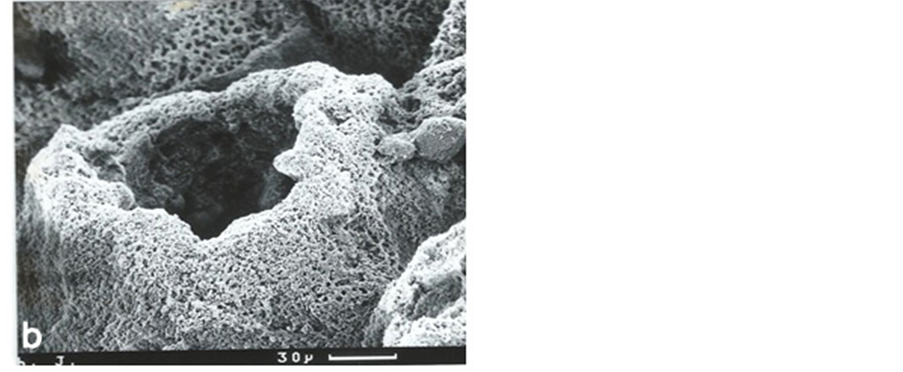
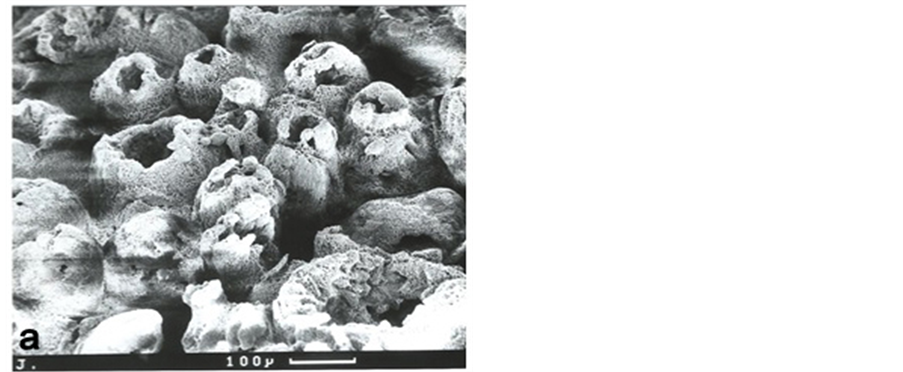
Figure 3. Low power scanning electron microscopy (SEM) of the osteoarthritic mineral front confirming its gross irregular optical character (figure 2(e)) in 3-dimensional detail. The chondrocyte lacunae are surrounded by calcified “cones”, about 150 microns in diameter, in various states of closure and considerably larger than in OP where they were invariably closed. Sodium hypochlorite digestion (6% for 2 - 4 days; Lester and Ash, 1980). Scale bars as indicated. Original magnification ×100 (top), ×350 (bottom).
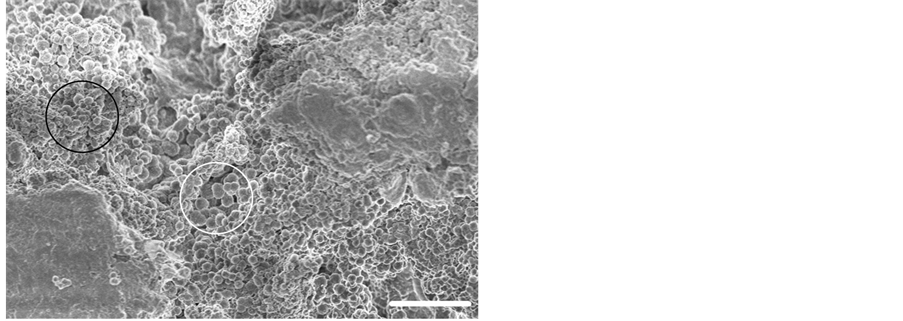
Figure 4. Field emission gun scanning electron micrograph (FEGSEM) of a typical OA mineral front showing the heterogeneous matrix micro-topography and calcified microsphere size variation with small microspheres (black circle) and large microspheres (white circle). Hydrazine hydrate cartilage digestion. Scale bar 15 μm. Original magnification ×1500.
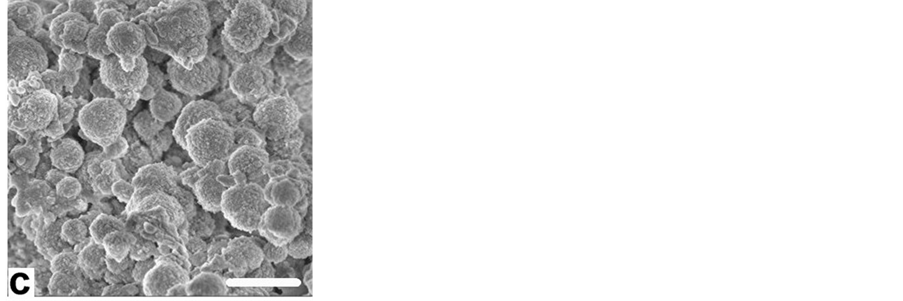
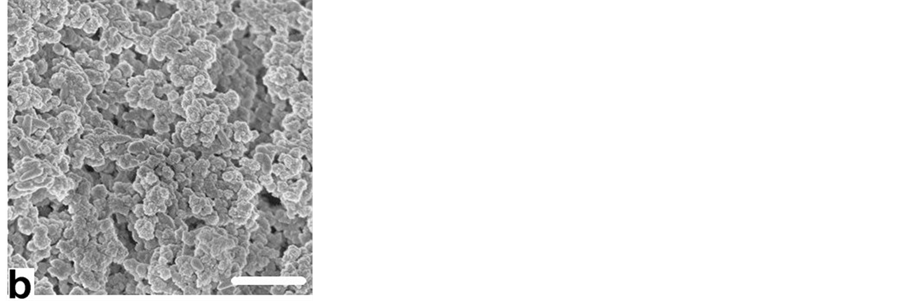

Figure 5. Field emission gun scanning electron micrographs (FEGSEM) showing representative substructural detail of calcified microsphere populations at (a) porcine, (b) OP and (c) OA mineral fronts, with the significant particulate size difference between OP and OA. Scale bars 3 μm. Original magnification ×5000.
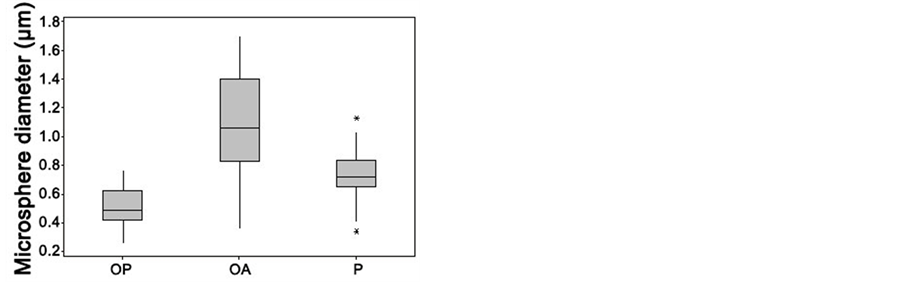
Figure 6. Boxplot comparing the range of calcified microsphere diameters at the proximal femur mineral front in osteoporosis (OP) and in osteoarthritis (OA), together with those in healthy pig (P), showing the wide diversity in OA and indicating the lowest value, first quartile, median, third quartile, and highest value for each group. Asterisks represent outliers.
rying most (Table 3; hydroxyapatite is reported to have a ratio of 1.67:1 and amorphous calcium phosphate 1.50:1; [28] ). Other elements were also recorded. Thus, Si peaks were observed in all groups and were most notable in the young adult pig, as was also the case for Mg as well as Na and Al, and with occasional evidence of S peaks (Figure 7). The content was lower in both the elderly (but possibly equally cellularly dynamic) OA group, and also in the apparently more cellularly adynamic OP group.
3.3. Subchondral Bone Mineral Properties in OP (Fracture/Low Stress) and OA (Nonfracture/High Stress)
Like the mineral front above, the equivalent FEGSEM of the subchondral bone digests and crushes indicated populations of small calcified particles in compressed domains in OP bone matrix that differed from the larger particles and looser domains in OA, and with the porcine material occupying the middle ground between the two. At the same time, there was the apparent interconnection of microspheres into chains, together with their deformation and gross fusion [21] into thick branched rods and expansive featureless plates in OA, and into slender branched rods in OP with a few featureless plates (in some instances a possible artefactual distortion of reality attributable to the removal by hydrazine of crystal growth-controlling organic envelopes, though not observed in pig). In consequence in OP the material might be best described as “finely textured” in its topography in these regions, compared to the “coarsely textured” OA (Figure 8).
EDX microanalysis spectra of the subchondral bone fraction indicated a Ca:P ratio that tended to be lower in OP (1.53:1 to 1.61:1) compared with OA (1.68:1 - 1.72:1) and again with pig in between (1.58:1 - 1.66:1; Table 3). There remained diminished but positive evidence of Si peaks, together with the consistent presence of Mg and Na in the young adult pig, elements that were lower in OP (and included S) and less notable in OA (Figure 9).
Addressing the optical (LM) counterpart of the bone mineral preparations prior to the corresponding TEM particulate ultrastructure, the material whether chemically digested or physically crushed showed under the LM the separation of myriads of von Kossa stain-positive microspheres (Figure 10(a)) with a tendency to appear larger in OA than in OP, and with occasional rod-like and fused assemblies when processed with hydrazine hydrate. With the increased magnification of SEM a substructure began to be resolved (Figure 10), consistent with previous descriptions of bone sections and isolates (for example, [7] [14] [19] ) with a 5 nm filamentous ultrastructure [29] suggested by FEGSEM (Figure 10(d)) and by TEM where clusters of 5 nm thick, sinuous calcified filaments surround a less dense centre (Figures 10(e)-(f)). The less dense centre seems to be a regular feature that may facilitate microsphere deformation in response to axial stress in situ. The populations of discrete particles are best observed when dispersed and separated intact and viewed by means of LM or SEM; they are less easily resolved when deformed and compressed against collagen and sectioned ultrathin for TEM when their outline is masked and may easily be overlooked.
The mechanically crushed material resembled that chemically digested in basic respects. However, as well as releasing individual calcified microspheres and related assemblies, a population of other objects was observed.
Table 3. EDX elemental microanalysis of the Ca:P ratio after microsphere preparation by mechanical crushing (manual) or by hydrazine organic digestion of porcine (POR), osteoporotic (OP) and osteoarthritic (OA) femoral mineral front and mature subchondral bone.
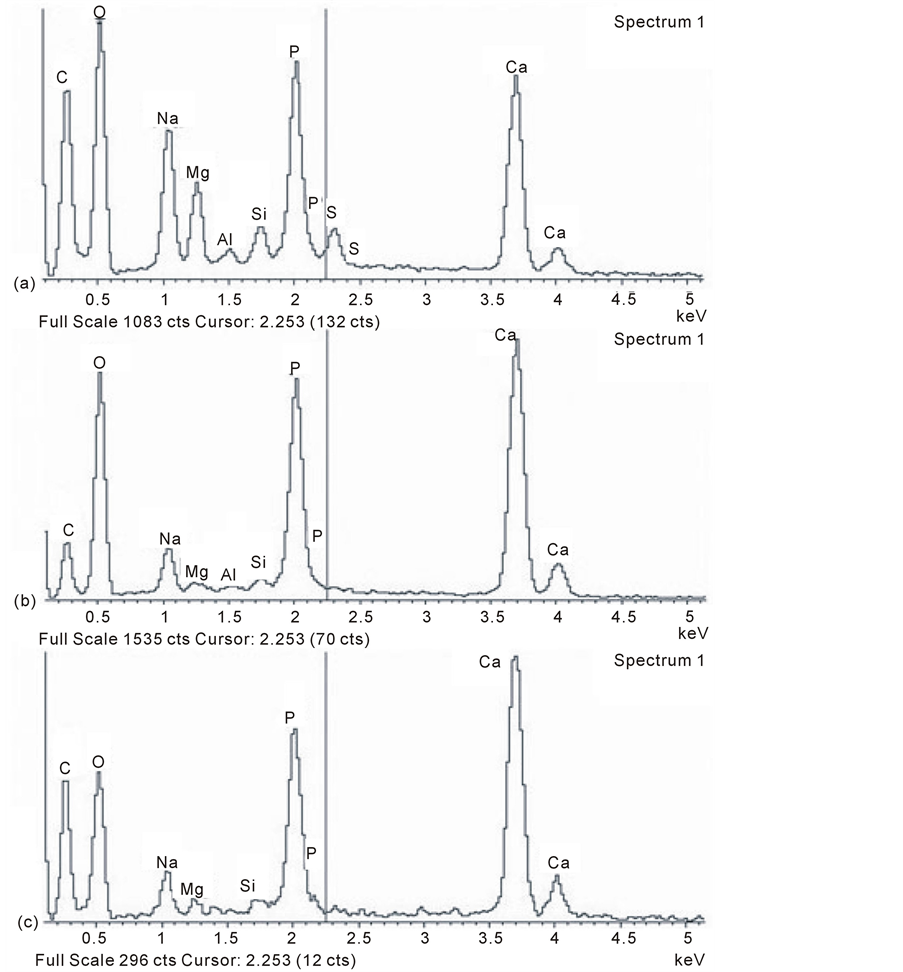
Figure 7. Typical EDX (energy dispersive X-ray) microanalysis spectra of calcified microspheres at the proximal femur, mineral front of (a) adult porcine, (b) osteoporosis, and (c) osteoarthritis. Note the variable silicon peaks together with magnesium, sodium, aluminium and also sulphur in some groups. The peaks are less well defined for all the trace elements in OP and OA compared to pig.
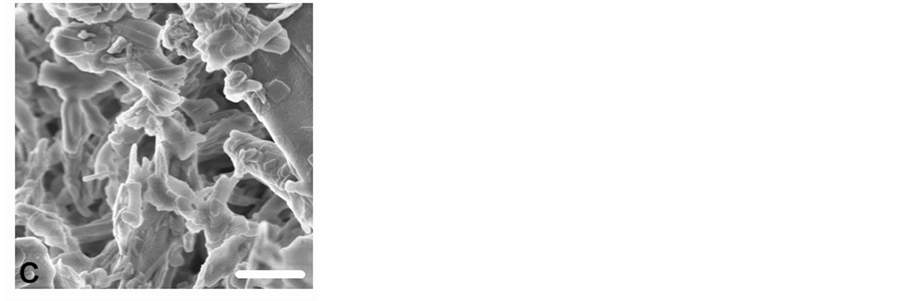
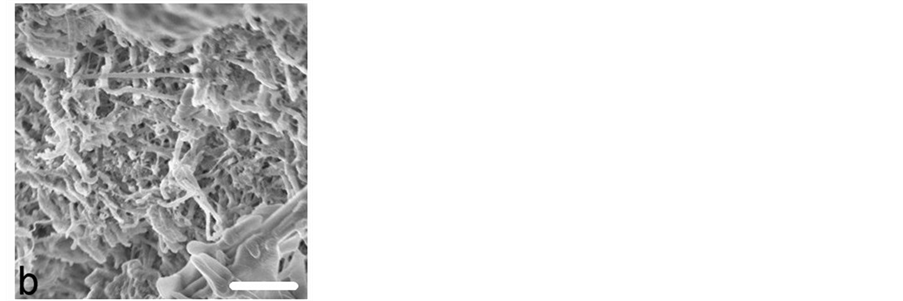
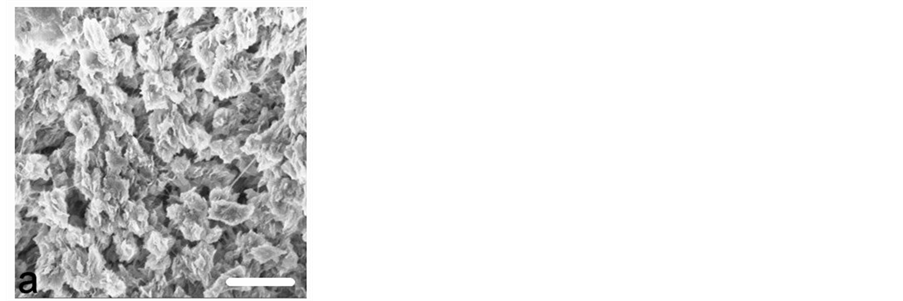
Figure 8. Field emission gun scanning electron micrographs (FEGSEM) of femoral subchondral inorganic bone matrix. In addition to calcified microsphere populations (as illustrated in Figure 5) a diversity of other calcified constructs included (a) discrete, deformed micron particles with an ultrastructure (pig), (b) fine particles among calcified rods and plates with no visible ultrastructure (OP), and (c) coarse, branched rods and broad featureless plates (OA). Hydrazine hydrate digestion (i.e. anorganic bone). Scale bars 2 μm, original magnification ×6500.
These were round, more perfectly spherical and were of a smaller magnitude, appearing in substantial numbers as discrete, variably electron dense, relatively low contrast nanospheres, generally with amorphous contents and sometimes apparently conjoined in chains. These objects (Figure 11) were 30 - 50 nm diameter in OP, were similar in pig and were more than twice that size (100 - 150 nm diameter) in OA. Their EDX microanalysis showed a particular variation (Figure 11). While there was a Ca:P ratio of 1.27:1 in OA and of 1.36:1 in pig, there was in OP no detectable phosphorus, but 17% Ca and 50% Si with no sign of Mg. In addition, a small K peak featured in OA and an Fe peak was observed in one porcine sample, i.e. there was elemental diversity within the nanosphere population, as seemed to be the case in the microsphere populations.
4. Discussion
The calcified skeletal matrix has evolved to optimise biomechanical performance in the young adult and with skeletal ageing there is a well-established physical decline. In particular, the functioning of the bipedal hip deteriorates to a level that compromises mobility and this deficiency may pertain as much to the intrinsic properties of the extracellular matrix [30] as to its general mass. In addition, the property of the subchondral bone is regarded by some authors as proactive rather than a reactive response to cartilage change in the development of OA (for example, [1] [31] -[33] ). Relative to the whole elderly triple-banded articulation layer, the fracture-prone (low stress OP) had the thickest soft layer (hyaline cartilage) and the thinnest hard layers (calcified cartilage and subchondral bone), while the non-fracture-prone (high stress OA) had thinner soft parts and thicker hard parts, with the young adult porcine arbitrary reference standard occupying the middle macroscopic ground between the two. This observation accompanies the bone atrophy of OP [6] [7] [34] , and its regional hypertrophy in OA [1] [11] [35] -[37] , together with cartilage attrition in advanced stage OA [12] [38] . There is a mouse model in which mutation of the ank gene that controls pyrophosphate distribution predisposes to joint calcification, cascading rapidly towards disabling osteoarthritis [39] . This excessive and aberrant mineral front in OA is an early instigator of soft-to-hard tissue imbalance.
Less well recognised is the possibility of significant mineral morphological modulation as an indigenous property of the inorganic matrix, meaning that the intrinsic nature of the bone salt (i.e. its “quality”) may, in its own right, be a determinant of skeletal fragility. At the same time, there is a special need for caution in applying microscopic techniques that deviate from minimally manipulated fresh material to a pressure-sensitive tissue [17] . This especially includes the removal of the mineral-enshrouding and controlling noncollagenous proteins when ultrastructural transformation is inevitable, as is likely to be the case with hydrazine. For example, in chemically treated specimens removal of the associated organic enclosures that control mineral growth, including osteopontin, bone sialoprotein, and osteocalcin [20] , enabled a degree of mineral modulation towards fused “crystallite” units and fenestrated plate-like forms. This led to the conclusion [21] that deproteination of bone as applied in the preparation of “natural” implant material fundamentally alters normal mineral morphology. Given that some inorganic molecular change was possible, the mechanically isolated mineral above was as structurally close to the
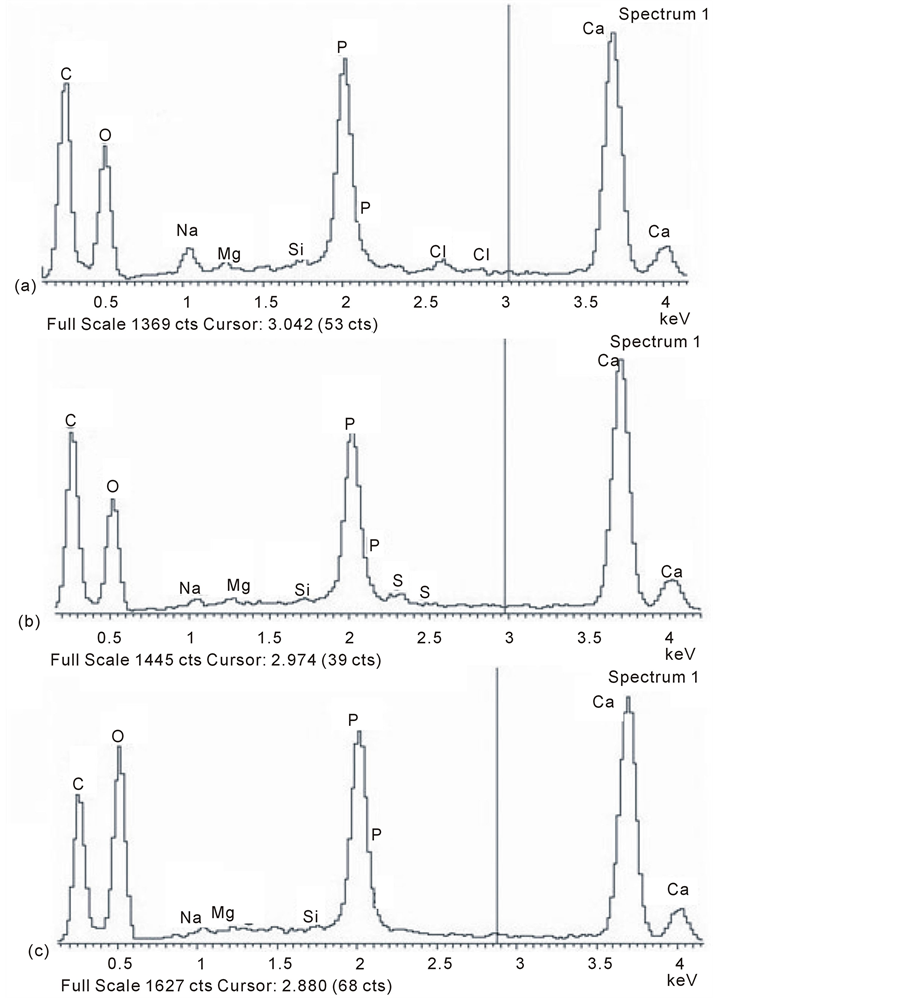
Figure 9. EDX microanalysis spectra of mineral microsphere isolates from mature femoral subchondral bone illustrating a general decline in trace elements compared with the mineral front (Figure 7) in (a) pig, with a further reduction in (b) osteoporosis and (c) osteoarthritis.
in vivo state as possible in these specimens, and also “like was being compared with like” for differences between groups under identical conditions. The mineral ultrastructure seemed basically filamentous in form (previously reported as chains of 5 nm beads clustered into ~1 μm microspheres around a less dense centre; for example [19] [29] ). These together with associated nanospheres resembled the inorganic material previously reported in slamfrozen preparations, considered to optimally preserve the tissue chemistry [14] . Subsequent deformation and fusion apparently takes place as the nascent particles at the front become subjected to the axial pressures within the established matrix, particularly in OA, resulting in diverse architectural configurations of compressed calcified assemblies that were sometimes rod-like and reminiscent of similar arrangements in dentine described as highly orientated struts and stays, known to withstand exceptional compression forces [29] .
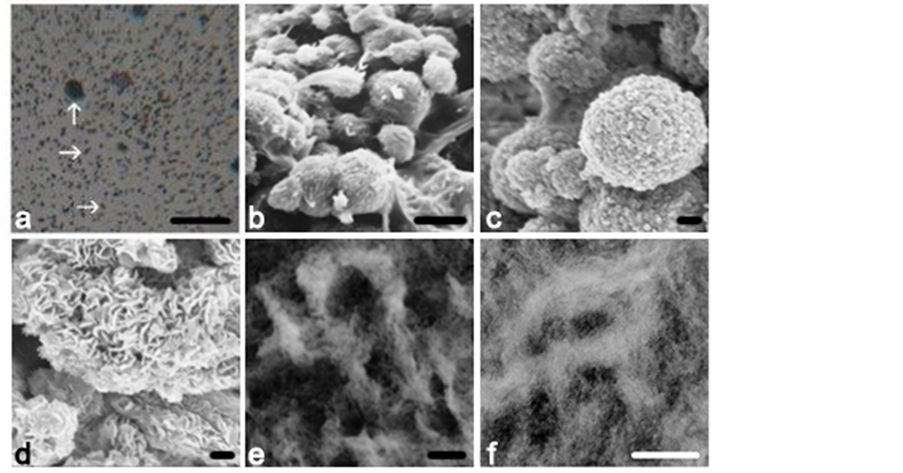
Figure 10. Calcified mature femoral subchondral bone matrix extracts showing isolates of (a) LM intact microspheres (OA, optical microscope), compared with (b) SEM intact microspheres in situ and (c) suggesting a substructure (OA), of (d) SEM filaments (pig). Shown in more detail in ultrathin sections of the particulate isolates are (e), (f) TEM electron dense microspheres each with a filamentous ultrastructure surrounding a less dense centre (mechanical crush, pig). Scale bars (a)10 µm, (b) 3 µm, (c) 0.2 µm, (d) 0.2 µm, (e) 200 nm, (f) 400 nm.
The limited validation of the porcine model with human material and other species of greatly differing sizes (see also [40] ) is useful in the face of perennially inadequate normal human material. As well as suggesting a morphological consistency in mineral structure that extends into other areas of hard tissue biology [23] [41] [42] , the evidence above indicates a structural variation more complex than that exemplified by the prime mineral-related condition of osteomalacia, where calcified particles are simply too few in number. Thus according to both optical and scanning electron microscopy, and notwithstanding cross-species consistency between a mouse and a cow, the pathological extremes of OP and OA place them at opposite ends of a statistically significant particulate size spectrum in terms of their calcified microspheres (OP half the size and more numerous per unit area c.f. OA) a statistic that also encompasses their less distinctive and apparent nanosphere precursors [14] . There has been the previous comparison of osteoporotic and osteoarthritic bone powders produced by milling, however, few reports in the literature on the subject describe a consistent mineral abnormality in atraumatic fracture-prone bone [43] , meaning that beyond its mass little else has been sought. That the size differential at the calcified microsphere level mirrors that at the calcifying nanosphere level suggests an interrelationship as part of a developmental sequence [14] commencing inside the cell (for example, [9] ). Assuming developmental parity this would place the size determination mechanism not in the extracellular matrix but within the bone cells [44] -[52] from which, for example, 20 - 50 nm calcified “spheres” were described budding from processes of MLO-A5 cells, and with fabrication of at least a proportion not only taking place within extracellular matrix vesicles but also within the cellular confines of the juxtanuclear apparatus [53] -[55] .
It seems likely that ions other than calcium and phosphate/ carbonate are part of the particle size and numeracy fabrication process. EDX microanalysis indicates the intermittent presence of Mg, Al, Fe, K, Na, S, and especially Si. Any essential role for such trace elements in bone is difficult to pin-point as is illustrated by Si as an example. The relevance of Si to connective tissue growth was introduced in the 1970s with the general view that it was essential to health. Articular cartilage contains large quantities of hydrophilic mucopolysaccharides (MPS) rich in Si [56] [57] , especially in regions of mineralisation [58] , after which they decline as bone forms from cartilage. In addition, orthosilicic acid [Si(OH)4] increases type I collagen synthesis and stimulates osteoblastic differentiation of cells in vitro at physiological concentrations of 5 - 20 μM [59] , supporting a central role in bone formation in vivo. Consistent with this is a positive correlation between dietary Si and cortical bone mineral density at the hip
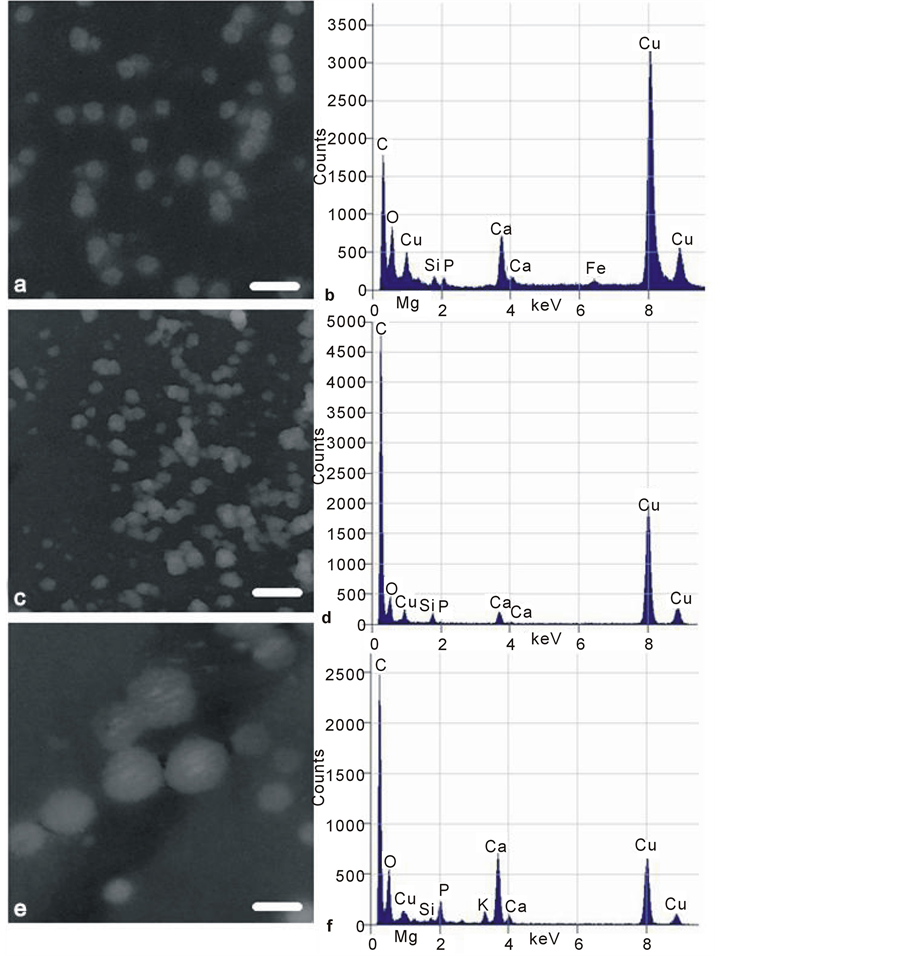
Figure 11. Transmission electron micrographs (TEM) of low contrast mineral nanospheres isolated from (a) pig, (b) osteoporotic, (c) osteoarthritic femoral mature subchondral bone matrix by mechanical crushing. All images as negatives for optimal contrast. Scale bars 100 nm (a) (c) (e), original magnification 80,000×. Corresponding EDX microanalysis spectra (b) (d) (f) are alongside: note the Mg and Si peaks in porcine (b) and OA (f) specimens, and Mg absence from OP (d). A porcine Fe peak is present. Cu peaks are high due to specimen proximity to the copper bars of the support grids.
in men and in premenopausal women [60] ; it was also noted that the dietary Si intake of postmenopausal women in the Dundee area of Scotland was lower than that of younger men and women [61] . Cereals, particularly oatbased, rice, green vegetables, bananas and red lentils are prime sources of dietary Si, while beer, tap water, and certain bottled mineral water contain the greatest quantity of soluble Si [62] . No Si-deficiency pathology has so far been identified [63] , partly because it is so ubiquitous. However, there are chick and rat responses to Si deprivation, and a recent central fundamental role in calcification with phosphate at the level of a bacterium was proposed [23] and recapitulated in osteocytes [55] . Trace elements are not always easy to detect by EDX, as they are often at the edge of instrument sensitivity, may be heterogeneously distributed and the interpretation of spectra requires expertise. Among the populations of particles finding any particular trace element may be likened to “looking for a needle in a haystack,” added to which is the prevention of contamination by environmentally widespread elements, even when precautions are taken of avoiding regular glassware [23] . At the risk of over-interpretation, the evidence above (see also [64] ) may show a paucity of Si and Mg in OA and also in some OP locations. The extent to which such trace elements are instrumental in directly influencing bone salt biology is not clear, although recent reports are compelling (for example, [24] [65] ). Their elevation in young adult and more histologically dynamic bone in comparison with elderly less dynamic OP or elderly and dynamically misdirected OA may be fundamental. For the present it can only be speculated on the tentative data presented that treatment for a Si/Mg imbalance may one day aid elderly skeletal performance.
5. Conclusions
Differences in mineral topography, i.e. inorganic texture, between OP and OA suggest a fundamental bone qualitative factor for consideration in evaluating skeletal structural status. Matrix digestion produced myriads of microspherical objects visible under the optical microscope and in the SEM and also nanospherical objects visible in the TEM. The amorphous: crystalline balance within the calcified microsphere populations, their cell-directed development, eventual size, fabrication number, compaction, bridged aggregation and fusion, together with their extended assembly into diverse geometric constructs (see also [66] for a more collagen-orientated viewpoint of texture) and their bioactivity may be modulated by age and chronic stress patterns on the one hand, together with small quantities of inorganic ions such as Si, Mg, Al, Na, Fe, K and S, on the other, since the populations of calcified objects are not chemically (nor immunologically [20] ) identical. Thus:
• The combination of uncalcified and calcified articular layers within the proximal femur is structurally alike between diverse species, the similarities being greater than the differences, and the porcine most closely resembling the human.
• In OA there is reduced thickness of soft articular cartilage and increased thickness of hard calcified cartilage and subchondral bone. In OP there is the converse.
• The inorganic phase at the calcification front and beyond in mature bone consists of deformable calcified microspheres (filamentous clusters) that can be isolated from the matrix (hydrazine being recorded as the most efficient organic digestion agent) and that variably contain a diversity of inorganic trace elements.
• Calcified microspheres and their nanosphere precursors are too small (with a possible tendency towards poor Mg expression in OP) and too large and element-deficient in OA relative to a young adult reference animal with similar histology.
Finally, while some of the above variation may be due to manipulation and treatment, the differences do seem to have a basis in structural reality. To use an analogy, the wellbeing of soil and its fluid flow is dependent upon its mix of particulates; in clay the particulates are fine and their settlement compact and prone to slow water passage as a consequence; in sand the particulates are large and their settlements open and prone to rapid water passage as a result. A mix is best, and perhaps just as optimum ionic exchange and fluid flow in soil is dependent upon its particulate mix, so also may they be in bone.
Acknowledgements
Dedicated to Dr. F. G. E. Pautard [67] . The authors are indebted to A. Hick, J. Hudson, and J. Harrington for electron microscopy expertise, P. A. Shore for advice on hard tissue histology, Dr. M. Walker, Dr. E. Hensor and Prof. K. Holland for statistical advice, undergraduate students Anna K. O’Neill for Figure 3 and Anna L. Rooke for fine image confirmation, Dr. H. Berry and T. Stapleton for animal femoral heads, and D. McDermott for expertise in the preparation of illustrations. JEA and PAS were supported by Action Medical Research and the HSA Charitable Trust and in addition by Research into Ageing.
References
- Miller, L.M., Tetenbaum Novatt, J., Hamerman, D. and Carlson, C.S. (2004) Alterations in Mineral Composition Observed in Osteoarthritic Joints of Cynomolgus Monkeys. Bone, 35, 498-506. http://dx.doi.org/10.1016/j.bone.2004.03.034
- Cooper, C., Cook, P.L., Osmond, C., Fisher, L. and Cawley. M.I.D. (1991) Osteoarthritis of the Hip and Osteoporosis of the Proximal Femur. Annals of the Rheumatic Diseases, 50, 540-542. http://dx.doi.org/10.1136/ard.50.8.540
- Hordon, L.D., Wright, V. and Smith, M.A. (1992) Bone Mass in Osteoarthritis. Annals of the Rheumatic Diseases, 51, 823-825. http://dx.doi.org/10.1136/ard.51.6.823
- Mattei, J.P. and Roux, H. (1999) New Potential Therapeutic Goals: Subchondral Bone and Progression of Osteoarthritis. Osteoarthritis Cartilage, 7, 329-330. http://dx.doi.org/10.1053/joca.1998.0184
- Bergink, A.P., Uitterlinden, A.G., van Leeuwen, J.P.T.M., Hofman, A., Verhaar, J.A.N. and Pols, H.A.P. (2005) Bone Mineral Density and Progressive Radiographic Knee Osteoarthritis in Elderly Men and Women: the Rotterdam Study. Bone, 37, 446-456. http://dx.doi.org/10.1016/j.bone.2005.05.001
- Marcus, R. (1996) The Nature of Osteoporosis. The Journal of Clinical Endocrinology and Metabolism, 81, 1-5.
- Aaron, J.E. (2003) Bone Turnover and Microdamage. Advances in Osteoporotic Fracture Management, 2, 102-110.
- Loveridge, N., Power, J., Reeve, J. and Boyde, A. (2004) Bone Mineralization Density and Femoral Neck Fragility. Bone, 35, 929-941. http://dx.doi.org/10.1016/j.bone.2004.05.025
- Dmitrovsky, E., Lane, L.B. and Bullough, P.G. (1978) The Characterization of the Tidemark in Human Articular Cartilage. Metabolic Bone Disease and Related Research, 1, 115-118. http://dx.doi.org/10.1016/0221-8747(78)90047-4
- Bullough, P.G. and Jagannath, A. (1983) The Morphology of the Calcification Front in Articular Cartilage. Journal of Bone and Joint Surgery, 65B, 72-78.
- Burr, D.B. and Schaffler, M.B. (1997) The Involvement of Subchondral Mineralised Tissues in Osteoarthrosis: Quantitative Microscopic Evidence. Microscopy Research and Technique, 37, 343-357. http://dx.doi.org/10.1002/(SICI)1097-0029(19970515)37:4<343::AID-JEMT9>3.0.CO;2-L
- Kuettner, K.E. and Thonar, E.J.M.A. (1998) Cartilage Integrity and Homeostasis. In: Klippel, J.H. and Dieppe, P., Eds., Rheumatology, 2nd Edition, Mosby, St Louis, 8.6.1-8.6.18.
- Boyde, A. (1980) Electron Microscopy of the Mineralizing Front. Metabolic Bone Disease and Related Research, 25, 69-78.
- Carter, D.H., Hatton, P.V. and Aaron, J.E. (1997) The Ultrastructure of Slam-Frozen Bone Mineral. The Histochemical Journal, 29, 783-793. http://dx.doi.org/10.1023/A:1026425404169
- Termine, J.D. and Posner, A.S. (1967) Amorphous/Crystalline Interrelationships in Bone Mineral. Calcified Tissue Research, 1, 8-23. http://dx.doi.org/10.1007/BF02008070
- Eanes, E.D., Termine, J. and Posner, A. (1967) Amorphous Calcium Phosphate in Skeletal Tissues. Clinical Orthopaedics and Related Research, 53, 223-235. http://dx.doi.org/10.1097/00003086-196707000-00024
- Aaron, J.E. (1981) Alkaline Phosphatase, Vesicles and Calcification. Metabolic Bone Disease and Related Research, 25, 151-157.
- Lester, K.S. and Ash Jr., M.M. (1980) Scanning Electron Microscopy of Mineralized Cartilage in Rat Mandibular Condyle. Journal of Ultrastructure Research, 72, 141-150. http://dx.doi.org/10.1016/S0022-5320(80)90052-0
- Aaron, J.E., Oliver, B., Clarke, N. and Carter, D.H. (1999) Calcified Microspheres as Biological Entities and Their Isolation from Bone. The Histochemical Journal, 31, 455-470. http://dx.doi.org/10.1023/A:1003707909842
- Carter, D.H., Scully, A.J., Davies, R.M. and Aaron, J.E. (1998) Evidence for Phosphoprotein Microspheres in Bone. The Histochemical Journal, 30, 677-686. http://dx.doi.org/10.1023/A:1003490506980
- Carter, D.H., Scully, A.J., Heaton, D.A., Young, M.P. and Aaron, J.E. (2002) Effect of Deproteination on Bone Mineral Morphology: Implications for Biomaterials and Aging. Bone, 31, 389-395. http://dx.doi.org/10.1016/S8756-3282(02)00840-2
- Clark, I. and Belanger, L. (1967) The Effects of Alterations in Dietary Magnesium on Calcium, Phosphate and Skeletal Metabolism. Calcified Tissue Research, 1, 204-218. http://dx.doi.org/10.1007/BF02008092
- Linton, K.M., Tapping, C.R., Adams, D.G., Carter, D.H., Shore, R.C. and Aaron, J.E. (2013) A Silicon Cell Cycle in a Bacterial Model of Calcium Phosphate Mineralogenesis. Micron, 44, 419-432. http://dx.doi.org/10.1016/j.micron.2012.09.008
- Ereiba, K.M.T., Mostafa, A.G., Gamal, G.A. and Said, A.H. (2013) In Vitro Study of Iron Doped Hydroxyapatite. Journal of Biophysical Chemistry, 4, 122-130. http://dx.doi.org/10.4236/jbpc.2013.44017
- Williams, R.J.P. (1978) Introduction. In: Williams, R.J.P. and Da Silva, J.R.R.F., Eds., New Trends in Bioinorganic Chemistry, Academic Press, London, 1-10.
- Aaron, J.E. and Shore, P.A. (2004) Histomorphometry. In: Langton, C.M. and Njeh, C.F., Eds., The Physical Measurement of Bone, Institute of Physics Publishing, Bristol, 185-224. http://dx.doi.org/10.1887/0750308389/b1152c6
- Termine, J.D., Eanes, E.D., Greenfield, D.J., Nylen, M.U. and Harper, R.A. (1973) Hydrazine-Deproteinated Bone Mineral. Calcified Tissue Research, 12, 73-90. http://dx.doi.org/10.1007/BF02013723
- Termine, J.D. (1972) Mineral Chemistry and Skeletal Biology. Clinical Orthopaedics and Related Research, 85, 207-241. http://dx.doi.org/10.1097/00003086-197206000-00036
- Carter, D.H., Scully, A.J., Hatton, P.V., Davies, R.M. and Aaron, J.E. (2000) Cryopreservation and Image Enhancement of Juvenile and Adult Dentine Mineral. Histochemical Journal, 32, 253-261. http://dx.doi.org/10.1023/A:1004059219242
- Aaron, J.E., Shore, P.A., Itoda, M., Morrison, R.J.M., Hartopp, A., Hensor, E.M.A. and Hordon, L.D. (2014) Mapping Trabecular Disconnection “Hotspots” in Aged Spine and Hip. Submitted.
- Li, B. and Aspden, R.M. (1997) Mechanical and Material Properties of the Subchondral Bone Plate from the Femoral Head of Patients with Osteoporosis or Osteoarthritis. Annals of the Rheumatic Diseases, 56, 247-254. http://dx.doi.org/10.1136/ard.56.4.247
- Matsui, H., Shimizu, M. and Tsuji, H. (1997) Cartilage and Subchondral Bone Interaction in Osteoarthrosis of Human Knee Joint: A Histological and Histomorphometric Study. Microscopy Research and Technique, 37, 333-342. http://dx.doi.org/10.1002/(SICI)1097-0029(19970515)37:4<333::AID-JEMT8>3.0.CO;2-L
- Boyd, S.K., Müller, R., Matyas, J.R., Wohl, G.R. and Zernicke, R.F. (2000) Early Morphometric and Anisotropic Change in Periarticular Cancellous Bone in a Model of Experimental Knee Osteoarthritis Quantified Using Microcomputed Tomography. Clinical Biomechanics, 15, 624-631. http://dx.doi.org/10.1016/S0268-0033(00)00023-1
- Fazzalari, N.L., Darracott, J. and Vernon-Roberts, B. (1988) Histomorphometric Changes in the Trabecular Structure of a Selected Stress Region in the Femur in Patients with Osteoarthritis and Fracture of the Femoral Neck. Bone, 6, 125-133. http://dx.doi.org/10.1016/8756-3282(85)90044-4
- Oegema, T.R., Carpenter, R.J., Hofmeister, F. and Thompson Jr., R.C. (1997) The Interaction of the Zone of Calcified Cartilage and Subchondral Bone in Osteoarthritis. Microscopy Research and Technique, 37, 324-332. http://dx.doi.org/10.1002/(SICI)1097-0029(19970515)37:4<324::AID-JEMT7>3.0.CO;2-K
- Burr, D.B. (1998) The Importance of Subchondral Bone in Osteoarthrosis. Current Opinion in Rheumatology, 10, 256-262. http://dx.doi.org/10.1097/00002281-199805000-00017
- Lajeunesse, D., Hilal, G., Pelletier, J. and Martel-Pelletier, J. (1999) Subchondral Bone Morphological and Biochemical Alterations in Osteoarthritis. Osteoarthritis and Cartilage, 7, 321-322. http://dx.doi.org/10.1053/joca.1998.0180
- Macys, J.R., Bullough, P.G. and Wilson Jr., P.D. (1980) Coxarthrosis: A Study of the Natural History Based on a Correlation of Clinical, Radiographic and Pathological Findings. Seminars in Arthritis and Rheumatism, 10, 66-80. http://dx.doi.org/10.1016/0049-0172(80)90015-3
- Ho, A.M., Johnson, M.D. and Kingsley, D.M. (2000) Role of the Mouse ank Gene in Control of Tissue Calcification and Arthritis. Science, 289, 265-270. http://dx.doi.org/10.1126/science.289.5477.265
- Aaron, J.E. and Pautard, F.G. (1972) Ultrastructural Features of Phosphate in Developing Bone Cells. Israel Journal of Medical Sciences, 81, 625-629.
- Pautard, F.G.E. (1966) A Biomolecular Survey of Calcification. In: Fleisch, H., Blackwood, J. and Owen, M., Eds., Calcified Tissues, Springer, Berlin, 108-118.
- Pautard, F.G.E. (1981) Calcium Phosphate Microspheres in Biology. Progress in Crystal Growth and Characterization, 4, 89-98. http://dx.doi.org/10.1016/0146-3535(81)90049-6
- Little, K. (1973) Bone Behaviour. Academic Press, London.
- Kashiwa, H.K. (1970) Mineralized Spherules in Cartilage of Bone Revealed by Cytochemical Methods. American Journal of Anatomy, 129, 459-465. http://dx.doi.org/10.1002/aja.1001290407
- Koshihara, Y., Kawamura, M., Oda, H. and Higaki, S. (1987) In Vitro Calcification in Human Osteoblastic Cell Line Derived from Periosteum. Biochemical and Biophysical Research Communications, 145, 651-657. http://dx.doi.org/10.1016/0006-291X(87)91014-X
- Aaron, J.E. (1973) Osteocyte Types in the Developing Mouse Calvarium. Calcified Tissue Research, 12, 259-279. http://dx.doi.org/10.1007/BF02013740
- Roach, H.I. (1997) New Aspects of Endochondral Ossification in the Chick: Chondrocyte Apoptosis, Bone Formation by Former Chondrocytes, and Acid Phosphatase Activity in the Endochondral Bone Matrix. Journal of Bone and Mineral Research, 12, 795-805. http://dx.doi.org/10.1359/jbmr.1997.12.5.795
- Chang, Y.L., Stanford, C.M. and Keller, J.C. (2000) Calcium and Phosphate Supplementation Promotes Bone Cell Mineralization: Implications for Hydroxyapatite (HA)-Enhanced Bone Formation. Journal of Biomedical Materials Research, 52, 270-278. http://dx.doi.org/10.1002/1097-4636(200011)52:2<270::AID-JBM5>3.0.CO;2-1
- Kato, Y., Boskey, A., Spevak, L., Dallas, M., Hori, M. and Bonewald, L.F. (2001) Establishment of an Osteoid Preosteocyte-Like Cell MLO-A5 that Spontaneously Mineralizes in Culture. Journal of Bone and Mineral Research, 16, 1622-1633. http://dx.doi.org/10.1359/jbmr.2001.16.9.1622
- Barragan-Adjemian, C., Nicolella, D., Dusevich, V., Dallas, M.R., Eick, J.D. and Bonewald, L.F. (2006) Mechanism by Which MLO-A5 Late Osteoblasts/Early Osteocytes Mineralize in Culture: Similarities with Mineralization of Lamellar Bone. Calcified Tissue International, 79, 340-353. http://dx.doi.org/10.1007/s00223-006-0107-2
- Feng, J.Q., Ward, L.M., Liu, S., Lu, Y., Xie, Y., Yuan, B., Yu, X., Rauch, F., Davis, S.I., Zhang, S., Rios, H., Drezner, M.K., Quarles, L.D., Bonewald, L.F. and White, K.E. (2006) Loss of DMP1 Causes Rickets and Osteomalacia and Identifies a Role for Osteocytes in Mineral Metabolism. Nature Genetics, 38, 1310-1315. http://dx.doi.org/10.1038/ng1905
- Mahamid, J., Aichmeyer, B., Shimoni, E., Ziblat, R., Li, C., Siegel, S., Paris, O., Fratzl, P., Weiner, S. and Addadi, L. (2010) Mapping Amorphous Calcium Phosphate Transformation into Crystalline Mineral from the Cell to the Bone in Zebrafish Fin Rays. Proceedings of the National Academy of Sciences of the United States of America, 107, 6316-6321. http://dx.doi.org/10.1073/pnas.0914218107
- Aaron, J.E. and Pautard, F.G.E. (1978) A Cell Cycle in Bone Mineralization. In: Balls, M. and Billett, F.S., Eds., The Cell Cycle in Development and Differentiation, University Press, Cambridge, 325-330.
- Fallon, V. (2006) The Fabrication of Mineral Particles by Bone Cells and Unicellular Organisms. Ph.D. Dissertation, University of Leeds, Leeds.
- Fallon, V., Carter, D.H. and Aaron, J.E. (2014) Mineral Fabrication and Golgi Apparatus Activity in the Mouse Calvarium. Journal of Biomedical Science and Engineering, in press.
- Carlisle, E. (1974) Silicon as an Essential Element. Federation Proceedings, 33, 1758-1766.
- Birchall, J.D. (1978) Silicon in the Biosphere. In: Williams, R.J.P. and da Silva, J.R.R.F., Eds., New Trends in Bioinorganic Chemistry, Academic Press, London, 209-252.
- Bernard, G.W. and Pease, D.C. (1969) An Electron Microscope Study of Initial Intramembranous Osteogenesis. American Journal of Anatomy, 125, 271-290. http://dx.doi.org/10.1002/aja.1001250303
- Reffitt, D.M., Ogston, N., Jugdaohsingh, R., Cheung, H.F.J., Evans, B.A.J., Thompson, R.P.H., Powell, J.J. and Hampson, G.N. (2003) Orthosilicic Acid Stimulates Collagen Type I Synthesis and Osteoblastic Differentiation in Human Osteoblast-Like Cells in Vitro. Bone, 32, 127-135. http://dx.doi.org/10.1016/S8756-3282(02)00950-X
- Jugdaohsingh, R., Tucker, K.L., Qiao, N., Cupples, A., Kiel, D.P. and Powell, J.J. (2004) Dietary Silicon Intake Is Positively Associated with Bone Mineral Density in Men and Premenopausal Women of the Framingham Offspring Cohort. Journal of Bone and Mineral Research, 19, 297-307. http://dx.doi.org/10.1359/JBMR.0301225
- McNaughton, S.A., Bolton-Smith, C., Mishra, G.D., Jugdaohsingh, R. and Powell, J.J. (2005) Dietary Silicon Intake in Postmenopausal Women. British Journal of Nutrition, 94, 813-817. http://dx.doi.org/10.1079/BJN20051548
- Powell, J.J., McNaughton, S.A., Jugdaohsingh, R., Anderson, S.H.C., Dear, J., Khot, F., Mowatt, L., Gleason, K.L., Sykes, M., Thompson, R.P.H., Bolton-Smith, C. and Hodson, M.J. (2005) A Provisional Database for the Silicon Content of Foods in the United Kingdom. British Journal of Nutrition, 94, 804-812. http://dx.doi.org/10.1079/BJN20051542
- Jugdaohsingh, R., Anderson, S.H.C., Tucker, K.L., Elliott, H., Kiel, D.P., Thompson, R.P.H. and Powell, J.J. (2002) Dietary Silicon Intake and Absorption. American Journal of Clinical Nutrition, 75, 887-893.
- Linton, K.M. (2007) Calcium Phosphate Morphology in Bone and Bacteria. Ph.D. Dissertation. University of Leeds, Leeds.
- Exley, C. (2012) Reflections upon a Recent Insight into the Mechanism of Formation of Hydroxyaluminosilicates and the Therapeutic Potential of Silicic Acid. Coordination Chemistry Reviews, 256, 82-88. http://dx.doi.org/10.1016/j.ccr.2011.06.022
- Olszta, M.J., Cheng, X., Jee, S.S., Kumar, R., Kim, Y.Y., Kaufman, M.J., Douglas, E.P. and Gower, L.B. (2007) Bone Structure and Formation: A New Perspective. Materials Science and Engineering: R: Reports, 58, 77-116. http://dx.doi.org/10.1016/j.mser.2007.05.001
- Pautard, F.G.E. (1978) Phosphorous and Bone. In: Williams, R.J.P. and Da Silva, J.R.R.F., Eds., New Trends in Bio-Inorganic Chemistry, Academic Press, London, New York, San Fransisco, 261-354.
NOTES
![]()
#Present address: Department of Histopathology, Queen Alexandra Hospital, Portsmouth, UK.
*Corresponding author.