Journal of Geographic Information System
Vol. 4 No. 4 (2012) , Article ID: 22157 , 6 pages DOI:10.4236/jgis.2012.44043
GIS and Remote Sensing to Investigate Urban Growth in Mafraq City/Jordan between 1987 and 2010
1Institute of Earth and Environmental Science, Al al-Bayt University, Mafraq, Jordan
2Department of Surveying Engineering, Faculty of Engineering, Al al-Bayt University, Mafraq, Jordan
Email: *ridaali@aabu.edu.jo
Received May 6, 2012; revised June 9, 2012; accepted July 3, 2012
Keywords: Jordan; Mafraq; Urban Growth; GIS; Remote Sensing; Google Earth
ABSTRACT
The spatial, temporal and spectral characteristics of the remote sensing data are effectively used in land use and land cover change mapping, hence helping in decision making for sustainable land resource management. The aim of the study is to map urbanization growth using satellite imagery, Google imagery and GIS in Mafraq city/North Jordan. Landsat imageries of 1987, 2005 and Google Earth (GeoEye-1) imagery of 2010 were used in GIS environment to map the change in the urbanization at Mafraq city. Maximum likelihood algorithm of supervised classification was used to delineate two land use and land cover classes for the study area, namely: populated areas and non-populated areas from 1987 and 2005 imageries. On-Screen digitizing was adopted on Google Earth (GeoEye-1) imagery of 2010 to map the populated areas. The main change observed for the time period of 1987-2010 was that the urbanized areas have increased approximately by 7.14 km2 (approximately 23% of the study area). The population density within the study area has increased from approximately 965 inhabitants per sq. km in 1987 to 1808 inhabitants per sq. km in 2005 and reached 2146 inhabitants per sq. km in 2010. The increase in the populated area within Mafraq city has impacted the surface hydrology runoff which leads to diverting some Wadis to avoid passing through the city centre. Also, the increase in urbanization in Mafraq city has put more pressures on the waste water treatment plant and solid waste dumpsite that serve Mafraq city.
1. Introduction
Land use/land cover changes play a major role in the study of global change. The human modifications have largely resulted in biodiversity loss, global warming and deforestation [1]. These environmental problems are often related to land use/land cover changes. Therefore, available data on Land use/land cover changes can provide critical input to decision-making of environmental management and planning the future [2]. The growing population and increasing socio-economic necessities creates a pressure on land use/land cover. This pressure results in unplanned and uncontrolled changes in land use/land cover changes [3].
Geographical Information Systems (GIS) and remote sensing are powerful tools to derive accurate and timely information on the spatial distribution of land use/land cover changes over large areas ([4,5]). GIS and Remote Sensing have been combined to detect and control urban encroachment in a way, which is easier and faster than the traditional methods of surveying the urban environment [6].
Remote sensing data are primarily used in change detection studies. Change detection involves the application of various image analysis techniques to multi-temporal images in order to quantify variations in the state and spatial distribution of phenomena and objects [7]. GIS for undertaking integrated analysis, presentations of spatial and associated attribute data and Remote Sensing (RS) for capturing the spatial data are found to be of immense use in urbanization planning.
The main aim of this study is to apply a multi-temporal remote sensing and GIS techniques for monitoring urban lands changes from 1987 to 2010 in Mafraq city/ Jordan. Two Landsat images for 1987, 2005 and Google Earth Imagery (2010) have been used and the analysis was carried out using the ERDAS Imagine 9.2 and ArcGIS 9.3 software.
2. Methods
2.1. Study Area
The study area is located in the Northern part of Jordan at 32˚20'34"N and 36˚12'28"E as shown in Figure 1 with
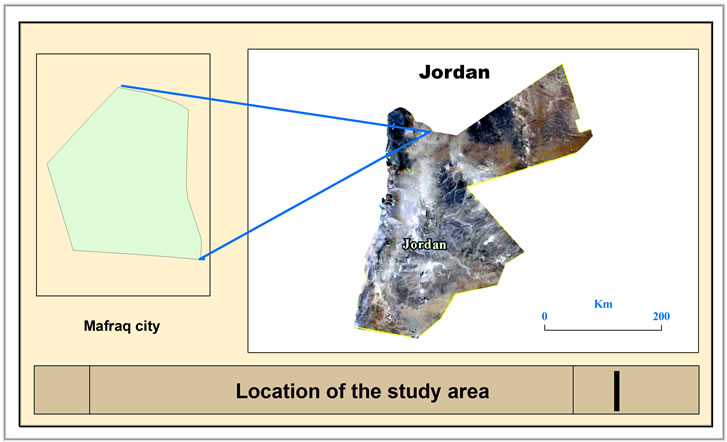
Figure 1. Location of the study area.
an area of 31 km2. Mafraq is the capital city of Mafraq governorate and is located 80 km to the North East of the Jordanian capital Amman. The population of Mafraq city has increased from 29,918 inhabitants in the year 1987 to 66,548 inhabitants in the year 2010 with approximate annual growth rate of 3.5% and it is expected to reach 93872 inhabitants by 2020 ([8,9]).
The Elevation in the study area varies between 638 m a.s.l in the Northeast part to 750 m a.s.l in the Northwest part of the area (Figure 2).
2.2. Data Collection
The study is based primarily on using secondary data. The secondary data included Landsat remote sensing data and Google Earth Imagery as data sources for derivation of generalized land-change information. Landsat satellites provide multispectral data from the early 1970s to the present [10]. Given that the purpose of this paper was to provide a general land change analysis, the spatial resolution of Landsat data was appropriate. The landsat imageries were available for this research at no cost from the Global Land Cover Facility (GLCF) (http://glcf. umiacs.umd.edu/index.shtml).
Two Landsat images listed in (Table 1) were used in this analysis of land use and land cover change; they were acquired from the Global Land Cover Facility. Also, a Google Earth Imagery of the area in 2010 was used to derive the general land use map of the study area. SRTM (Shuttle Radar Topography Mission) of United States Geological Survey (USGS) data were used to derive the digital elevation model for the study area and hence the surface water hydrology map.
2.3. Data Processing
2.3.1. SRTM Data
Using ArcGIS software, a DEM was created using 30 m USGS SRTM data (Figure 2) followed by extracting the surface water hydrology map (Wadi) for the study area using Flow Direction and Flow Accumulation commands
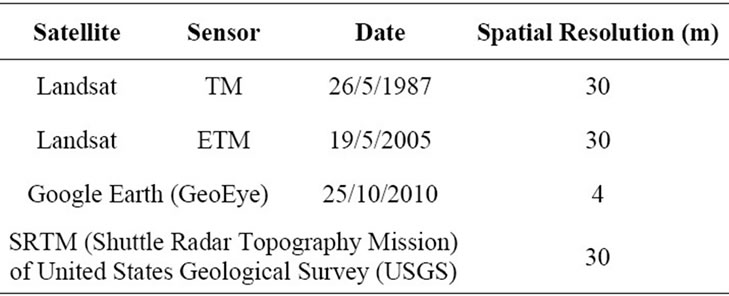
Table 1. Used data.
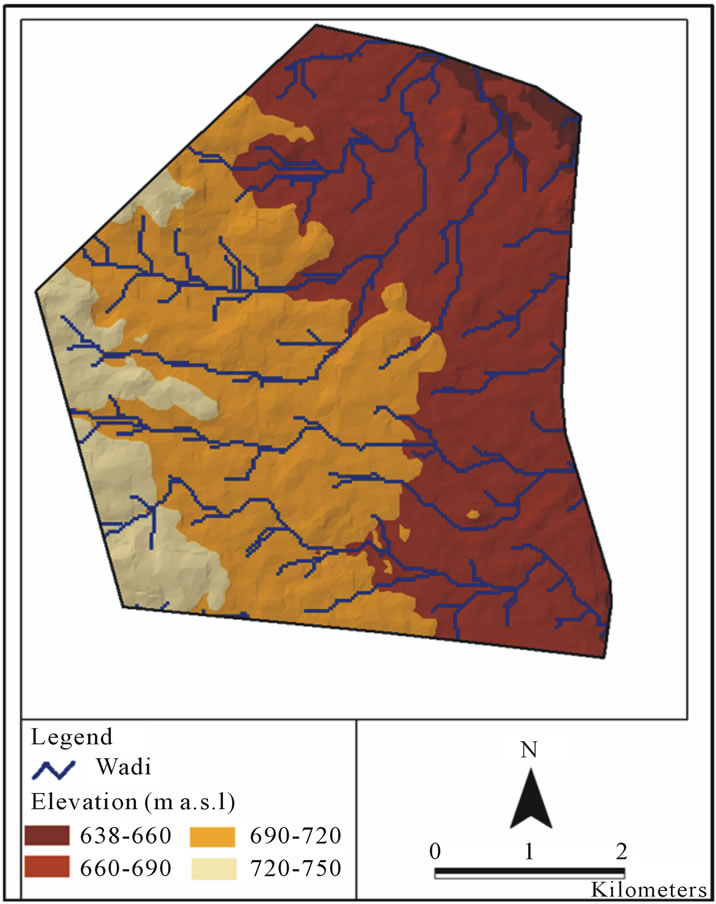
Figure 2. Digital elevation model of the study area and surface hydrology.
(Figure 3). This step was essential to investigate the influence of urbanization on the surface water hydrology within Mafraq city area. This figure shows that Wadis in the area flow from West to East following the topography that characterized the study area.
2.3.2. Landsat Imageries
Landsat data represented the best match in time frame. In this research, two scenes of Landsat images were acquired and processed. The first imagery is of 1987 (TM data), and the second imagery is of 2005 (ETM data). These imageries were projected into Jordan Transverse Mercator (JTM) map coordinates. A generalized classification scheme was adopted in order to investigate the urban growth that included two land-cover categories: Populated areas and non-populated areas.
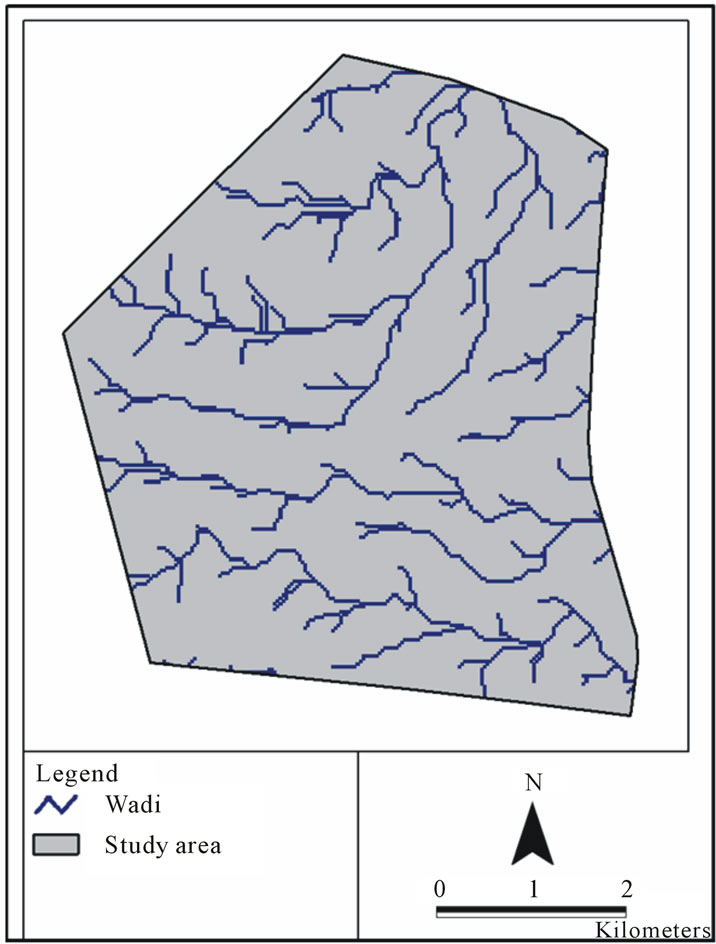
Figure 3. Surface hydrology of the study area.
Supervised classification was applied on the 1987 and 2005 imageries using ERDAS Imagine 9.2. The classification technique was based on using the maximum likelihood classification (MLC). Despite the fact that MLC is a statistically complicated technique to classify images for change detection, it was considered to be the most effective method for supervised classification ([11,12]).
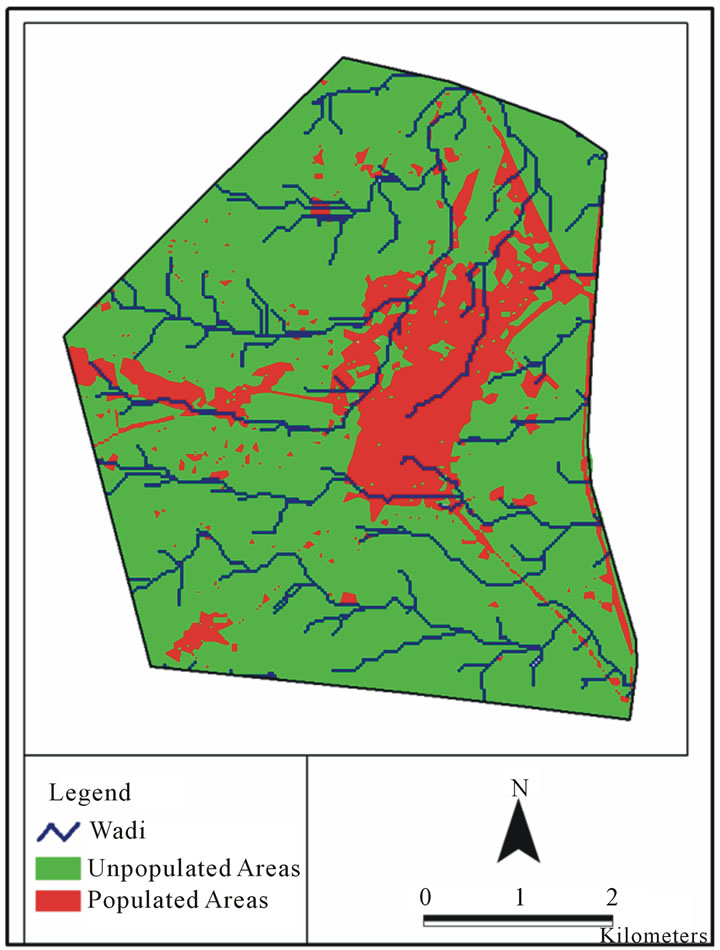
In this research, the study area was divided into two categories; populated areas, and unpopulated areas. Multiple signatures were selected to represent the spectral variations for each class. Upon finishing the supervised classification, the classes were recoded into appropriate land-cover categories, which resulted in final land-cover types defined by the classification scheme. The classified images contain different grid format land use types were transformed into vector format using ArcGIS 9.3 software. The output data were saved as a vector file enabling analysis of urban change using geographic information system (GIS) software. The results for the years 1987 and 2005 are shown in Figures 4 and 5 respectively.
2.3.3. Google Earth Imagery
Google Earth is program that was originally created by Keyhole Inc., to map the Earth by the superimposition of images obtained from different sources including satellite imagery, aerial photography and GIS maps. In this
 (a)
(a)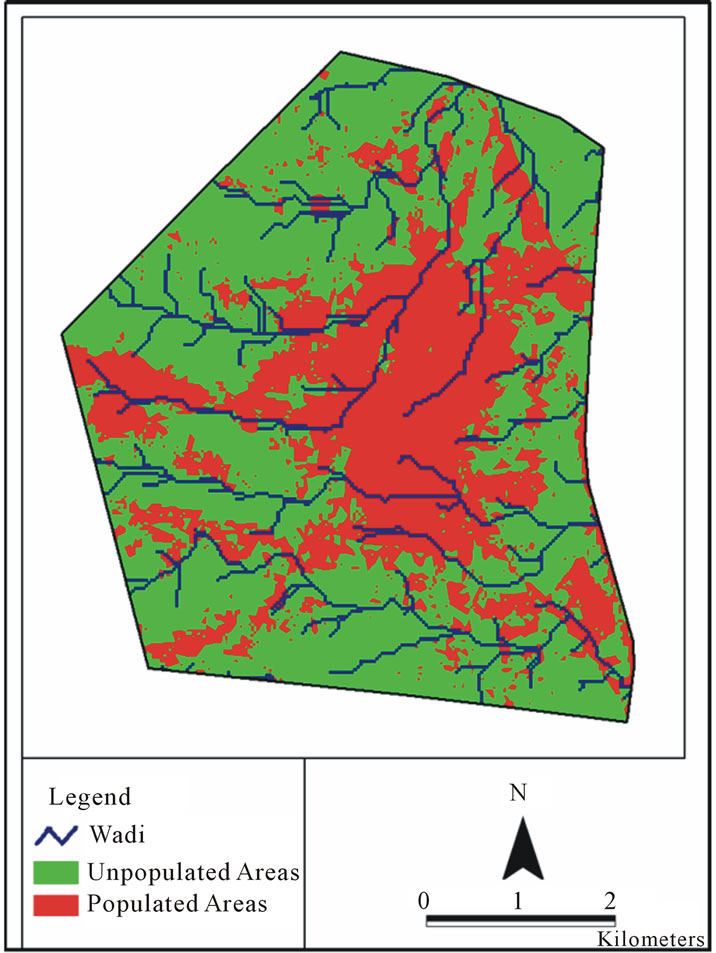 (b)
(b)
Figure 4. (a) land use map (1987); (b) land use map (2005).
research, the latest imagery available from Google Earth for the study area is dated 25-October-2010 and is based on a satellite imagery acquired by GeoEye-1. Google has exclusive online mapping use of the GeoEye-1 satellite imageries. GeoEye-1 has the highest resolution of any commercial imaging system and can collect images with a ground resolution of 0.41 meters in the panchromatic or black and white mode. It collects multispectral or color imagery at 1.65 meter resolution, with four-band multispectral imaging capabilities (www.geoeye.com).
Google Earth has been used in several research including disaster and crisis-management support [13], the influence of land use on the urbanization [14], the use of crowd sourcing to improve global land cover [15], landscape cover-type modeling using a MultiScene Thematic Mapper mosaic [16], Water Harvesting siting in the Jordanian Badia [17], and mapping the appropriate sites for the cultivation of forage in the Jordanian Badia [18]. Also, Google Earth has been used for the recent validation of remote sensing derived products e.g., the European forest cover map [19].
Figure 5 shows the Google Earth imagery for the study area. A methodology adopted by [20] in which onscreen digitizing is used to map potential land use classes was applied in this research. On-screen digitizing is an interactive process in which a map is created using previously digitized of scanned information. The process of on-screen digitizing is similar to conventional digitizing. Rather than using a digitizer and a cursor, the user creates
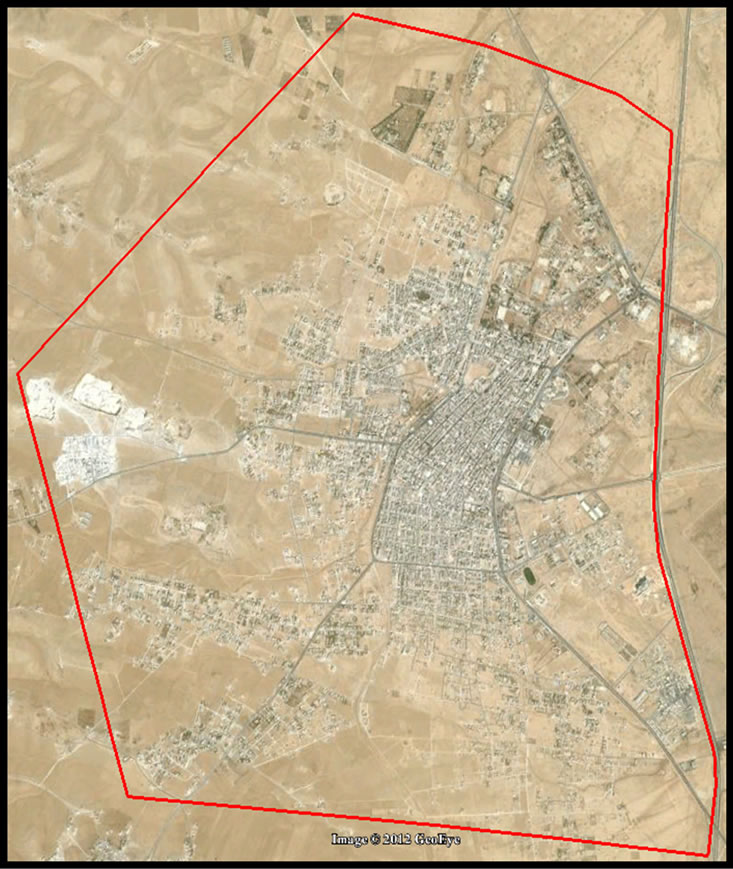
Figure 5. Google earth imagery (2010) (GeoEye).
the map layer up on the screen with the mouse and typically with referenced information as a background.
Manual on-screen digitizing method process is slower than the automatic one but it has more close results as the real feature forms [21].
The digitized map was saved as a KML (Keyhole Markup Language) file and then exported to ArcGIS 9.3 for further subsequent analysis. The resulted map is shown in Figure 6.
3. Results and Discussion
The 1987, 2005 imageries and the digitized map of 2010 were statistically analyzed using ArcGIS software. The obtained Land change classification statistics are listed in Table 2, for the years of 1987, 2005 and 2010.
As listed in Table 2, there was consistent increase in the populated areas in the study area from 18.6% in 1987
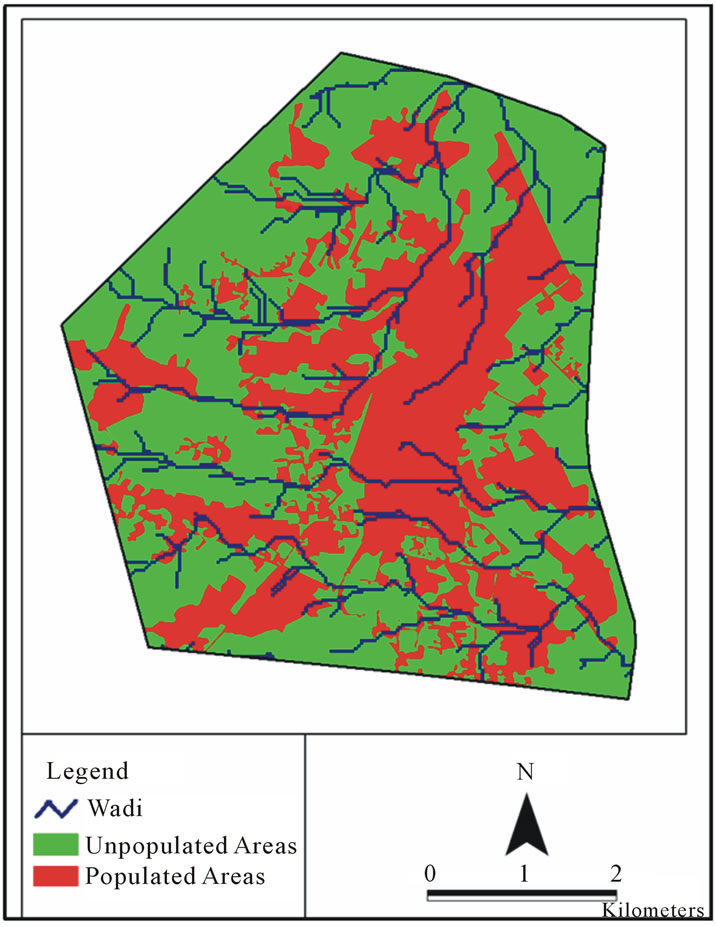
Figure 6. land use map (2010).
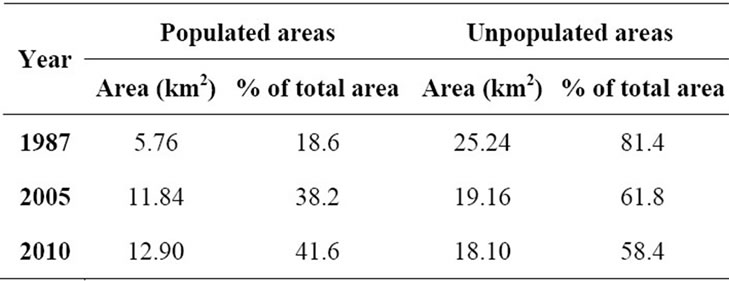
Table 2. The ratio changes of urban land use types.
to 38.2% in 2005 to 41.6% in 2010, suggesting that the urbanization is the main driving forces affect the city land use change. The increase was a result of rapid development in terms of urbanization and urban expansion to meet the economic demands. The average annual increase in urbanization between 1987 and 2005 is approximately 1%, while the annual increase in urbanization between 2005 and 2010 is approximately 0.7%. Based on Table 2 and population figures of 1987, 2005 and 2010, it is estimated that the population density within the study area has increased from approximately 965 inhabitants per sq. km in 1987 to 1808 inhabitants per sq. km in 2005 and reached 2146 inhabitants per sq. km in 2010.
The increase in the populated area within Mafraq city has impacted the surface hydrology runoff which leads to diverting some Wadis to avoid passing through the city centre. However, in thunderstorm events, most of Mafraq city roads are flooded with water. No proper surface water management is in place at the mean time. Also, the increase in urbanization in Mafraq city has put more pressure on the existing waste water treatment plant that exists 15 km to the north of the study area. Furthermore, the increase in population has added more daily solid waste to the only solid waste dumpsite that serve Mafraq city (30 km to the east of the study area).
4. Summary and Conclusions
Remote sensing is an excellent data source for monitoring the urban land use change while GIS has strong spatial and statistical analysis capabilities.
In this research, Landsat imageries and Google Earth imageries were used within RS and GIS environments to estimate the rate of urbanization in Mafraq city between 1987 and 2010. The main change observed for the time period of 1987-2010 was that the urbanized areas have increased approximately by 7.14 km2 (approximately 23% of the study area).
The driving factors behind such increase in urbanization in Mafraq city are the migration from rural areas surrounding Mafraq city, the establishment of Al al-Bayt University in the early 1990’s, the return of more than 500,000 Jordanian from the Gulf States after the 1991 Gulf war, and the massive immigration of Iraqis to Jordan after the 2003 war on Iraq.
In conclusion, the combination of remote sensing and geographical information system and the use of free satellite data (Landsat and Google Earth) showed that it is possible to estimate the spatiotemporal urban growth.
REFERENCES
- J. P. Guerschman, J. M. Paruelo, C. D. Bela, M. C. Giallorenzi and F. Pacin, “Land Cover Classification in the Argentine Pampas Using Multi-Temporal Landsat TM Data,” International Journal of Remote Sensing, Vol. 24, No. 17, 2003, pp. 3381-3402. doi:10.1080/0143116021000021288
- B. Prenzel, “Remote Sensing-Based Quantification of Land-Cover and Land-Use Change for Planning,” Progress in Planning, Vol. 61, No. 4, 2004, pp. 281-299.
- K. C. Seto, C. E. Woodcock, C. Song, X. Huang, J. Lu and R. K. Kaufmann, “Monitoring Land Use Change in the Pearl River Delta Using Landsat TM,” International Journal of Remote Sensing, Vol. 23, No. 10, 2002, pp. 1985-2004.
- T. N. Carlson and S. G. A. Azofeifa, “Satellite Remote Sensing of land Use changes in and around San Jose´, Costa Rica,” Remote Sensing of Environment, Vol. 70, No. 3, 1999, pp. 247-256.
- D. Zsuzsanna, J. Bartholy, R. Pongracz and Z. Barcza, “Analysis of Land-Use/Land-Cover Change in the Carpathian Region Based on Remote Sensing Techniques,” Physics and Chemistry of Earth, Vol. 30, No. 1-3, 2005, pp. 109-115.
- S. M. F. Da Costa and J. P. Cintra, “Environmental Analysis of Metropolitan Areas in Brazil,” ISPRS Journal of Photogrammetry & Remote Sensing, Vol. 54, No. 1, 1999, pp. 41-49.
- D. Lu, P. Mausel, E. Brondi’zio and E. Moran, “Change Detection Techniques,” International Journal of Remote Sensing, Vol. 25, No. 12, 2004, pp. 2365-2407.
- DOS (Jordan Department of Statistics), “Population Censuses,” 2010. www.dos.gov.jo
- Mafraq Municipality, “Population and Houses in Mafraq,” Open Files, Personal Communication, 2012.
- J. Rogan, J. Franklin and D. A. Roberts, “A Comparison of Methods for Monitoring Multi Temporal Vegetation Change Using Thematic Mapper Imagery,” Remote Sensing of Environment, Vol. 80, No. 1, 2002, pp. 143-156.
- F. Csillage, “Comparison of Some Classification Methods on a Set Site (Kiskore, Hungary): Separability as a Measure of Accuracy,” International Journal of Remote Sensing, Vol. 7, No. 12, 1986, pp. 1705-1714.
- I. L. Thomas, V. M. Benning and N. P. Ching, “Classification of Remotely Sensed Images,” Adam Hilger, Bristol 1987.
- S. Voigt, T. Kemper, T. Riedlinger, R. Kiefl, K. Scholte and H. Mehl, “Satellite Image Analysis for Disaster and Crisis-Management Support,” IEEE Transactions on Geoscience and Remote Sensing, Vol. 45, No. 6, 2007, pp. 1520-1528.
- S. K. Jusuf, N. H. Wong, E. Hagen, R. Anggoro and H. Yan, “The Influence of Land Use on the Urban Heat Island in Singapore,” Habitat International, Vol. 31, No. 2, 2009, pp. 232-242.
- S. Fritz, I. McCallum, C. Schill, C. Perger, R. Grillmayer, F. Achard, F. Kraxner and M. Obersteiner, “Geo-Wiki. Org: The Use of Crowd sourcing to Improve Global Land Cover,” Remote Sensing, Vol. 1, No. 3, 2009, pp. 345- 354.
- C. G. Homer, R. D. Ramsey, T. C. Edwards Jr. and A. Falconer, “Landscape Cover-Type Modeling Using a MultiScene Thematic Mapper Mosaic,” Photogrammetric Engineering & Remote Sensing, Vol. 63, No. 1, 1997, pp. 59-67.
- R. Al-Adamat, S. AlAyyash, H. Al-Amoush, O. Al-Meshan, Z. Rawajfih, A. Shdeifat, A. Al-Harahsheh and M. Al-Farajat, “The Combination of Indigenous Knowledge and Geo-Informatics for Water Harvesting Sitting in the Jordanian Badia,” Journal of Geographic Information System, 2012.
- S. AlAyyash, R. Al-Adamat and O. Al-Meshan, “The Application of Geo-Informatics to Map the Appropriate Sites for the Cultivation of Forage in the Jordanian Badia,” Surveying and Land Information Science (SaLIS), 2012.
- A. Pekkarinen, L. Reithmaier and P. Strobl, “Pan-European Forest/Non-Forest Mapping with Landsat ETM+ and CORINE Land Cover 2000 Data,” ISPRS Journal of Photogrammetry and Remote Sensing, Vol. 64, No. 2, 2009, pp. 171-183.
- R. Al-Adamat, S. Baban and I. Foster, “An Examination of Land Use Change Due to Irrigated Agriculture in North-Eastern Jordan Using Geoinformatics,” International Journal of Environmental Studies, Vol. 61, No. 3, 2004, pp. 337-350. doi:10.1080/0020723042000199768
- M. Alkan, U. G. Sefercik, A. M. Marangoz and S. Karakiş, “Updating Objects for Topographic Map Information Using High Resolution Satellite Images of Zonguldak Testfield,” 30th EARSeL Symposium Remote Sensing for Science, Education, and Natural and Cultural Heritage, Paris, 31 May-3 June 2010, pp. 683-690.
NOTES
*Corresponding author.