Smart Grid and Renewable Energy
Vol.08 No.05(2017), Article ID:76591,16 pages
10.4236/sgre.2017.85009
Energy Assessment of Building Integrated Photovoltaics and Fuel Cell Systems: Design Study for Building(s) of Mie, Japan
Akira Nishimura1, Satoshi Kitagawa1, Masafumi Hirota1, Mohan Lal Kolhe2
1Division of Mechanical Engineering, Graduate School of Engineering, Mie University, Tsu, Japan
2Faculty of Engineering and Science, University of Agder, Kristiansand, Norway

Copyright © 2017 by authors and Scientific Research Publishing Inc.
This work is licensed under the Creative Commons Attribution International License (CC BY 4.0).
http://creativecommons.org/licenses/by/4.0/


Received: April 7, 2017; Accepted: May 24, 2017; Published: May 27, 2017
ABSTRACT
A building integrated energy system (photovoltaic (PV) and fuel cell (FC)) is proposed for assessment of the energy self-sufficiency rate in five cities of Mie prefecture in Japan. In this work, it is considered that the electricity requirement of the building is provided by the building integrated photovoltaic (BIPV) system and the gap between the energy demand and BIPV supply is fulfilled by the FC. The FC is powered by the electrolytic H2 produced from the surplus power of PV. A design study of using the proposed system in five cities in Mie prefecture, which are in center part of Japan, has been performed. It has been observed that the monthly power production from BIPV is higher in spring and summer, while it is lower in autumn and winter at all considered locations. The self-sufficiency rate of the FC system is higher with decreasing households’ number and it has been observed that the 12 households are more suitable for full cover of the electricity demand by the combined system of PV and FC. The relationship between the households’ number and self-sufficiency rate of the FC system per solar PV installation area can be expressed by exponential curve. The coefficient of the exponential curve can predict the suitable city for the BIPV system with FC system utilizing electrolytic H2 generated by using excess energy from the PV system.
Keywords:
Smart Building, Photovoltaics, H2 Produced by Water Electrolysis, Fuel Cell, Self-Sufficiency Rate

1. Introduction
Fossil fuel reserves are limited and intensive burning of hydro-carbon based fuel sources is impacting on global climate. Renewable energy sources such as wind, solar photovoltaic (PV), solar thermal, geothermal, bio-energy are drawing attention as alternative environment-friendly energy sources [1] . However, the energy density of these renewable energy sources is low. Therefore, it is very important to develop proper strategies and technologies to integrate these renewable energy sources into the power system network in order to fulfill the energy demand [1] . In most of the developed countries, existing buildings are consuming around 40% of the total fossil fuel energy and they are contributing significantly in the greenhouse. The European Union’s Energy Performance of Buildings Directive requires all new buildings to be nearly zero-energy by the end of 2020. The amount of energy that these buildings require comes mostly from the building integrated renewable energy sources (e.g. building integrated photovoltaic BIPV system).
Integrating renewable energy sources into the existing energy system network is an effective approach in the development of net zero-energy buildings’ built environment, it is challenging to integrate intelligently renewable energy sources and distributed generators as the existing building infrastructures are not designed to accept them into the power system infrastructure [1] . The development of a smart city or a smart building requires harmonizing the renewable energy system with existing heat and power system infrastructures, and with new monitoring and control system [2] .
Integrating/installing solar panels on the roof and/or side wall of the building is a typical way to make the building energy self-sufficient. Such kind of building integrated PV systems (BIPV) has been studied by many researchers [3] - [16] . According to some review papers [4] [5] , BIPV installation is increasing every year and PV systems are integrated into different parts of the building such as roof, external building wall, façade, and windows, although the majority of installations is on roof-top [6] . Most of the researches on BIPV focused on economic and environmental assessment evaluating by investment recovery with consideration of power generation performance [7] , life cycle cost (LCC) and energy payback time (EPBT) [4] [11] . In addition, some studies investigated the effect of thermal management of PV module on the power generation performance of BIPV [12] [13] .
Due to solar energy’s intermittent nature, the BIPV system normally requires a sort of energy storage system and/or grid-connected mechanism [6] [17] . The typical energy storage system in integrated PV systems is battery bank and electrolytic H2 can also be used for long term energy storage and these integrated systems have been studied numerically as well as experimentally [3] [16] [18] - [28] . The research on BIPV and energy storage system is a few [6] [17] [29] [30] [31] , although the ice storage system combined with BIPV has been discussed in [16] . Though financial assessment on BIPV with energy storage system [29] [30] and a dynamic control procedure in a short time [31] have been discussed, the energy assessment that considers the BIPV with energy storage system in actual city for a long operational period has not been reported yet. In [6] , the operational results of a zero-energy building (ZEB) house from the Southern Norway have been reported only for the BIPV without any energy storage. Therefore, the optimization of BIPV with energy storage system and especially with long term energy storage in the form of electrolytic H2 has not been investigated well.
In this paper, a design study has been performed on a proposed BIPV system with utilization of stored energy in the form of electrolytic H2 through FC during the power production from the PV system. The proposed BIPV system consists of the solar PV array, water electrolyzer and fuel cell (FC). The H2 required by the FC is provided from the stored electrolytic H2 produced using the surplus power of the PV. The FC would therefore be able to buffer the intermittency (partly) between the building electricity demand (by the building) and the PV system. The BIPV power productions at the five cities in Mie prefecture, Japan have been evaluated using the meteorological data of the project “PV300” (period from August, 2013 to July, 2014 [32] ). The BIPV power productions have been compared with the electricity demand data of households [33] and investigated for the optimum power supply in a way to overcome the intermittency of the electricity demand and PV system. The self-sufficiency rate of the proposed BIPV system to electricity demand has been estimated in the design study. In addition, the optimum number of households living in the building, i.e. the optimum size of the building, has been investigated.
2. Design Study
2.1. Estimation of Power Generation from the PV System
The building model, used in the design study, is 10 m width, 40 m length and 40 m height (=10 stories) [34] with 40 households [35] . The BIPV system has considered on the roof/top of the building and a FC using electrolytic H2 produced when the surplus power from PV has been available [1] .
The power generated by PV system is calculated by using the following equation [36] :
 (1)
(1)
where EPV is hourly electric power of PV system (kWh), H is hourly amount of solar radiation (kWh/m2), K is power generation loss factor (−), P is system capacity of PV (kW), 1 is solar radiation under standard state (AM1.5, hourly solar radiation: 1 kWh/m2, module temperature: 25 degree Celsius) (kW/m2). The instantaneous solar radiation data by 10 sec of the reference [32] are integrated as hourly data for calculating the hourly electric power of PV system.
In this study, the high-performance PV P250a Plus produced by Panasonic has been considered. This module has conversion efficiency and maximum power rating per module is 19.5% and 250 W [37] . The size of PV module is 1580 mm × 812 mm × 35 mm. P has been calculated by installing this PV module on the roof of the building model, which is 75 kWp (=300 solar modules). To calculate K, the performance value of state-of-the-art commercial devise is used. K is calculated by using the following equation:
 (2)
(2)
where Kp is power conversion efficiency of power conditioner (−), Km is correction factor decided by module temperature (−), Ki is power generation loss by interconnecting and dirty of module surface (−). In this study, Kp and Ki are set at 0.945 and 0.95, respectively. Kp is assumed by referring to the performance of commercial power conditioning device VBPC259B3 manufactured by Panasonic [38] . Km is calculated by the following equation:
 (3)
(3)
where Tm is PV module temperature (degree Celsius), Ts is temperature under standard test condition (=25 degree Celsius) (degree Celsius), C is temperature correction factor which is 0.35 [39] (%/degree Celsius). The temperature characteristics of PV module which is adopted for this study are referred. Tm is calculated by using the following equation [40] :
 (4)
(4)
where Ta is ambient air temperature (degree Celsius), Um is wind velocity over module of PV (m/s). In this equation, the convection heat transfer by wind around the PV module is considered.
The meteorological data, such as solar radiation, the ambient air temperature, and wind velocity of some cities in Japan have been taken from the data base of the project “PV300” during the period from August, 2013 to July, 2014 [32] . Table 1 has listed a sample of PV300 data, which shows the data of air temperature and amount of horizontal solar radiation at 10 sec intervals on 1st August, 2013 for Tsu in Japan. According to the previous study [1] , the optimum tilt angle of solar panel installed on a roof/top of the building is 0 degree, resulting that the horizontal solar radiation has been used for calculating the power generated by the PV system in this study.
2.2. Estimation of Power Generated by FC System Using H2 Produced by Water Electolysis
In this design study, it has been assumed that the surplus power generated by the PV system over the electricity demand of households [33] living in the considered building model, will be used for electrolytic H2 production (i.e. long term energy storage in the form of electrolytic H2). To optimize the size of BIPV system, number of households has been varied by 40, 20, 16 and 12 which correspond to 10, 5, 4 and 3 stories of the building, respectively. In this study, the building which has 4 households per floor is assumed. Then, the multiple number of 4 is based for assessment. To keep a building structure, the lowest limit of stories is set 3 which is the low height class building, indicating 12 households. The Type-S electrolyzer manufactured by IHT [41] [42] whose H2 production rate, power consumption and electrolysis efficiency are 760 Nm3/h, 4.45 kHW/ Nm3 and 79.5%, have been used in this design study. The amount of electrolytic

Table 1. Sample data of PV300 on 1st August, 2013 for Tsu in Japan.
H2 could be produced by the surplus power generated from the PV system is calculated by the following equation [1] :
 (5)
(5)
where  is amount of electrolytic H2 produced (Nm3), Es is surplus power generated by PV system (kWh), Pe is power consumption (kWh/Nm3),
  is electrolysis efficiency (−). In this study, it is assumed that the electrolyzer can be operated following the power generation characteristics of PV system every time and the produced H2 can be stored as well as used instantaneously.
It has been assumed that the H2 produced by the electolyzer would be used to generate power through a polymer electrolyte fuel cell (PEFC) system [3] . H2 is converted into electricity by FC following the below equation:
 (6)
(6)
where  is power generation efficiency of latest PEFC stationary system based on lower heating value (=0.39) [43] , Q is lower heating value of H2 (=242) (kJ/mol). It is assumed that the energy loss for operating pump to preserve and provide gases is ignored.
In this study, a monthly self-sufficiency rate of the proposed combination system consisting of the PV and FC has been investigated for Tsu (Latitude: 34.43˚N, Longitude: 136.30˚E), Yokkaichi (Latitude: 34.57˚N, Longitude: 136.37˚E), Kuwana (Latitude: 35.03˚N, Longitude: 136.41˚E), Ise (Latitude: 34.29˚N, Longitude: 136.42˚E) and Owase (Latitude: 34.04˚N, Longitude: 136.11˚E). They are the main cities in Mie prefecture, Japan. The self-sufficiency rate is defined as the power supplied (from the combined PV and FC system) to the electricity demand of the households living in the building. The hourly time change in the self-sufficiency rate in the day, when the daily mean amount of horizontal solar radiation per month has been obtained and estimated.
3. Results and Discussion
3.1. Evaluation of Power Supply from the BIPV and the Building Electricity Demand for 40 Households Case
As described in earlier sections, this study has investigated the power production from the PV system using the meteorological data base of PV300 [32] including air temperature, solar intensity and wind speed at 10 sec intervals. Since the electricity demand of households [33] is available as hourly data, the power production from the PV system is summarized as hourly data by integrating the instantaneous data available at 10 sec intervals.
As an example, Table 2 has listed the hourly power from PV system (installed in Tsu for a year) which is shown to investigate the seasonal characteristics. In this table, the hourly time change in power of PV system in the day when the daily mean amount of horizontal solar radiation per month has been obtained and estimated. From this table, the hourly power of PV system increases from the morning up to the noon and decreases from the noon up to the evening as expected. In addition, it is obvious that the hourly power of PV system is higher in spring and summer, while it is lower in autumn and winter. The data shown in Table 2 has been summed for daily data and it has been multiplied by the total days for each month for using as monthly data. The monthly power production from the PV system is shown in Table 3 which is shown to investigate the seasonal and local characteristics. It has been observed that the monthly power of the PV system is higher in spring and summer, while it is lower in autumn and winter irrespective of the cities.
Table 4 has listed the hourly electricity demand of 40 households for a year which is shown to investigate the seasonal characteristics. In this study, the electricity demand profile, which depends on the city are not considered. It means that the same electricity demand profile has been used for the five cities as design study. When considering the electricity demand profile of other number of households, the data shown in Table 4 have been recalculated. It has been observed that the hourly electricity demand increases from the morning and keeps almost a constant value during a day. After that, the hourly electricity demand increases rapidly from the evening and keeps almost a constant value up to the midnight. In addition, it is obvious that the electricity demand is higher in
Table 2. Hourly power of PV system assumed to be installed in Tsu for a year (Unit: kWh).
Table 3. Monthly power of PV system assumed to be installed in five cities (Unit: MWh).
Table 4. Hourly electricity demand data of 40 households (Unit: kWh).
summer and winter, while it is lower in spring and autumn. The data shown in Table 4 have been summed as daily data and it was multiplied by the total days for each month as monthly data.
Table 5 has listed the hourly power production for a year from the FC system, assumed to be installed in Tsu, which has been calculated by using the surplus power of PV system and the Equations (5) and (6). According to Table 2 and Table 4, the surplus hourly power of the PV system is high during the daytime, especially at the noon, while it is low from the evening to the early morning. When the hourly self-sufficiency rate of PV system is over 100 %, it means that the FC system has the capacity to generate the power due to the surplus power of PV system or the surplus energy can be stored in the form of electrolytic H2. In this study, it has been assumed that the surplus power of PV system can be utilized by the water electrolysis immediately and be stored as electrolytic H2. It has been also assumed that the stored electrolytic H2 can be utilized in the FC system for fulfilling the shortage of energy during the required time. In Table 5, hourly power productions from the FC system are used for finding daily power production from the FC system and it has been multiplied by the total monthly days for finding monthly power production from the FC system. The monthly power production profile of the FC system has been given in Table 6.
Table 6 has listed the monthly power production from the FC system which is shown to investigate the seasonal and locational characteristics. Figure 1 has shown the monthly self-sufficiency rate of the FC system which is also shown to investigate the seasonal and locational characteristics. The self-sufficiency rate is
Table 5. Hourly power of FC system assumed to be installed in Tsu for a year (Unit: kWh).
Table 6. Monthly power of FC system assumed to be installed in five cities (40 households case; Unit: MWh).
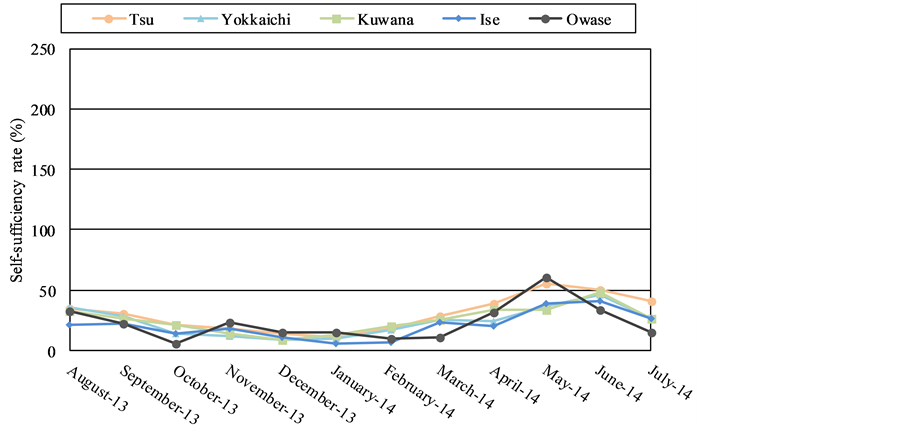
Figure 1. Monthly self-sufficiency rate of the FC system assumed to be installed in Tsu, Yokkaichi, Kuwana, Ise and Owase (40 households case).
calculated by dividing the power produced by the FC system by the electricity demand, which is not covered by the PV system. If the self-sufficiency rate of the FC system is over 100%, then the proposed BIPV system with the FC system utilizing electrolytic H2 generated by water electrolysis can cover the electricity demand of households living in the building.
According to Table 6, the monthly power of the FC system is higher in spring and summer, while it is lower in autumn and winter irrespective of cities. Also, it follows the power generation profile of the PV system.
It has been seen from Figure 1 that the monthly self-sufficiency rate of the FC system is below 100% irrespective of the cities. The annual self-sufficiency rate of the FC system assumed to be installed in the Tsu, Yokkaichi, Kuwana, Ise and Owase are 29%, 23%, 25%, 19% and 22%, respectively. Therefore, the proposed BIPV system with FC system utilizing the electrolytic H2 generated by water electrolysis can’t cover the electricity demand of 40 households living in the building. This study has investigated the optimum households number per same installment area of PV array in the next section.
3.2. Evaluation of Households Number for Proposed BIPV System with FC System Utilizing H2 Generated by Water Electrolysis
The households number is changed to investigate the proper households number per same installment area of solar array on the roof/top of building. Figures 2-4 have shown the monthly self-sufficiency rate of FC system assumed to be installed in Tsu, Yokkaichi, Kuwana, Ise and Owase for 20, 16 and 12 households cases, where the stories of buildings are 5, 4 and 3, respectively. These figures are shown to investigate the seasonal and locational characteristics under different households conditions.
It has been observed through Figures 2-4, the self-sufficiency rate of FC system is higher with decreasing households number, resulting that the self-suffi- ciency rate of FC system which is over 100% can be seen in spring and summer.
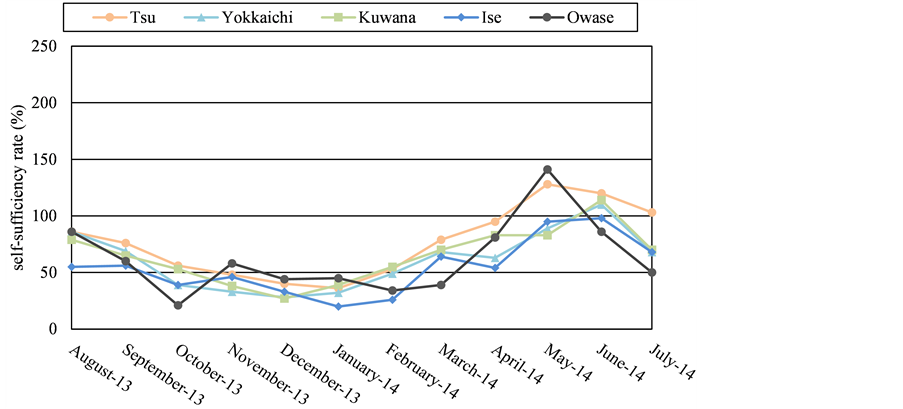
Figure 2. Monthly self-sufficiency rate of the FC system assumed to be installed in Tsu, Yokkaichi, Kuwana, Ise and Owase (20 households case).
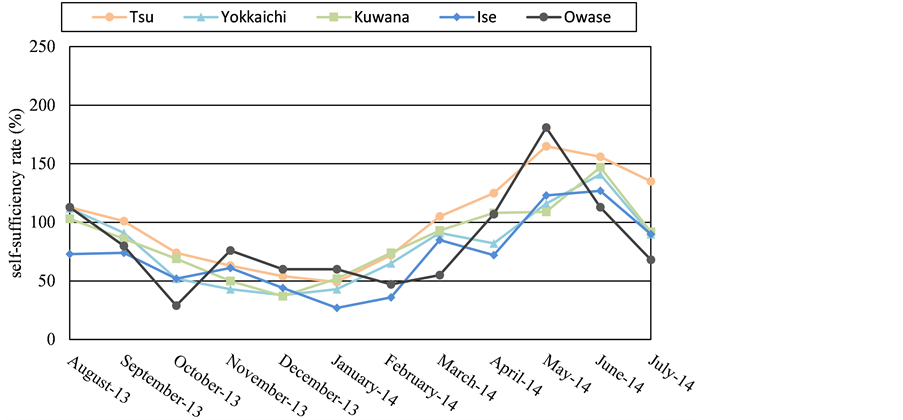
Figure 3. Monthly self-sufficiency rate of the FC system assumed to be installed in Tsu, Yokkaichi, Kuwana, Ise and Owase (16 households case).
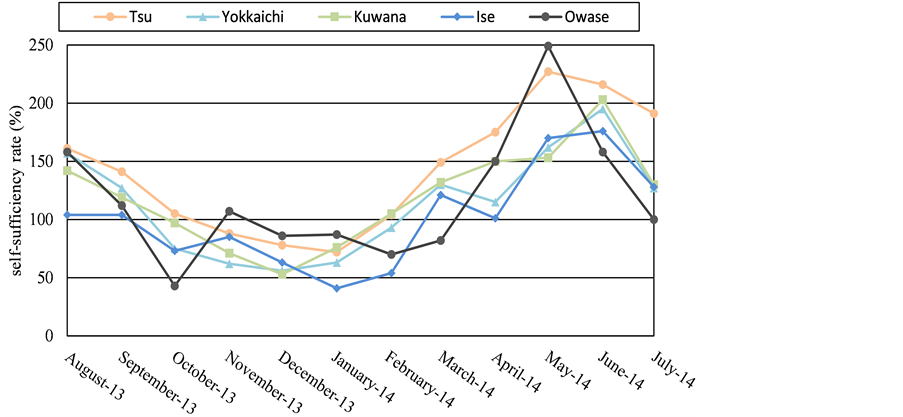
Figure 4. Monthly self-sufficiency rate of the FC system assumed to be installed in Tsu, Yokkaichi, Kuwana, Ise and Owase (12 households case).
The annual self-sufficiency rate of the FC system assumed to be installed in Tsu, Yokkaichi, Kuwana, Ise and Owase for 20 households design case are 74%, 60%, 63%, 52% and 61%, respectively. The annual self-sufficiency rate of the FC system assumed to be installed in Tsu, Yokkaichi, Kuwana, Ise and Owase for 16 households design case are 98%, 79%, 83%, 69% and 81%, respectively. The annual self-sufficiency rate of the FC system assumed to be installed in Tsu, Yokkaichi, Kuwana, Ise and Owase for 12 households design case are 138%, 111%, 117%, 98% and 115%, respectively. From these results, 12 households are more suitable for full cover of the electricity demand by the combined system of PV and FC. Though it is expected that the smaller number of households below 12 indicates the larger self-sufficiency, it is necessary to consider the large electrolytic H2 storage system for the excess power generated by the PV system instead. In addition, it is assumed that one story consists of 4 households. Consequently, this design study decides that 12 households is the optimum for the proposed BIPV system with FC system.
The relationship between the households number and self-sufficiency rate of FC system per solar PV installation area has been shown in Figure 5. It is observed that the relationship between the households number and self-sufficiency rate of FC system per solar PV installation area can be expressed by the exponential curve well. If the coefficient of the exponential curve is high, e.g. 0.6127 in Tsu case, it means that the self-sufficiency rate of FC system per solar PV installation area is high. Therefore, we can recognize that Tsu is more suitable for the installment of proposed BIPV system. Tsu is located at the center in Mie prefecture and obtain the large amount of solar radiation. In addition, the wind condition is also good to prevent the elevation of PV panel temperature since the mountain ranges are located at the northwest of Tsu. Consequently, the self-sufficiency rate for Tsu is the largest. On the other hand, since Ise is located in the southeast area in Mie prefecture and it is easy to rain, the amount of solar

Figure 5. Relationship between the households number and self-sufficiency rate of FC system per solar PV installation area.
radiation is smaller than the other cities. Therefore, the self-sufficiency rate for Ise is the smallest. Owase is also located in the south area in Mie prefecture and it is easy to rain, resulting that the self-sufficiency rate becomes smaller. In the future work, the energy network system consisting of several BIPV system assumed to be installed in several cities will be investigated in order to cover the electricity demand of each other through H2 transportation/infrastructure.
4. Conclusions
This study has proposed a combined PV and FC utilizing electrolytic H2 produced with surplus power of PV for Japanese buildings. The self-sufficiency rates of the combination system of PV and FC have been investigated using meteorological data of five cities in Mie prefecture of Japan. As a result, the following conclusions have been drawn:
1) The power production of PV system increases from the morning up to the noon and decreases from the noon up to the evening. The monthly power of PV system is higher in spring and summer, while it is lower in autumn and winter irrespective of cities.
2) The monthly power of FC system is higher in spring and summer, while it is lower in autumn and winter irrespective of cities. It follows the power generation characteristics of PV system.
3) The self-sufficiency rate of FC system is higher with decreasing households number, resulting that 12 households are suitable for full cover of electricity demand by the combined system of PV and FC.
4) The relationship between the households number and self-sufficiency rate per solar PV installation area can be expressed by the exponential curve well. We can find the city, which is more suitable for the proposed BIPV system using the appropriate coefficient of the exponential curve.
Cite this paper
Nishimura, A., Kitagawa, S., Hirota, M. and Kolhe, M.L. (2017) Energy Assessment of Building Integrated Photovoltaics and Fuel Cell Systems: Design Study for Building(s) of Mie, Japan. Smart Grid and Renewable Energy, 8, 129- 144. https://doi.org/10.4236/sgre.2017.85009
References
- 1. Nishimura, A., Kitagawa, S., Hirota, M. and Hu, E. (2017) Assessment on Energy Self-Sufficiency Rate for Building Integrated Photovoltaics and Fuel Cell System in Japan. Smart Grid and Renewable Energy, In Press.
- 2. Kolhe, M. (2012) Charting a New Energy Future: Research, Development and De- monstration. The Electricity Journal, 25, 88-93.
https://doi.org/10.1016/j.tej.2012.01.018 - 3. Agbossou, K., Kolhe, M., Hamelin, J., Bernier, E. and Bose, T. (2004) Electrolytic Hydrogen Based Renewable Energy System with Oxygen Recovery and Re-Utiliza- tion. Renewable Energy, 29, 1305-1318.
https://doi.org/10.1016/j.renene.2003.12.006 - 4. Tripathy, M., Sadhu, P.K. and Panda, S.K. (2016) A Critical Review on Building Integrated Photovoltaic Products and Their Applications. Renewable and Sustainable Energy Reviews, 61, 451-465.
https://doi.org/10.1016/j.rser.2016.04.008 - 5. Jelle, B.P. (2016) Building Integrated Photovoltaics: A Concise Description of the Current State of the Art and Possible Research Pathways. Energies, 9.
- 6. Azmi, A.N. (2017) Grid Interaction Performance Evaluation of BIPV and Analysis with Energy Storage on Distributed Network Power Management. Ph.D. Thesis, University of Agder, Norway.
- 7. Ruhang, X. (2016) The Restriction Research for Urban Area Building Integrated Grid-Connected PV Power Generation Potential. Energy, 113, 124-143.
https://doi.org/10.1016/j.energy.2016.07.035 - 8. Orioli, A. and Gangi, A.D. (2016) Five-Years-Long Effects of the Italian Policies for Photovoltaics on the Energy Demand Coverage of Grid-Connected PV Systems Installed in Urban Contexts. Energy, 113, 444-460.
https://doi.org/10.1016/j.energy.2016.07.059 - 9. Tse, K.K., Chow, T.T. and Su, Y. (2016) Performance Evaluation and Economic Analysis of a Full Scale Water-based Photovoltaic/thermal (PV/T) System in an Office Building. Energy and Buildings, 122, 42-52.
https://doi.org/10.1016/j.enbuild.2016.04.014 - 10. Humada, A.M., Hojabri, M., Hamada, H.M. and Samsuri, F.B. (2016) Performance Evaluation of Two PV Technologies (c-Si and CIS) for Building Integrated Photovoltaic Based on Tropical Climate Condition: A Case Study in Malaysia. Energy and Buildings, 119, 233-241.
https://doi.org/10.1016/j.enbuild.2016.03.052 - 11. Davi, G.A., Martin, E.C., Ruther, R. and Solano, J. (2016) Energy Performance Eva- luation of a Net Plus-Energy Residential Building with Grid-Connected Photovoltaic System in Brazil. Energy and Buildings, 120, 19-29.
https://doi.org/10.1016/j.enbuild.2016.03.058 - 12. Rajoria, C.S., Agrawal, S., Chandra, S., Tiwari, G.N. and Chauhan, D.S. (2016) A Novel Investigation of Building Integrated Photovoltaic Thermal (BiPVT) System: A Comparative Study. Solar Energy, 131, 107-118.
https://doi.org/10.1016/j.solener.2016.02.037 - 13. Elsayed, M.S. (2016) Optimizing Thermal Performance of Building-Integrated Pho- tovoltaics for Upgrading Informal Urbanization. Energy and Buildings, 116, 232- 248.
https://doi.org/10.1016/j.enbuild.2016.01.004 - 14. Sun, L.L., Li, M., Yuan, Y.P., Cao, X.L., Lei, B. and Yu, N.Y. (2016) Effect Tilt Angle and Connection Mode of PVT Modules on the Energy Efficiency of a Hot Water System for High-Rise Residential Buildings. Renewable Energy, 93, 291-301.
https://doi.org/10.1016/j.renene.2016.02.075 - 15. Zomer, C., Nobre, A., Reindl, T. and Ruther, R. (2016) Shading Analysis for Rooftop BIPV Embedded in a High-Density Environment: A Case Study in Singapore. Energy and Buildings, 121, 159-164.
https://doi.org/10.1016/j.enbuild.2016.04.010 - 16. Sehar, F., Pipattanasomporn, M. and Rahman, S. (2016) An Energy Management Model to Study Energy and Peak Power Savings from PV and Storage in Demand Responsive Buildings. Applied Energy, 173, 406-417.
https://doi.org/10.1016/j.apenergy.2016.04.039 - 17. Azmi, A.N., Kolhe, M. and Imenes, A.G. (2015) Review on Photovoltaic Based Active Generator: Proceedings of 9th International Symposium on Advanced Topics in Electrical Engineering (ATEE), Bucharest, 812-815.
- 18. Baumann, L. and Boggasch, E. (2016) Experimental Assessment of Hydrogen Systems and Vanadium-Redox-Flow-Batteries for Increasing the Self-Consumption of Photovoltaic Energy in Buildings. International Journal of Hydrogen Energy, 41, 740-751.
https://doi.org/10.1016/j.ijhydene.2015.11.109 - 19. Abdin, Z., Webb, C.J. and Gray, E.M. (2015) Solar Hydrogen Hybrid Energy Systems for Off-Grid Electricity Supply: A Critical Review. Renewable and Sustainable Energy Reviews, 52, 1791-1808.
https://doi.org/10.1016/j.rser.2015.08.011 - 20. Ozgirgin, E., Devrim, Y. and Albostan, A. (2015) Modeling and Simulation of Hybrid Photovoltaic (PV) Module-Electrolyzer-PEM Fuel Cell System for Micro-Co- generation Applications. International Journal of Hydrogen Energy, 40, 15336- 15342.
https://doi.org/10.1016/j.ijhydene.2015.06.122 - 21. Bensmail, S., Rekioua, D. and Azzi, H. (2015) Study of Hybrid Photovoltaic/Fuel Cell System for Stand-Alone Applications. International Journal of Hydrogen Ener- gy, 40, 13820-13826.
https://doi.org/10.1016/j.ijhydene.2015.04.013 - 22. Gonzalez, E.L., Llerena, F.I., Perez, M.S., Iglesias, F.R. and Macho, J.G. (2015) Ener- gy Evaluation of a Solar Hydrogen Storage Facility: Comparison with Other Electrical Energy Storage Technologies. International Journal of Hydrogen Energy, 40, 5518-5525.
https://doi.org/10.1016/j.ijhydene.2015.01.181 - 23. Alnaser, N.W. (2015) Building Integrated Renewable Energy to Achieve Zero Emission in Bahrain. Energy and Buildings, 93, 32-39.
https://doi.org/10.1016/j.enbuild.2015.01.022 - 24. Bigdeli, N. (2015) Optimal Management of Hybrid PV/Fuel Cell/ Battery Power System: A Comparison of Optimal Hybrid Approaches. Renewable and Sustainable Energy Reviews, 42, 377-393.
https://doi.org/10.1016/j.rser.2014.10.032 - 25. Torreglosa, J.P., Garcia, P., Fernandez, L.M. and Jurado, F. (2015) Energy Dispatching Based on Predictive Controller of an Off-Grid Wind Turbine/photovol- taic/Hydrogen/Battery Hybrid System. Renewable Energy, 74, 326-336.
https://doi.org/10.1016/j.renene.2014.08.010 - 26. Cano, A., Jurado, F., Sanchez, H. and Fernandez, L.M. (2014) Optimal Sizing of Stand-Alone Hybrid Based on PV/WT/FC by Using Several Methodologies. Journal of Energy Institute, 87, 330-340.
https://doi.org/10.1016/j.joei.2014.03.028 - 27. Ghahnavieh, A.R. and Nowdeh, S.A. (2014) Optimal PV-FC Hybrid System Operation Considering Reliability. Electrical Power and Energy Systems, 60, 325-333.
https://doi.org/10.1016/j.ijepes.2014.03.043 - 28. Rekioua, D., Bensmail, S. and Bettar, N. (2014) Development of Hybrid Photovoltaic-Fuel Cell System for Stand-Alone Application. International Journal of Hydrogen Energy, 39, 1604-1611.
https://doi.org/10.1016/j.ijhydene.2013.03.040 - 29. Zhang, X., Li, M., Ge, Y. and Li, G. (2016) Techno-Economic Feasibility Analysis of Solar Photovoltaic Power Generation for Buildings. Applied Thermal Engineering, 108, 1362-1371.
https://doi.org/10.1016/j.applthermaleng.2016.07.199 - 30. Khalid, F., Dincer, I. and Rosen, M.A. (2016) Analysis and Assessment of an Integrated Hydrogen Energy System. International Journal of Hydrogen Energy, 41, 7960-7967.
https://doi.org/10.1016/j.ijhydene.2015.12.221 - 31. Baumann, L. and Boggasch, E. (2016) Experimental Assessment of Hydrogen Systems and Vanadium-Redox-Flow-Batteries for Increasing the Self-Consumption of Photovoltaic Energy in Buildings. International Journal of Hydrogen Energy, 41, 740-751.
https://doi.org/10.1016/j.ijhydene.2015.11.109 - 32. Chubu Electric Power (2014) The Irradiance Data of the Project “PV300” (Electric Data Base).
- 33. The Society of Heating, Air-conditioning and Sanitary of Engineering of Japan (1998) Assessment, Plan and Design of Co-generation System by City Gas. Maruzen, Tokyo.
- 34. Nishimura, A., Ito, T., Kakita, M., Murata, J., Ando, T., Kamada, Y., Hirota, M. and Kolhe, M. (2014) Impact of Building Layout on Wind Turbine Power Output in the Built Environment: A Case Study of Tsu City. Journal of the Japan Institute of Ener- gy, 84, 315-322.
https://doi.org/10.3775/jie.93.315 - 35. Ministry of Internal Affairs and Communications (2017) Dwelling by Area of Floor Space (6 Groups) an Tenure of Dwelling (2 Groups)—Japan, 3 Major Metropolitan Areas, Prefectures and Major Cities (1998-2008).
http://www.e-stat.go.jp/SGI/estat/ListE.do?bid=000001029530&code=0 - 36. New Energy and Industrial Technology Development Organization of Japan (2017) Guideline on Field Test Project of Photovoltaic Power Generation for Design, Construction and System.
http://www.nedo.go.jp/content/100110086.pdf - 37. Panasonic (2017) Products Lineup.
http://sumai/panasonic.jp/solar/lineup.html - 38. Panasonic (2017) Power Conditioner with High Conversion Efficiency.
https://sumai.panasonic.jp/solar/need_power_conditioners.html - 39. Kawamoto, K., Nakatani, S., Hagihara, R. and Nakai, T. (2002) High Efficiency HIT Solar Cell. Sanyo Technical Review, 34, 111-117.
- 40. Oozeki, T., Izawa, T., Otani, K., Tsuzuki, K., Koike, H. and Kurokawa, K. (2005) An Evaluation Method for PV Systems by Using Limited Data Item. IEEJ Transaction on Power Energy, 125, 1299-1307.
https://doi.org/10.1541/ieejpes.125.1299 - 41. IHT (2017) Technical Information/Benefits of IHT’s Electrolysers.
http://www.iht.ch/technologie/electrolysis/industry/technical-information-benefits-electrolysers.html - 42. Kato, T. (2015) Possibility of Hydrogen Production from Renewable Energy. Journal of Japan Institute of Technology, 94, 7-18.
- 43. Panasonic (2017) Specification of ENEFARM.
https://panasonic.co.jp/ap/FC/about_01.html