International Journal of Nonferrous Metallurgy
Vol.2 No.3(2013), Article ID:33896,5 pages DOI:10.4236/ijnm.2013.23013
Thermodynamic Assessment of the Pt-Sb System
1School of Material Science and Engineering, Jiangxi University of Science and Technology, Ganzhou, China
2Department of Materials Science and Engineering, University of Science and Technology Beijing, Beijing, China
Email: *liujm2011@sina.com
Copyright © 2013 Jinming Liu et al. This is an open access article distributed under the Creative Commons Attribution License, which permits unrestricted use, distribution, and reproduction in any medium, provided the original work is properly cited.
Received December 4, 2012; revised January 4, 2013; accepted January 15, 2013
Keywords: Pt-Sb Phase Diagram; Thermodynamic Assessment; Thermodynamic Properties; CALPHAD Technique
ABSTRACT
The Pt-Sb system was critically assessed by means of CALPHAD technique. Based on the experimental data in the literature, the excess Gibbs energies of the solution phases (liquid, rhombohedral, fcc) were modeled with the Redlich-Kister equation. The five intermetallic compounds, Pt7Sb, Pt3Sb, Pt3Sb2, PtSb, and PtSb2 were treated as stochiometric compounds and expressed as the formula (Pt)m(Sb)n. The intermetallic compound, Pt5Sb with a homogenerity ranges 0.155 - 0.189 Sb, were treated as the formula (Pt,Sb)m(Pt,Sb)n. A set of self-consistent thermodynamic parameters of the Pt-Sb system was obtained.
1. Introduction
The precious metals, Pt, Sb, Au, Ag and their alloys, have been widely applied as catalysts for their high thermal stability and high activity, such as decompounding hydrazine, purifying automobile gas, oxygenating selectively and so on [1-5]. Understanding the phase equilibria as well as the thermochemical behaviour of these systems is helpful for the development of the related materials. This paper intends to assess the Pt-Sb system thermodynamically and provides a set of selfconsistent parameters for calculation of the phase equilibria and thermochemical properties of the system.
2. Literature Review
The Pt-Sb phase diagram consists of the liquid, the facecentered cubic (fcc), terminal solid solution (Pt); the terminal solid solution, rhombohedral (Sb) with a negligible solubility of Pt. The gas phase was estimated by Itkin and Alcock [6], which is not considerated in the present work.
The liquidus was determined by thermal analysis in Refs. [7-10]. The liquidus in the Pt-Sb system was based mainly on the results made by Durussel and Feschotte [11] using differential thermal analysis (DTA), which was supported by the majority of the data [7-10].
In the Pt-Sb system, there are six intermediate phases, Pt7Sb, Pt5Sb, Pt3Sb, Pt3Sb2, PtSb, and PtSb2. The Pt7Sb compound was discovered by [11], using DTA, microprobe analysis, and X-ray powder (XRD). Pt7Sb, a cubic structure, is formed by a peritectoid reaction. Different designations for the phase Pt5Sb are “Pt4Sb” [8], “Pt34Sb7” [10], “Pt4+Sb” [12], and “Pt82Sb18” [13]. A compound, “Pt5Sb2” was reported in Ref. [7] and not confirmed in other publications [8,10,12,13]. The compound as Pt5Sb has a cubic structure wth a homogeneity range of 0.155 to 0.189 Sb [11]. The boundaries of the phase were determined using a temperature dependence of the lattice parameter. This phase is formed at 748˚C ± 4˚C by peritectic reaction, which was consistent with Refs. [7-9]. It decomposed at 560˚C by eutectoid reaction.
The compound Pt3Sb was formed by peritectic reaction [9,11]. The compound was investigated using thermal arrest by [8] and explained by the phase transformation in “Pt4Sb”. The compound Pt3Sb was examined and observed as a single phase with a composition of 0.275 Sb and as a second phase at 0.25 and 0.30 Sb by Srivastava et al. [14]. However, Pt3Sb was confirmed as a stoichiometric compound in subsequent research [10].
The compound Pt3Sb2 was determined by Bhan et al. [9] and confirmed by Kim [10]. It is formed by a peritectic reaction at 732˚C [9] or 739˚C ± 4˚C [11]. The compound PtSb was determined by several researchers and the formed temperature was different, 1045˚C [7], 1040˚C [8], 1043˚C [9], and 1046˚C ± 3˚C [11]. The composition of PtSb was determined by Refs. [10,11,15,16]. The results of made by Durussel and Feschotte [11], Kim [10], and Kjekshus [17] showed that the composition of PtSb can be adopted as only approximately stoichiometric compound.
The compound PtSb2 was first found by chemical analysis of crystals precipitating from Pt-Sb melts containing an excess of Sb [18]. The temperature of congruent melting of PtSb2 was measured as 1226˚C [7], 1210˚C [8], and 1225˚C [11]. The enthalpy increments of PtSb2 measured by drop calorimetry in the temperature interval 196˚C to 620˚C [19].
From the above literature [6-19], the present assessed Pt-Sb phase diagram consists of the liquid, the face-centered cubic (fcc) terminal solid solution (Pt), the terminal solid solution (Sb) with a negligible solubility of Pt and six intermediate phases, Pt7Sb, Pt5Sb, Pt3Sb, Pt3Sb2, PtSb and PtSb2.
3. Thermodynamic Models
3.1. Unary Phases
The Gibbs energy function  (298.15 K) for the element i (i = Pt, Sb) in the phase f (f = liquid, face-centered cubic(fcc) and rhombohedral) is described by an equation of the following form:
 (1)
(1)
where  (298.15 K) is the molar enthalpy of the element i at 298.15 K in its standard element reference (SER) state, fcc for Pt and rhombohedral for Sb. The Gibbs energy of the element i,
  , in its SER state, is denoted by GHSERi, i.e.,
 (2)
(2)
 (3)
(3)
In the present work, the Gibbs energy functions are taken from the SGTE (Scientific Group Thermodata Europe) pure elements database compiled by Dinsdale [20].
3.2. Solution Phases
In the Pt-Sb system, there are three solution phases: liquid, fcc and rhombohedral. The gas phase was not considerated in the Pt–Sb system, similar to the results reported by Durussel and Feschotte [11]. Their Gibbs energies are described by the following expression:
 (4)
(4)
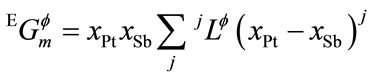
where R is the gas constant, xPt and xSb are the mole fraction of Pt and Sb, respectively, and ![]() is the excess Gibbs energy, expressed by the Redlich–Kister polynomial [21].
is the excess Gibbs energy, expressed by the Redlich–Kister polynomial [21].
 (5)
(5)
where  is the interaction parameter between element Pt and Sb, which is to be evaluated in the present work. Its general form is
 (6)
(6)
In most cases, only the first one or two terms are used according to the temperature dependence on the experimental data.
3.3. Intermetallic Compounds
There were six intermediate phases, Pt7Sb, Pt5Sb, Pt3Sb, Pt3Sb2, PtSb, and PtSb2 in the Pt-Sb system. The phases crytal structure data was shown in Table 1. According to the composition and crystal structure data , the Sb in the five compounds, Pt7Sb, Pt3Sb, Pt3Sb2, PtSb and PtSb2 of the system with no or little solid solubility will be treated as the stoichiometric compounds. While the compound Pt5Sb with more homogenertiy ranges 0.155 - 0.189 Sb will treated as solid solution compound.
So the Pt5Sb phase had a homogenertiy ranges, 0.155 - 0.189 Sb. The two-sublattice model, (Pt,Sb)0.833 (Pt,Sb)0.167 is used to describe this phase in the present work.
The parameters  and
and  are the site fractions of Pt or Sb on the first and second sublattices, respectively; the parameter
  represents the Gibbs energies of the compound Pt5Sb when the first and second subletices are occupied by only one element Pt or Sb, respectively, which are relative to the enthalpies of pure fcc for Pt and rhombohedral for Sb in their SER state;
  and
and  represent the jth interaction parameters (j = 0) between the element Pt and Sb on the first and second sublattice, respectively.
 (7)
(7)

Table 1. Pt-Sb Crystal Structure Data.
The other intermediate phases, Pt7Sb, Pt3Sb, Pt3Sb2, PtSb, and PtSb2 in the Pt-Sb system were treated as stochiometric compounds. The two-sublattice model, (Pt)m(Sb)n, is used to describe these phases in the present work. The Gibbs energy per mole of formula unit (Pt)m(Sb)n, was expressed as the following:
 (8)
(8)
where  is the Gibbs energy of formation per mole of formula unit PtmSbn. And
  can be given by the following expression:
 (9)
(9)
where the parameters a and b were to be evaluated in the present work.
4. Optimization
Most of the above experimental information was selected for the evaluation of the thermodynamic model parameters. In the present work, the phase relation and transformation temperatures based on the phase diagram of the Pt-Sb system compiled by Itkin and Alcock [6], determinded by Bhan et al. [9], and Durussel and Feschotte [11].
The optimization was carried out by means of the Thermo-Calc software [25], which can handle various kinds of experimental data. The program works by minimizing an error sum where each of the selected data values is given a certain weight. The weight is chosen by personal judgment and changed by trial and error during the work until most of the selected experimental information is reproduced within the expected uncertainty limits.
The ways to get the phase diagram summarized as several steps using the Thermo-Calc software. Firstly, it is the Unary phases to get the GES file, which is the basis of the assessment. Secondly, it is the thermodynamic models of the solution phases and the compounds to form the TCM file. The expression of the thermodynamic model was shown in Section 3.
Last is the optimization. The optimization was carried out by means of the Thermo-Calc software based on the POP file to get the PAR file. The POP file was the phases equlibria, while the PAR file was the results of the optimization. When the phase diagram is successfully optimized, all the phases in the system will get a set of consistent thermodynamic parameters to express Gibbs energies. Using the set of consistent thermodynamic parameters to reproduce the phase diagram and build the database such as the TDB file.
5. Results and Discussions
A thermodynamic description of the Pt-Sb system obtained in the present work is shown in Table 2. The Pt-Sb phase diagram calculated by means of the present thermodynamic parameters is presented in Figure 1, and nearly identical to the one determined by Bhan et al. [9], Durussel and Feschotte [11]. Because of the symmetry of liquid at both sides of the compound PtSb2, there is great different about the liquid at 0.20 - 0.40 Sb between the calculated results and the experimental data [7-9].
The invariant equilibria of the Pt-Sb system are listed in Table 3. In the Table 3, some calculating data is nearly to experiment data but some is very different to experiment data. There is some reasons about these. The one is that the liquid at 0.20 - 0.40 Sb is deeper than others. Other is that the liquid of the sides of PtSb2 is treated the symmetry during the assessed procedure. So it is very difficult to treat and optimize to get the same as the experimental data. In order not to change the types of reactions, the temperatures of reactions were revised in this work. As shown in the table, most satisfactory agreement is obtained between the calculations and experiments [7-9,11], where there is uncertainty in the invariant reaction temperature at 0.20 - 0.40 Sb.

Table 2. Thermodynamic parameters of the Pt-Sb systema.

Table 3. Invariant reactions of the Pt-Sb system.

Figure 1. Calculated Pt-Sb phase diagram by the present thermodynamic escription with the experimental data measured by Friedrich and Leroux [7], Nemilov and Woronow [8], Bhan et al. [9] and Kim [10].
In view of the estimated experimental errors (about 0.01 - 0.02), 24 of the 26 experimental invariant reaction compositions in the Pt-Sb system are well reproduced.
6. Conclusion
The phase relations and the thermodynamic description of the Pt-Sb system were critically evaluated from the experimental information available in the literature. A set of consistent thermodynamic parameters were derived. With the thermodynamic description available, one can now make various calculations of practical interest or in the optimization of high-order systems.
7. Acknowledgements
This work was supported by the National Natural Science Foundation of China (Nos. 50934011, 51264012) and Jiangxi University of Science and Technology Grade Scientific Research Project (No. jxxj12032).
REFERENCES
- L. W. Lin, T. Zhang, J. L. Zang and Z. S. Xu, “Dynamic Process of Carbon Deposition on Pt and Pt-Sn Catalysts for Alkane Dehydrogenation,” Applied Catalysis, Vol. 67, No. 1, 1990, pp. 11-23. doi:10.1016/S0166-9834(00)84428-0
- A. Hinz, B. Nilsson and A. Andersson, “Simulation of Transients in Heterogeneous Catalysis: A Comparison of the Stepand Pulse-Transient Techniques for the Study of Hydrocarbon Oxidation on Metal Oxide Catalysts,” Chemical Engineering Science, Vol. 55, No. 20, 2000, pp. 4385-4397.
- L. C. Li and Y. J. Lan, “Advance in the Catalysis for Hydrazine Decompositon,” Industrial Catalysis, Vol. 2, No. 1, 1994, pp. 3-7. (in Chinese)
- S. Gao and L. D. Schmidt, “Effect of Oxidation-Reduction Cycling on C2H6 Hydrogenolysis: Comparison of Ru, Rh, Ir, Ni, Pt, and Pd on SiO2,” Journal of Catalysis, Vol. 115, No. 2, 1989, pp. 356-364.
- W. Chu, Q. G. Yan, X. Liu, Q. Li, Z. L. Yu and G. X. Xiong, “Rare Earth Promoted Nickel Catalysts for the Selective Oxidation of Natural Gas to Syngas,” Studies in Surface Science and Catalysis, Vol. 119, 1998, pp. 855- 856. doi:10.1016/S0167-2991(98)80538-7
- V. P. Itkin and C. B. Alcock, “The Pt-Sb (PlatinumAntimony) System,” Journal of Phase Equilibria, Vo. 17, No. 4, 1996, pp. 356-361.
- K. Friedrich and A. Leroux, “Melting Diagram for Alloys of Platinum with Antimony,” Metallurgie, Vol. 6, 1909, pp. 1-3. (in German)
- W. A. Nemilov, N. M. Woronow and Z. Anorgm “Über Legierungen des Platins mit Antimon,” Zeitschrift für anorganische und allgemeine Chemie, Vol. 226, No. 2, 1936, pp. 177-184. doi:10.1002/zaac.19362260211
- S. Bhan, T. Godecke, K. Schubert, “Konstitution Einiger Mischungen des Platins Mit b-Elementen (B = Sn, Sb, Te),” Journal of the Less Common Metals, Vol. 19, No. 2, 1969, pp. 121-140. doi:10.1016/0022-5088(69)90027-7
- W.-S. Kim, “Phase Constitution of the Pt-Sb System,” Journal of the Korean Institute of Metals, Vol. 26, 1988, pp. 378-384.
- P. Durussel and P. Feschotte, “Les Systèmes Binaires Pd Sb et Pt Sb,” Journal of Alloys and Compounds, Vol. 176, No. 1, 1991, pp. 173-181. doi:10.1016/0925-8388(91)90023-O
- S. Bhan, K. Schubert, “Über die Struktur von Phasen Mit Kupfer Unterstruktur in Einigen t-b Legierungen (T= Ni, Pd, Pt; B = Ga, In, Tl, Pb, Sb, Bi,” Journal of the Less Common Metals, Vol. 17, No. 1, 1969, pp. 73-90. doi:10.1016/0022-5088(69)90038-1
- K. Schubert, S. Bhan, T. K. Biswas, K. Frank and E. K. Pandy, “Einige Strukturdaten Metallischer Phasen,” Naturwissenschaften, Vol. 55, No. 11, 1968, pp. 542-543. doi:10.1007/BF00660131
- P. K. Srivastava, B. C. Giessen and N. J. Grant, “A Noncrystalline Pt-Sb Phase and Its Equilibration Kinetics,” Metallurgical Transactions, Vol. 3, No. 4, 1972, pp. 977-988. doi:10.1007/BF02647675
- B. T. Mattias, “Superconducting Compounds of Nonsuperconducting Elements,” Physical Review, Vol. 90, No. 3, 1953, p. 487. doi:10.1103/PhysRev.90.487
- A. Kjekshus and K. P. Walseth, “On the Properties of the Cr(1+x)Sb, Fe(1+x)Sb, Co(1+x)Sb, Ni(1+x)Sb, Pd(1+x) Sb, and Pt(1+x)Sb Phases,” Acta Chemica Scandinavica, Vol. 23, 1969, pp. 2621-2630. doi:10.3891/acta.chem.scand.23-2621
- A. Kjekshus, “Redetermined Lattice Constants of PtP2, PtAs2, PtSb2, and alpha-PtBi2,” Acta Chemica Scandinavica, Vol. 14, 1960, pp. 1450-1451. doi:10.3891/acta.chem.scand.14-1450
- F. Roessler and Z. Anorg, “Synthese Einiger Erzmineralien und Analoger Metallverbindungen Durch Auflösen und Krystallisierenlassen DErselben in Geschmolzenen Metallen,” Zeitschrift für Anorganische Chemie, Vol. 9, No. 1, 1895, pp. 31-77. doi:10.1002/zaac.18950090108
- E. M. Jaeger and T. J. Popema, “VIII. La Détermination Exacte des Chaleurs Spécifiques à des Températures Élevées: Sur la Règle Additive des Chaleurs Atomiques des Métaux Dans Leurs Combinaisons Binaires,” Recueil des Travaux Chimiques des Pays-Bas, Vol. 55, No. 6, 1936, pp. 492-517. doi:10.1002/recl.19360550606
- A.T. Dinsdale, SGTE Pure elements (unary) database, version 4.5, 2006. (private Communication, Unpublished)
- O. Redlich and A. T. Kister, “Algebraic Representation of Thermodynamic Properties and the Classification of Solutions,” Industrial & Engineering Chemistry, Vol. 40, No. 2, 1948, pp. 345-347. doi:10.1021/ie50458a036
- Th. Massalski, “Binary Alloy Phase Diagrams,” American Society for Metals , Metal Park, 1986.
- L. Thomassen, “Crystallization of Binary Compounds of Metals of Platinum Group II,” Zeitschrift fur Physik B: Condensed Matter, Vol. 4, 1929, pp. 277-287.
- L. Thomassen, “Crystallization of Binary Compounds of Metals of Platinum Group,” Zeitschrift fur Physik B: Condensed Matter, Vol. 2, 1929, pp. 349-379.
- B. Sundman, B. Jansson and J.-O. Andersson, “The Thermo-Calc Databank System,” Calphad, Vol. 9, No. 2, 1985, pp. 153-190. doi:10.1016/0364-5916(85)90021-5
NOTES
*Corresponding author.