Removal of Real Textile Dyes by Electrocoagulation/Electroflotation in a Pilot External-Loop Airlift Reactor ()
1. Introduction
A large amount of water and chemicals are used in the textile industry for finishing and dying processes. Therefore, toxic compounds contained in dye wastewater should to be removed before it can be discharged.
Different conventional methods consisting of various combinations of biological, physical and chemical methods [1-5] were used in order to deal with textile wastewater. The biological treatment is certainly cheaper but less efficient than other methods [5]. The high efficiency of chemical oxidation can be an alternative such as UV/ H2O2, O3, and adsorption using activated carbon but the costs of these methods is relatively high.
Many papers demonstrated that the electrocoagulation (EC) technique could be an effective tool for treatment of textile wastewaters leading to high removal efficiency with relatively low cost [6]. EC consists of creating metallic hydroxides flocks within the wastewater by electrodissolution of soluble anodes namely the iron or aluminum. As the electrocoagulation/electroflotation is faster than electrocoagulation/sedimentation, the engineering approach should reach flotation with minimum energy consumption.
The literature reveals that any systematic approach design has been proposed to deal with the complex interactions between electrochemistry, colloidal forces and hydrodynamics that govern the behavior of EC reactors. Most papers use laboratory-scale EC cells in which magnetic stirring is adjusted experimentally and the separation step by floatation/sedimentation is not studied. Mollah et al. [7] described six typical configurations for industrial EC cells and reported their respective advantages and drawbacks.
Essadki et al. [8] have proposed an external-loop airlift reactor (20 l) to realize EC and electroflotation. The bubbles hydrogen produced at the cathode are used to float the flocks. The difference in density between the riser section, containing the liquid-gas mixture and the downcomer containing only the liquid, induces a flow of liquid which performs agitation. Another study [9] concerning defluoridation was carried out using batch electrocoagulation/electroflotation (EC/EF) in two reactors for comparison purpose: a stirred tank reactor (STR) close to a conventional EC cell and an external-loop airlift reactor (ELAR). The respective influences of current density, initial concentration and initial pH on the efficiency of defluoridation were investigated. The same trends were observed in both reactors, but the efficiency was higher in the STR at the beginning of the electrolysis, whereas similar values were usually achieved after 15 min operation.
In a previous work, Balla et al. [10] used the same reactor to treat reactive, disperse and mixture dyes. The colour efficiency was between 70% and 90% and COD efficiency reached 78%. However, the design of the external-loop airlift reactor proposed has a drawback concerning the continuous operation. Thus, the residence time distribution (RTD) measurements [11] revealed that a large portion of the effluent flows directly through the outlet without being processed. To overcome this problem another reactor was designed to work on batch and continuous modes.
The objective of this study is to treat a real textile dye in an innovative pilot external-loop airlift reactor functioning in a batch mode and also as a continuous reactor.
2. Materials and Methods
2.1. Reactor Design
The reactor designed as an airlift reactor with external loop has a maximum capacity of 150 liters (L). The detail of the reactor is shown in Figure 1.
The total volume of liquid in the reactor depends on the height h (1) of the liquid in the separator and can vary between 100 to 150 L.
All compartments of the reactor have a parallelepiped shape with square cross sections.
The riser is the section in which the gas phase is sparged. The riser (13) has a cross sectional side (2) equal to 20.5 cm and 103.8 cm height. The downcomer has a cross sectional side equal to 10.2 cm and 48.3 cm height. The riser-to-downcomer cross-sectional ratio (Ar/ Ad) is about 4, this value corresponds to a reaction taken place only in the riser section.
The distance between the vertical axis of the riser and downcomer is 76.8 cm which limits the recirculation of bubbles/particles from the riser into the downcomer.
The riser and the downcomer are connected at the bottom by a junction with a length of 111 cm and 10.2 cm as a cross-sectional side. This connecting column (4) is inclined at an angle of 120˚ relative to the vertical to minimize the pressure losses compared to a horizontal connecting. The particles that may escape from the flock contained in the free surface of the reactor by a possible partial erosion of the flock can be retrieved again by the hydrogen bubbles and reach again the flock.

Figure 1. External-loop airlift reactor (1: level of the effluent in the separator, 2: riser section, 3: conductivity probe, 4: connecting column, 5: separation section, 6: slot, 7: electrodes, 8: generator, 9: region closed to the liquid passage, 10: valve V1, 11: valve V2, 12: tube T1, 13: downcomer section, 14: scraping system, 15: H1: electrodes position).
The gas separator of height HS = 40 cm (5) has a length of 107.5 cm, and a width of 20.5 cm. A slot (6) is located in the part of the downcomer to allow the flock formed overflow from the reactor or to be recovered by a scraping system (14).
Two readily available aluminum or iron flat electrodes of rectangular shape (232 mm × 165 mm × 1 mm) were used as the anode and the cathode, which corresponds to S = 1050 cm2 electrode surface area. The distance between electrodes was e = 20 mm, which is a typical value in EC cells. The electrodes were placed in the riser, parallel to the main flow direction to minimize pressure drop in the riser and maximize the recirculation velocity. The axial position of the electrode could also be varied in the column. The distance (H1) between the bottom of the electrodes and the bottom of the riser was chosen H1 = 54 cm according to the induced liquid velocity that permit the stability of the flock. EC was conducted in the intensiostat mode, using a digital DC power “Power supply EA-9080 PSI”, with cables having 8 mm2 in section as recommended by the technical manual in order to minimize the Joule effect. For large amperage, the ground is considered. Current intensity I, does not exceed 20 A.
Two options are considered: a batch operation and continuous operation. The choice of one or other of the options can be achieved by handling valves.
For batch operation:
The characteristic of this external-loop airlift reactor is that the riser column is not directly connected with the connecting column: region closed to the passage of liquid from the downcomer (9). Valve V1 (10) is open and the valve V2 (11) is closed. Loops produced by the liquid are made via the tubes T1, T2 and valve V1.
For continuous operation:
Valve V1 is closed and valve V2 is open. The treated effluent exits the reactor through the tube T1 (12), the valve V2 and another tube that is open to the air to adjust the liquid level in the reactor.
The effluent is recovered without flock since the later is formed by electroflotation in the separator section and recovered by overflow (6) or by a scraping system (14).
By this process, the investment cost of installing filtration is avoided. Another advantage is that the stirring, the coagulation and flotation are achieved electrochemically by inserting electrodes in an optimal position in the riser.
2.2. Methods
Dye concentration was estimated from its absorbance characteristics in the UV vis range (200 - 800 nm), using the wavelength that provided the maximum intensity (lmax = 436, 525 and 620 nm) by UV-vis spectrophotometer (UV-Visible spectrometer Helios γ, type Gamma). COD was measured using the standard closed reflux colorimetric method. The pH was measured with a pH meter (PHM 220 Radiometer analytical). Initial pH was varied between 8 and 11. Conductivity was determined by a conductivity meter (“Cyberscan 510-cond” “Conductimeter Consort K 120”).
To cover the absorbance of various types constituting the mixture, 3 wavelengths were used: 436, 525 and 620 nm. Absorbance was measured every 15 min in order to determine the time required for the establishment of suitable efficiency.
Colour and COD removal efficiencies (YCOL, YCOD) were expressed as follows:
 (1)
(1)
 (2)
(2)
In Equation (1), A0 and A are respectively the initial absorbance and the absorbance at a certain time.
In Equation (2), (COD)0 and COD are respectively the initial COD and the COD at a certain time expressed in kg/L.
The real wastewaters have been collected from two ducts, one from acid dyestuff containing reactive dyes, the second one collected from basic dyestuff containing dispersive dyes. The two effluents were conducted to a tank to be mixed.
The percentage of each kind of the dyes is 90% of dispersive and 10% of reactive.
The reactive dyes contained Yellow SPD, Red S3B 195, Blue BRF 150%. The dispersive dyes contained Yellow Terasil 4G, Red disperse and Blue Terasil 150%.
The real wastewaters were provided from ITEX, Textile industry (Casablanca, Morocco). The characteristic of the real wastewaters are shown in Table 1.
The average liquid velocity in the downcomer (Uld) was measured by using the conductivity tracer technique. Two conductivity probes placed in the downcomer section were used to record the tracer concentration resulting from the injection of a saturated NaCl solution at the top of the downcomer using a data acquisition system (Omega OMB-55 A/D converter) connected to a PC computer. Liquid velocity was estimated using the ration of the mean transit time between the tracer peaks detected successively by the two electrodes and the distance between the probes.
In Section 3, all experiments were conducted with a batch mode.
3. Results and Discussion
3.1. Induced Liquid Velocity
The driving force for the overall liquid circulation results
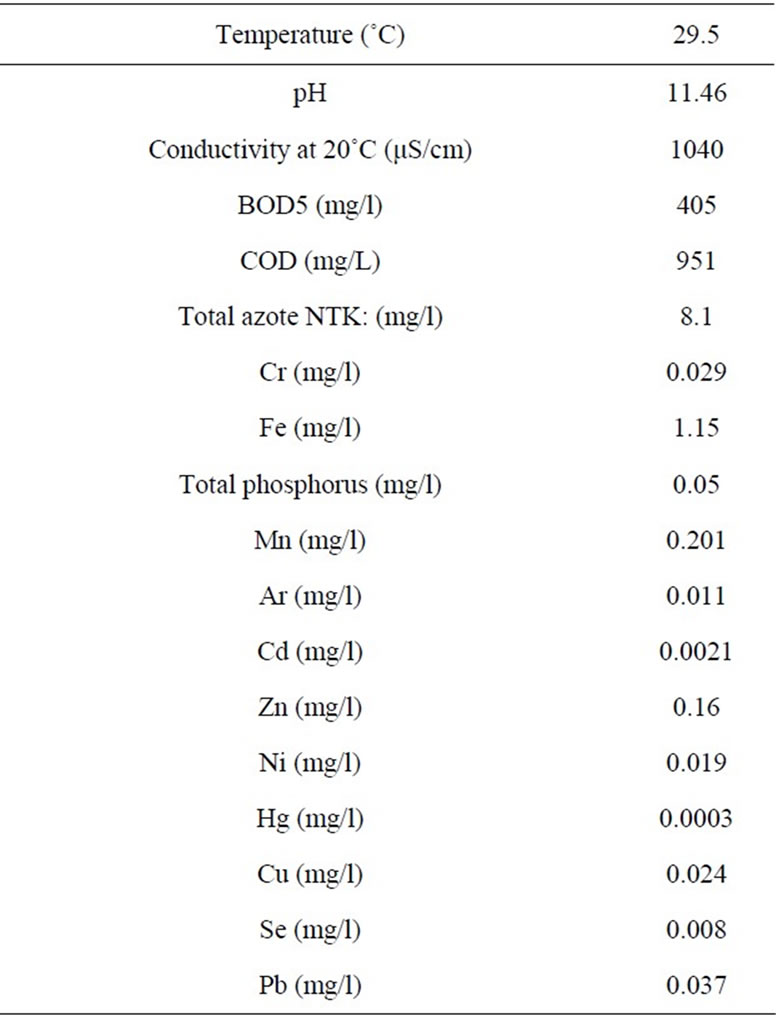
Table 1. Characteristics of real dyes effluent.
from the gas hold-up difference between the riser (εr) and the downcomer (εd), and also from the dispersion height (hD). In this work, the gas phase is electrochemicallygenerated. So hD is related to the axial position of the electrodes in the riser (H1). In a previous paper [8], the liquid velocity in the downcomer Uld was correlated to the dispersion height and current density (j).
As expected, Figure 2 shows that the liquid velocity increases with current density.
The influence of the axial position of electrodes is also shown. In all cases the flock remains stable (no erosion or break-up) as the velocity is less than in the previous work (Uld > 8 cm·s−1) [8]. In this reactor the pressure drop is important allowing to weak values of liquid velocity due to the presence of valves and tubes.
The axial position of electrodes was then chosen to be equal to H1 = 54 cm corresponding almost to the middle position of electrodes in the riser.
Complete flotation was achieved by this position allowing to good mixing using only electrochemically generated H2 bubbles.
Decolourization efficiency, COD abatement were investigated in terms of initial pH and electrolysis time in order to determine the optimum operating conditions for decolourization efficiency of real textile effluent.
Preliminary experiments suggested that 16 A was a sufficient current intensity to achieve a good decolourisation. This intensity corresponds to a current density of 31.4 mA/cm2.
Figure 3 shows the decolourization efficiency as a function of time for an initial pH of 10. The asymptotic value of decolourization efficiency (96%) was reached at a time of 90 minutes. Negative values of the removal indicate the green colour appeared during a certain time of the electrolysis. The green colour corresponds to the formation of the Fe(OH)2 according to the following reactions:
Anode: 
Cathode: 

Figure 2. Influence of the axial position of the electrodes (H1) and current intensity on the overall liquid recirculation ULd (h = 25 cm, initial pH: 8; conductivity: κ = 2.4 mS/cm).

Figure 3. Evolution of the decolourization efficiency versus time (iron electrodes, pHi = 10, j = 31.4 mA/cm2).
So: 
Fe(OH)2 is then oxidized to allow the formation of Fe(OH)3.
For an initial pH of 8, the time required to reach 93% as an asymptotic value is 180 minutes, whereas for an initial pH of 11, 190 minutes was the time to reach 90% as decolourisation efficiency (not shown).
The influence of the initial pH on COD removal is illustrated in Figure 4.
An optimum COD abatement is also obtained for an initial pH which was equal to 10. The values of COD abatement corresponded to the times required to reach the asymptotic value.
During the batch EC, the pH changed. Its evolution depended to the initial pH. In this work, the pH increased to reach 12 as shown in Figure 5.
This indicates that EC process exhibits some buffering capacity because of the balance between the production and the consumption of OH− [12], which prevents high change in pH. The buffering pH seems to reach 12. This buffering value is not the same as found by Essadki et al. [8] probably because of the use of another type of dye.
3.2. Treatment of Real Wastewater: Using Al Electrodes
Figure 6 shows the decolourization efficiency as a function of time for an initial pH of 10. The asymptotic value of decolourization efficiency (90%) was reached at a time of 130 minutes for wavelengths corresponding to 436 nm and 525 nm, whereas the decolourisation efficiency reached 95% in the case of a wavelength corresponding to 620 nm. This indicates that kinetics of decolourisation differs according to the component.
For an initial pH of 8, the asymptotic value reached 61% in a required time of 300 minutes , whereas for an initial pH of 11, 120 minutes was the time to reach only 22% as decolourisation efficiency as illustrated in Figure 7.
The corresponding COD evolution is shown in Figure 8. For an initial pH equal to 10%, 51% is the maximum COD reduction, whereas the reduction COD efficiency

Figure 4. Evolution of the COD abatement according to the initial pH: pHi (iron electrodes, j = 31.4 mA/cm2).
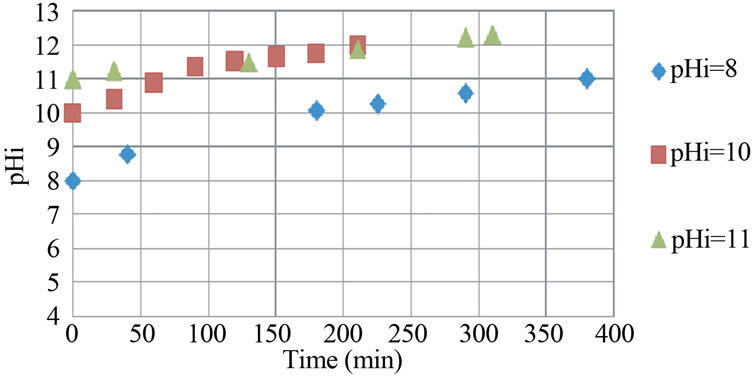
Figure 5. Evolution of pH values during EC for different values of initial pH (Iron electrodes, conductivity: κ = 2.4 mS/cm, current density: j = 31.4 mA/cm2).
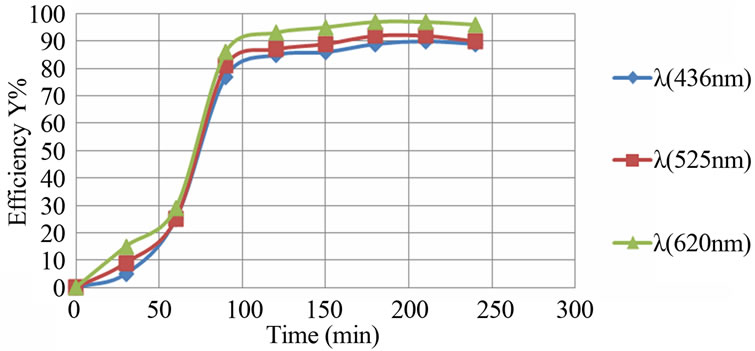
Figure 6. Evolution of the decolourization efficiency versus time (aluminum electrodes, pHi = 10, j = 31.4 mA/cm2).
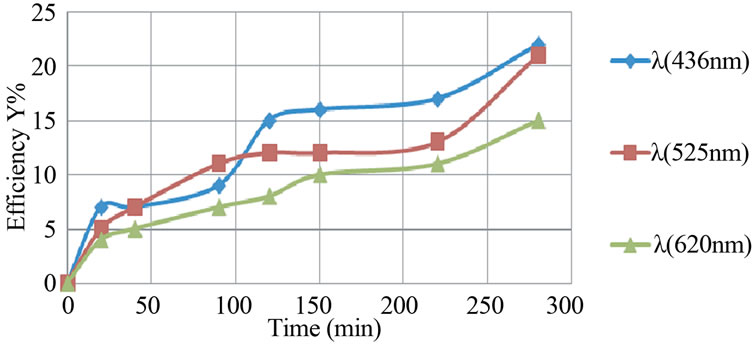
Figure 7. Evolution of the decolourization efficiency versus time (aluminum electrodes, pHi = 11, j = 31.4 mA/cm2).
does not exceed 37% for an initial pH equal to 11.
The evolution of pH during time is different to the case of iron electrodes. Thus, Figure 9 shows that pH
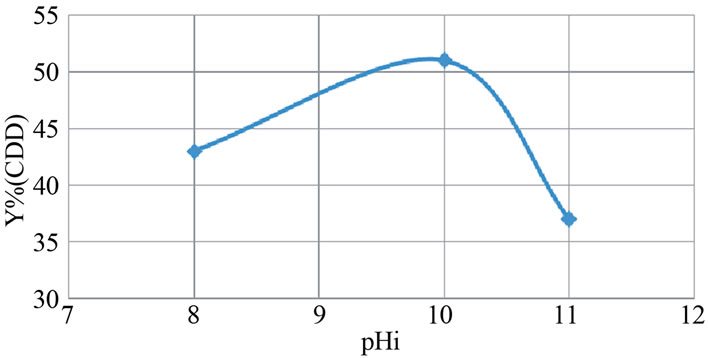
Figure 8. Evolution of the COD abatement according to the initial pH: pHi (aluminum electrodes, j = 31.4 mA/cm2).
increased for initial pH between 8 and 10 and decreased for an initial pH of 11 to reach 10.65 after 200 minutes. This demonstrates that EC process exhibits some buffering capacity as indicated above.
4. Continuous Mode
Continuous operation was then undertaken for a flowrate taking into account the decolourisation kinetic. In order to keep a residence time greater or equal to one hour and half, 60 liter per hour was chosen for the effluent flow-rate (Q).
Figure 10 shows the COD abatement versus time. The asymptotic value reaches 50% in 90 minutes. The initial pH is 10.
A complete flotation was observed and demonstrated by measuring samples at the exit of the reactor. The turbidity and the UV measurement show that the samples contained only the liquid phase.
5. Liquid and Flock Analysis
Supplementary information is provided by induced coupled plasma (ICP) analysis to determine the total soluble Al or Fe content in water. The sample of liquid was chosen after a time corresponding to 90% as efficiency decolourisation.
The measured Al concentration is 0.402 mg/L, whereas the iron concentration is only 0.068 mg/L. The presence of residual Al species above the limit of 0.2 mg/L in water is not specific to this work. It has been observed in the effluents of conventional coagulation process based on alum for which aluminum as a coagulant is often used in large excess in comparison to this work [13-15].
The flock formed is also analyzed in order to determine the amount of Al or Fe contained in the flock. The sludge was collected for times corresponding to 90% efficiency for both Al electrode and iron electrodes. The sludge was dried in oven with a temperature of 120˚C, then calcined using 500˚C as temperature of the oven.
The samples were then solubilized using HCl or not. The solution was then analyzed using ICP technique.
Table 2 summarized the results confirming that the